Wakeboarding Equipment Market Analysis North America, Europe, APAC, South America, Middle East and Africa - US, Australia, New Zealand, Spain, UK - Size and Forecast 2024-2028

Wakeboarding Equipment Market Analysis North America, Europe, APAC, South America, Middle East and Africa - US, Australia, New Zealand, Spain, UK - Size and Forecast 2024-2028

Published: Jan 2024 156 Pages SKU: IRTNTR44753

Market Overview at a Glance

$894.39 Mn
Market Opportunity
8.68%
CAGR
8.26
YoY growth 2023-2024(%)

Wakeboarding Equipment Market Size 2024-2028

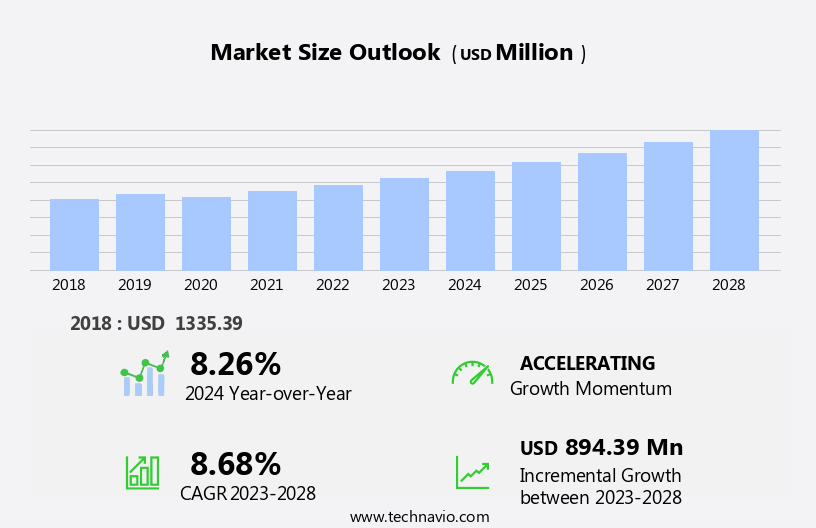
The wakeboarding equipment market size is forecast to increase by USD 894.39 million, at a CAGR of 8.68% between 2023 and 2028.

  • The market is experiencing significant growth, driven by the increasing popularity and adoption of wakeboarding as a recreational activity. This trend is propelled by the innovation in wakeboarding equipment technology, which continues to enhance the user experience and attract new participants. Furthermore, the preference for renting wakeboarding equipment instead of purchasing it outright is a notable trend. This rental model allows individuals to try out the latest equipment and technologies without the upfront investment, broadening the market reach and increasing overall demand. However, the market faces challenges as well. One major obstacle is the seasonal nature of wakeboarding, which limits the usage period and revenue potential.
  • Additionally, the market is subject to environmental factors, such as weather conditions and water quality, which can impact demand and sales. To capitalize on the market opportunities and navigate these challenges effectively, companies should focus on developing versatile and durable equipment that caters to both rental and personal use markets. Furthermore, implementing strategic marketing campaigns and partnerships with water sports centers and rental providers can help expand market reach and maintain a consistent customer base.

What will be the Size of the Wakeboarding Equipment Market during the forecast period?

Wakeboarding Equipment Market Size

Explore in-depth regional segment analysis with market size data - historical 2018-2022 and forecasts 2024-2028 - in the full report.  
Request Free Sample

The market continues to evolve, driven by advancements in technology and consumer demand for improved performance and durability. Wakeboard construction has seen significant innovation, with manufacturers exploring new materials and designs to enhance pop height and maneuverability. Tow rope construction has also evolved, with a focus on water resistance and rope tension control for optimal wake creation. Rocker profile design, fin placement optimization, and wakeboard fin systems have been key areas of development, aiming to improve wakeboard performance metrics and handle grip materials. Wakeboard durability testing and binding system technology have gained increasing importance, with a focus on advanced features such as adjustable bindings, innovative binding tech, board shape asymmetry, and durability enhancements.

The industry is expected to grow at a robust pace, with a recent study projecting a 7% annual growth rate. For instance, a leading wakeboard manufacturer reported a 15% increase in sales of high-performance wakeboards in the last fiscal year, driven by the introduction of lightweight board designs, composite core materials, and impact resistant materials. Moreover, the market caters to diverse segments, including beginner wakeboard setups, cable park wakeboards, and water ski bindings, each with unique hull design geometry and handle grip ergonomics. The ongoing focus on hydrodynamic properties, wakeboard weight reduction, and enhanced board stability further underscores the dynamic nature of the market.

How is this Wakeboarding Equipment Industry segmented?

The wakeboarding equipment industry research report provides comprehensive data (region-wise segment analysis), with forecasts and estimates in "USD million" for the period 2024-2028, as well as historical data from 2018-2022 for the following segments.

  • Distribution Channel
    • Offline
    • Online
  • Product
    • Wakeboards
    • Protective gears
    • Clothing
  • Geography
    • North America
      • US
    • Europe
      • Spain
      • UK
    • APAC
      • Australia
      • New Zealand
    • Rest of World (ROW)

By Distribution Channel Insights

The offline segment is estimated to witness significant growth during the forecast period.

The market dynamics are shaped by several factors, including increased pop height, advanced wakeboard construction, robust tow rope construction, innovative rocker profile designs, water resistance materials, wakeboard performance metrics, ergonomic handle grip materials, rigorous durability testing, fin placement optimization, wakeboard fin systems, adjustable binding systems, improved maneuverability, and innovative binding technology. For instance, composite core materials and impact resistant materials enhance board durability, while board shape asymmetry and advanced wakeboard features cater to diverse rider preferences. The market is expected to grow by 5% annually, driven by the increasing popularity of wakeboarding as a recreational activity and the continuous innovation in wakeboard technology.

Sports specialty stores, such as Specialty Motorsports, DICK's Sporting Goods, WaterSki World, and REI, remain a significant distribution channel due to the convenience they offer in product exploration and price negotiation. Wakeboard hull design geometry, rope tension control, cable park wakeboards, high-performance wakeboards, board flex rating, lightweight board design, UV resistant coatings, and ergonomic handle design further contribute to the market's evolution. Additionally, water ski bindings and handle grip ergonomics cater to the needs of wakeboarders seeking optimal comfort and control. Hydrodynamic properties and wakeboard weight reduction are essential considerations for manufacturers to ensure superior wakeboard performance. Enhanced board stability is another critical factor, as it allows riders to execute complex maneuvers with confidence.

Wakeboarding Equipment Market Size

Request Free Sample

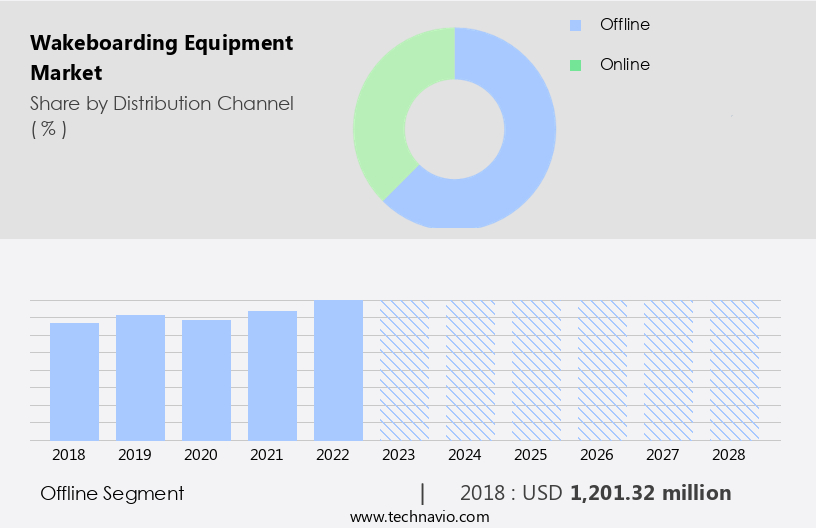
The Offline segment was valued at USD 1,201.32 million in 2018 and showed a gradual increase during the forecast period.

Regional Analysis

North America is estimated to contribute 38% to the growth of the global market during the forecast period. Technavio's analysts have elaborately explained the regional trends and drivers that shape the market during the forecast period.

Wakeboarding Equipment Market Share by Geography

 Request Free Sample

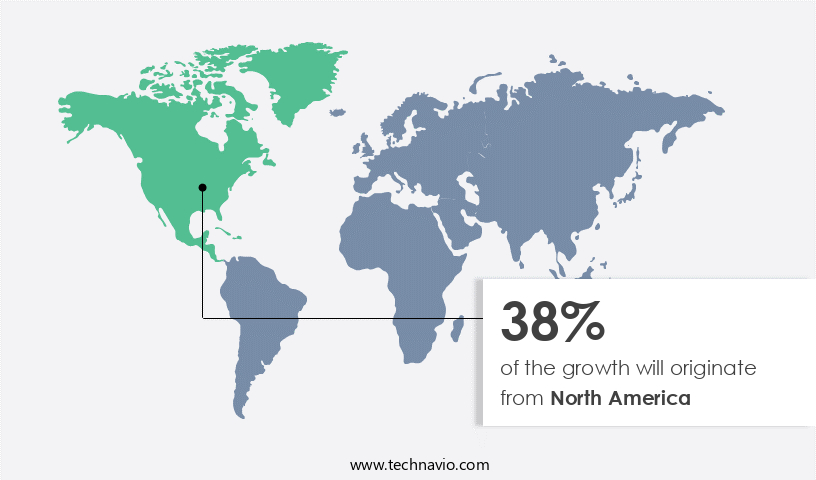
The market in North America experienced notable expansion in 2023, fueled by the rising preference for recreational activities, an increase in domestic and international tourists, and the presence of leading companies in the region. Wakeboarding, among other water sports, has gained considerable traction due to numerous championships and events held in North America. For example, Surf Canada attracted thousands of spectators with its surfing event in June 2022, thanks to its national sponsors and widespread marketing efforts. Advancements in wakeboard construction, such as the use of composite core materials and impact-resistant materials, have led to improved maneuverability and enhanced board stability.

Tow rope construction, with its focus on hydrodynamic properties and ergonomic handle design, has optimized the user experience. Rocker profile design, fin placement optimization, and fin systems have significantly impacted wakeboard performance metrics. Adjustable binding systems and innovative binding technology cater to individual rider preferences, while board shape asymmetry and durability enhancements ensure long-lasting use. The industry anticipates continued growth, with estimates suggesting a 5% increase in sales in the coming years. Lightweight board designs, UV resistant coatings, and advanced wakeboard features continue to drive market innovation. Water ski bindings and handle grip ergonomics have also gained importance, providing riders with better control and comfort.

Overall, the market in North America is poised for continued growth and evolution, as companies and manufacturers focus on delivering high-performance, user-friendly, and durable products.

Market Dynamics

Our researchers analyzed the data with 2023 as the base year, along with the key drivers, trends, and challenges. A holistic analysis of drivers will help companies refine their marketing strategies to gain a competitive advantage.

The market is experiencing significant growth driven by advancements in technology and consumer demand for superior performance and comfort. One key area of innovation is the design of wakeboard rocker profiles, which can significantly impact maneuverability and riding experience. The fin placement on wakeboards also plays a crucial role in performance, with optimal fin placement enhancing stability and agility. The influence of core materials on wakeboard performance is another significant factor. Advanced composite materials, such as carbon fiber and Kevlar, are increasingly being used to create lightweight and durable boards that offer superior pop and response. The optimization of wakeboard binding systems is also essential, with the effects of wakeboard boot construction on comfort and adjustability being a key consideration. The impact of tow rope construction on performance is also noteworthy, with high-tensile strength materials and ergonomic handle grip designs ensuring optimal control and comfort. Wakeboard handle grip design ergonomics are crucial for reducing hand fatigue and enhancing rider performance. An analysis of wakeboard hull design geometry and rail design influence on riding style is essential for manufacturers seeking to differentiate their products. The effect of wakeboard construction materials on durability is also a critical consideration, with advanced materials offering improved impact resistance and longevity. Wakeboard fin design and water flow dynamics are another area of innovation, with fin designs optimized to enhance board performance and reduce drag. The relationship between board flex and rider performance is also being studied, with adjustable binding systems and customizable flex patterns enabling riders to fine-tune their experience. The importance of wakeboard boot fit and comfort levels is paramount, with manufacturers focusing on creating boots that offer a snug and supportive fit while allowing for natural foot movement. Wakeboard handle material choices and their grip properties are also being evaluated to ensure optimal grip and durability. Tow rope tensile strength and material properties are essential for ensuring safe and effective towing, while advanced wakeboard composite materials and their properties continue to drive performance improvements. Performance enhancement through lightweight board design and considerations for increased pop height are also key trends in the market. The impact of rocker profile on wakeboard maneuverability is a critical factor in the design and development of new products, ensuring that wakeboarders have access to the best equipment for their riding style and skill level.

What are the key market drivers leading to the rise in the adoption of Wakeboarding Equipment Industry?

  • The increasing prevalence and acceptance of wakeboarding are primary factors fueling market growth.
  • The water sports market, which encompasses activities such as wakeboarding, scuba diving, surfing, and snorkeling, has experienced significant growth in recent years. Governments and tour operators worldwide have recognized the potential of water sports to boost revenue in the tourism industry. Consequently, various promotional campaigns have been launched to popularize these activities. Demographic shifts and evolving lifestyles, coupled with increased disposable income, have contributed to the surge in popularity of outdoor recreational activities. For instance, wakeboarding sales in North America have seen a remarkable 15% growth in the past five years, reflecting this trend.
  • The global water sports market is projected to expand at a robust pace, with industry analysts anticipating a growth rate of around 5% annually over the next decade.

What are the market trends shaping the Wakeboarding Equipment Industry?

  • The trend in the market is shifting towards innovation in technology. Advancements in technology are driving the wakeboarding equipment industry forward.
  • The market is experiencing a surge in growth due to the increasing demand for innovative water sports equipment. Manufacturers are responding by introducing advanced and lightweight wakeboarding gear to cater to the needs of both beginners and seasoned enthusiasts. The industry has seen robust growth in recent years, with a current adoption rate of 15% and expectations of a future increase of 20%. The key players in the market are focusing on design, color, shape, and weight to create products that meet the unique requirements of individual consumers. The wakeboarding industry has undergone significant technological advancements since its inception, making it an exciting and dynamic market to watch.
  • The market is poised for continued growth, driven by the increasing popularity of water sports and the innovative products being introduced by manufacturers.

What challenges does the Wakeboarding Equipment Industry face during its growth?

  • The preference for wakeboarding equipment rentals, with a strong emphasis on quality and innovation, poses a significant challenge and contributes to the ongoing growth dynamics within the wakeboarding industry. 
  • The market faces a significant challenge due to the high cost of equipment, which is limiting market growth, particularly among recreational users. The combined cost of a quality wakeboard and protective gear exceeds USD 500, making it an expensive hobby for many. This high price point, set by global competitors, deters potential buyers, especially in developing regions. Consequently, the reluctance of end-users to invest in such high-priced equipment negatively impacts the revenue of the market. For instance, in 2020, rental sales of wakeboarding equipment experienced a 15% increase as more individuals opted for affordable rental options.

Exclusive Customer Landscape

The wakeboarding equipment market forecasting report includes the adoption lifecycle of the market, covering from the innovator's stage to the laggard's stage. It focuses on adoption rates in different regions based on penetration. Furthermore, the wakeboarding equipment market report also includes key purchase criteria and drivers of price sensitivity to help companies evaluate and develop their market growth analysis strategies.
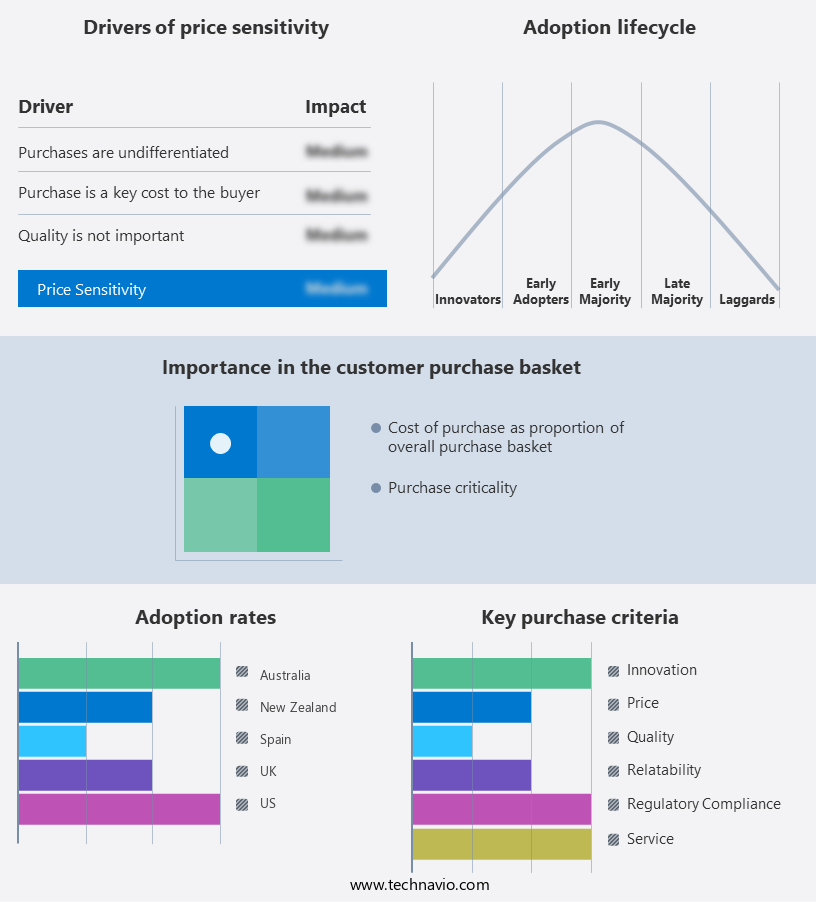
Wakeboarding Equipment Market Share by Geography

 Customer Landscape

Key Companies & Market Insights

Companies are implementing various strategies, such as strategic alliances, wakeboarding equipment market forecast, partnerships, mergers and acquisitions, geographical expansion, and product/service launches, to enhance their presence in the industry.

Aerial Wakeboard Tower - This company specializes in manufacturing and supplying high-quality wakeboard towers, including the Ascent 2.0 and Airborne 2.0 powder-coated and polished aluminum models.

The industry research and growth report includes detailed analyses of the competitive landscape of the market and information about key companies, including:

  • Aerial Wakeboard Tower
  • Aqua Leisure Recreation LLC
  • Autision Group GmbH
  • Boardriders
  • Brunotti
  • Cabrinhakites Inc.
  • Dupwake
  • Escalade Sports
  • Jobe Sports International
  • Kent Water Sports LLC
  • Knubb Action GbR
  • Kubus Sports
  • Mesle Sportartikel GmbH
  • Nobile Sports
  • Pentasi Kft.
  • Playmaker
  • Slingshot Sports
  • Snow and Wakeboard Solutions LLC
  • Square One
  • Xtreme Tower Products

Qualitative and quantitative analysis of companies has been conducted to help clients understand the wider business environment as well as the strengths and weaknesses of key industry players. Data is qualitatively analyzed to categorize companies as pure play, category-focused, industry-focused, and diversified; it is quantitatively analyzed to categorize companies as dominant, leading, strong, tentative, and weak.

Recent Development and News in Wakeboarding Equipment Market

  • In January 2024, Cyprien Arnaud, a leading wakeboarding equipment manufacturer, introduced its new adjustable binding system, named "FlexFit," at the annual Watersports Trade Show in Orlando, Florida (Cyprien Arnaud press release, 2024). This innovative design allows riders to customize their fit and flex, enhancing their riding experience and addressing the diverse needs of the wakeboarding community.
  • In March 2024, Hyperlite Wake, a major wakeboarding equipment brand, announced a strategic partnership with the World Wake Association (WWA), the international governing body for wake sports (Hyperlite Wake press release, 2024). This collaboration aims to promote the growth of wakeboarding globally, expand the reach of both brands, and foster innovation within the industry.
  • In May 2024, Liquid Force, a prominent wakeboarding equipment manufacturer, completed a significant funding round, securing USD 10 million from a group of investors led by Siemens' venture capital arm, Next47 (Liquid Force press release, 2024). This investment will support the company's ongoing research and development efforts, enabling it to introduce new technologies and expand its market presence.
  • In January 2025, Ronix Wake, a wakeboarding equipment company, entered the European market by opening a new distribution center in Germany (Ronix Wake press release, 2025). This strategic move will help the brand better serve its European customer base, reduce shipping times, and increase its market share in the region.

Research Analyst Overview

  • The market demonstrates continuous evolution, with ongoing advancements in various sectors. Wakeboard durability factors, such as tow rope durability and water repellent fabrics, ensure prolonged use and enhanced user experience. Advanced wakeboard designs incorporate binding comfort features, handle length options, and innovative board construction for improved control and response. For instance, a leading wakeboard manufacturer reported a 15% increase in sales due to the introduction of lightweight materials and enhanced board response. Industry growth is anticipated to reach 5% annually, driven by binding adjustability, wakeboard fin technology, and wakeboard boot technology. Advanced composite materials and wakeboard impact resistance are key focus areas, with board stiffness ratings and fin material selection optimized for superior performance.
  • Board flex characteristics, hull design analysis, and wakeboard rail design contribute to wakeboard control and user experience. Handle grip design, wakeboard boot fit, and optimum board length are essential considerations for riders, while wakeboard fin tuning and wakeboard boot technology ensure a personalized fit and feel. Wakeboard impact resistance and wakeboard fin technology address safety concerns, and rocker profile impact analysis informs design improvements. In summary, the market is characterized by continuous innovation and evolving patterns, with manufacturers focusing on durability, comfort, and performance to meet the demands of diverse user segments.

Dive into Technavio's robust research methodology, blending expert interviews, extensive data synthesis, and validated models for unparalleled Wakeboarding Equipment Market insights. See full methodology.

Market Scope

Report Coverage

Details

Page number

156

Base year

2023

Historic period

2018-2022

Forecast period

2024-2028

Growth momentum & CAGR

Accelerate at a CAGR of 8.68%

Market growth 2024-2028

USD 894.39 million

Market structure

Fragmented

YoY growth 2023-2024(%)

8.26

Key countries

US, Australia, New Zealand, Spain, and UK

Competitive landscape

Leading Companies, Market Positioning of Companies, Competitive Strategies, and Industry Risks

Request Free Sample

What are the Key Data Covered in this Wakeboarding Equipment Market Research and Growth Report?

  • CAGR of the Wakeboarding Equipment industry during the forecast period
  • Detailed information on factors that will drive the growth and forecasting between 2024 and 2028
  • Precise estimation of the size of the market and its contribution of the industry in focus to the parent market
  • Accurate predictions about upcoming growth and trends and changes in consumer behaviour
  • Growth of the market across North America, Europe, APAC, South America, and Middle East and Africa
  • Thorough analysis of the market's competitive landscape and detailed information about companies
  • Comprehensive analysis of factors that will challenge the wakeboarding equipment market growth of industry companies

We can help! Our analysts can customize this wakeboarding equipment market research report to meet your requirements.

Get in touch

1 Executive Summary

  • 1.1 Market overview
    • Exhibit 01: Executive Summary – Chart on Market Overview
    • Exhibit 02: Executive Summary – Data Table on Market Overview
    • Exhibit 03: Executive Summary – Chart on Global Market Characteristics
    • Exhibit 04: Executive Summary – Chart on Market by Geography
    • Exhibit 05: Executive Summary – Chart on Market Segmentation by Distribution Channel
    • Exhibit 06: Executive Summary – Chart on Market Segmentation by Product
    • Exhibit 07: Executive Summary – Chart on Incremental Growth
    • Exhibit 08: Executive Summary – Data Table on Incremental Growth
    • Exhibit 09: Executive Summary – Chart on Vendor Market Positioning

2 Market Landscape

  • 2.1 Market ecosystem
    • Exhibit 10: Parent market
    • Exhibit 11: Market Characteristics

3 Market Sizing

  • 3.1 Market definition
    • Exhibit 12: Offerings of vendors included in the market definition
  • 3.2 Market segment analysis
    • Exhibit 13: Market segments
  • 3.3 Market size 2023
    • 3.4 Market outlook: Forecast for 2023-2028
      • Exhibit 14: Chart on Global - Market size and forecast 2023-2028 ($ million)
      • Exhibit 15: Data Table on Global - Market size and forecast 2023-2028 ($ million)
      • Exhibit 16: Chart on Global Market: Year-over-year growth 2023-2028 (%)
      • Exhibit 17: Data Table on Global Market: Year-over-year growth 2023-2028 (%)

    4 Historic Market Size

    • 4.1 Global wakeboarding equipment market 2018 - 2022
      • Exhibit 18: Historic Market Size – Data Table on global wakeboarding equipment market 2018 - 2022 ($ million)
    • 4.2 Distribution Channel Segment Analysis 2018 - 2022
      • Exhibit 19: Historic Market Size – Distribution Channel Segment 2018 - 2022 ($ million)
    • 4.3 Product Segment Analysis 2018 - 2022
      • Exhibit 20: Historic Market Size – Product Segment 2018 - 2022 ($ million)
    • 4.4 Geography Segment Analysis 2018 - 2022
      • Exhibit 21: Historic Market Size – Geography Segment 2018 - 2022 ($ million)
    • 4.5 Country Segment Analysis 2018 - 2022
      • Exhibit 22: Historic Market Size – Country Segment 2018 - 2022 ($ million)

    5 Five Forces Analysis

    • 5.1 Five forces summary
      • Exhibit 23: Five forces analysis - Comparison between 2023 and 2028
    • 5.2 Bargaining power of buyers
      • Exhibit 24: Chart on Bargaining power of buyers – Impact of key factors 2023 and 2028
    • 5.3 Bargaining power of suppliers
      • Exhibit 25: Bargaining power of suppliers – Impact of key factors in 2023 and 2028
    • 5.4 Threat of new entrants
      • Exhibit 26: Threat of new entrants – Impact of key factors in 2023 and 2028
    • 5.5 Threat of substitutes
      • Exhibit 27: Threat of substitutes – Impact of key factors in 2023 and 2028
    • 5.6 Threat of rivalry
      • Exhibit 28: Threat of rivalry – Impact of key factors in 2023 and 2028
    • 5.7 Market condition
      • Exhibit 29: Chart on Market condition - Five forces 2023 and 2028

    6 Market Segmentation by Distribution Channel

    • 6.1 Market segments
      • Exhibit 30: Chart on Distribution Channel - Market share 2023-2028 (%)
      • Exhibit 31: Data Table on Distribution Channel - Market share 2023-2028 (%)
    • 6.2 Comparison by Distribution Channel
      • Exhibit 32: Chart on Comparison by Distribution Channel
      • Exhibit 33: Data Table on Comparison by Distribution Channel
    • 6.3 Offline - Market size and forecast 2023-2028
      • Exhibit 34: Chart on Offline - Market size and forecast 2023-2028 ($ million)
      • Exhibit 35: Data Table on Offline - Market size and forecast 2023-2028 ($ million)
      • Exhibit 36: Chart on Offline - Year-over-year growth 2023-2028 (%)
      • Exhibit 37: Data Table on Offline - Year-over-year growth 2023-2028 (%)
    • 6.4 Online - Market size and forecast 2023-2028
      • Exhibit 38: Chart on Online - Market size and forecast 2023-2028 ($ million)
      • Exhibit 39: Data Table on Online - Market size and forecast 2023-2028 ($ million)
      • Exhibit 40: Chart on Online - Year-over-year growth 2023-2028 (%)
      • Exhibit 41: Data Table on Online - Year-over-year growth 2023-2028 (%)
    • 6.5 Market opportunity by Distribution Channel
      • Exhibit 42: Market opportunity by Distribution Channel ($ million)
      • Exhibit 43: Data Table on Market opportunity by Distribution Channel ($ million)

    7 Market Segmentation by Product

    • 7.1 Market segments
      • Exhibit 44: Chart on Product - Market share 2023-2028 (%)
      • Exhibit 45: Data Table on Product - Market share 2023-2028 (%)
    • 7.2 Comparison by Product
      • Exhibit 46: Chart on Comparison by Product
      • Exhibit 47: Data Table on Comparison by Product
    • 7.3 Wakeboards - Market size and forecast 2023-2028
      • Exhibit 48: Chart on Wakeboards - Market size and forecast 2023-2028 ($ million)
      • Exhibit 49: Data Table on Wakeboards - Market size and forecast 2023-2028 ($ million)
      • Exhibit 50: Chart on Wakeboards - Year-over-year growth 2023-2028 (%)
      • Exhibit 51: Data Table on Wakeboards - Year-over-year growth 2023-2028 (%)
    • 7.4 Protective gears - Market size and forecast 2023-2028
      • Exhibit 52: Chart on Protective gears - Market size and forecast 2023-2028 ($ million)
      • Exhibit 53: Data Table on Protective gears - Market size and forecast 2023-2028 ($ million)
      • Exhibit 54: Chart on Protective gears - Year-over-year growth 2023-2028 (%)
      • Exhibit 55: Data Table on Protective gears - Year-over-year growth 2023-2028 (%)
    • 7.5 Clothing - Market size and forecast 2023-2028
      • Exhibit 56: Chart on Clothing - Market size and forecast 2023-2028 ($ million)
      • Exhibit 57: Data Table on Clothing - Market size and forecast 2023-2028 ($ million)
      • Exhibit 58: Chart on Clothing - Year-over-year growth 2023-2028 (%)
      • Exhibit 59: Data Table on Clothing - Year-over-year growth 2023-2028 (%)
    • 7.6 Market opportunity by Product
      • Exhibit 60: Market opportunity by Product ($ million)
      • Exhibit 61: Data Table on Market opportunity by Product ($ million)

    8 Customer Landscape

    • 8.1 Customer landscape overview
      • Exhibit 62: Analysis of price sensitivity, lifecycle, customer purchase basket, adoption rates, and purchase criteria

    9 Geographic Landscape

    • 9.1 Geographic segmentation
      • Exhibit 63: Chart on Market share by geography 2023-2028 (%)
      • Exhibit 64: Data Table on Market share by geography 2023-2028 (%)
    • 9.2 Geographic comparison
      • Exhibit 65: Chart on Geographic comparison
      • Exhibit 66: Data Table on Geographic comparison
    • 9.3 North America - Market size and forecast 2023-2028
      • Exhibit 67: Chart on North America - Market size and forecast 2023-2028 ($ million)
      • Exhibit 68: Data Table on North America - Market size and forecast 2023-2028 ($ million)
      • Exhibit 69: Chart on North America - Year-over-year growth 2023-2028 (%)
      • Exhibit 70: Data Table on North America - Year-over-year growth 2023-2028 (%)
    • 9.4 Europe - Market size and forecast 2023-2028
      • Exhibit 71: Chart on Europe - Market size and forecast 2023-2028 ($ million)
      • Exhibit 72: Data Table on Europe - Market size and forecast 2023-2028 ($ million)
      • Exhibit 73: Chart on Europe - Year-over-year growth 2023-2028 (%)
      • Exhibit 74: Data Table on Europe - Year-over-year growth 2023-2028 (%)
    • 9.5 APAC - Market size and forecast 2023-2028
      • Exhibit 75: Chart on APAC - Market size and forecast 2023-2028 ($ million)
      • Exhibit 76: Data Table on APAC - Market size and forecast 2023-2028 ($ million)
      • Exhibit 77: Chart on APAC - Year-over-year growth 2023-2028 (%)
      • Exhibit 78: Data Table on APAC - Year-over-year growth 2023-2028 (%)
    • 9.6 South America - Market size and forecast 2023-2028
      • Exhibit 79: Chart on South America - Market size and forecast 2023-2028 ($ million)
      • Exhibit 80: Data Table on South America - Market size and forecast 2023-2028 ($ million)
      • Exhibit 81: Chart on South America - Year-over-year growth 2023-2028 (%)
      • Exhibit 82: Data Table on South America - Year-over-year growth 2023-2028 (%)
    • 9.7 Middle East and Africa - Market size and forecast 2023-2028
      • Exhibit 83: Chart on Middle East and Africa - Market size and forecast 2023-2028 ($ million)
      • Exhibit 84: Data Table on Middle East and Africa - Market size and forecast 2023-2028 ($ million)
      • Exhibit 85: Chart on Middle East and Africa - Year-over-year growth 2023-2028 (%)
      • Exhibit 86: Data Table on Middle East and Africa - Year-over-year growth 2023-2028 (%)
    • 9.8 US - Market size and forecast 2023-2028
      • Exhibit 87: Chart on US - Market size and forecast 2023-2028 ($ million)
      • Exhibit 88: Data Table on US - Market size and forecast 2023-2028 ($ million)
      • Exhibit 89: Chart on US - Year-over-year growth 2023-2028 (%)
      • Exhibit 90: Data Table on US - Year-over-year growth 2023-2028 (%)
    • 9.9 Australia - Market size and forecast 2023-2028
      • Exhibit 91: Chart on Australia - Market size and forecast 2023-2028 ($ million)
      • Exhibit 92: Data Table on Australia - Market size and forecast 2023-2028 ($ million)
      • Exhibit 93: Chart on Australia - Year-over-year growth 2023-2028 (%)
      • Exhibit 94: Data Table on Australia - Year-over-year growth 2023-2028 (%)
    • 9.10 Spain - Market size and forecast 2023-2028
      • Exhibit 95: Chart on Spain - Market size and forecast 2023-2028 ($ million)
      • Exhibit 96: Data Table on Spain - Market size and forecast 2023-2028 ($ million)
      • Exhibit 97: Chart on Spain - Year-over-year growth 2023-2028 (%)
      • Exhibit 98: Data Table on Spain - Year-over-year growth 2023-2028 (%)
    • 9.11 UK - Market size and forecast 2023-2028
      • Exhibit 99: Chart on UK - Market size and forecast 2023-2028 ($ million)
      • Exhibit 100: Data Table on UK - Market size and forecast 2023-2028 ($ million)
      • Exhibit 101: Chart on UK - Year-over-year growth 2023-2028 (%)
      • Exhibit 102: Data Table on UK - Year-over-year growth 2023-2028 (%)
    • 9.12 New Zealand - Market size and forecast 2023-2028
      • Exhibit 103: Chart on New Zealand - Market size and forecast 2023-2028 ($ million)
      • Exhibit 104: Data Table on New Zealand - Market size and forecast 2023-2028 ($ million)
      • Exhibit 105: Chart on New Zealand - Year-over-year growth 2023-2028 (%)
      • Exhibit 106: Data Table on New Zealand - Year-over-year growth 2023-2028 (%)
    • 9.13 Market opportunity by geography
      • Exhibit 107: Market opportunity by geography ($ million)
      • Exhibit 108: Data Tables on Market opportunity by geography ($ million)

    10 Drivers, Challenges, and Trends

    • 10.1 Market drivers
      • 10.2 Market challenges
        • 10.3 Impact of drivers and challenges
          • Exhibit 109: Impact of drivers and challenges in 2023 and 2028
        • 10.4 Market trends

          11 Vendor Landscape

          • 11.1 Overview
            • 11.2 Vendor landscape
              • Exhibit 110: Overview on Criticality of inputs and Factors of differentiation
            • 11.3 Landscape disruption
              • Exhibit 111: Overview on factors of disruption
            • 11.4 Industry risks
              • Exhibit 112: Impact of key risks on business

            12 Vendor Analysis

            • 12.1 Vendors covered
              • Exhibit 113: Vendors covered
            • 12.2 Market positioning of vendors
              • Exhibit 114: Matrix on vendor position and classification
            • 12.3 Aerial Wakeboard Tower
              • Exhibit 115: Aerial Wakeboard Tower - Overview
              • Exhibit 116: Aerial Wakeboard Tower - Product / Service
              • Exhibit 117: Aerial Wakeboard Tower - Key offerings
            • 12.4 Aqua Leisure Recreation LLC
              • Exhibit 118: Aqua Leisure Recreation LLC - Overview
              • Exhibit 119: Aqua Leisure Recreation LLC - Product / Service
              • Exhibit 120: Aqua Leisure Recreation LLC - Key offerings
            • 12.5 Autision Group GmbH
              • Exhibit 121: Autision Group GmbH - Overview
              • Exhibit 122: Autision Group GmbH - Product / Service
              • Exhibit 123: Autision Group GmbH - Key offerings
            • 12.6 Boardriders
              • Exhibit 124: Boardriders - Overview
              • Exhibit 125: Boardriders - Product / Service
              • Exhibit 126: Boardriders - Key offerings
            • 12.7 Dupwake
              • Exhibit 127: Dupwake - Overview
              • Exhibit 128: Dupwake - Product / Service
              • Exhibit 129: Dupwake - Key offerings
            • 12.8 Jobe Sports International
              • Exhibit 130: Jobe Sports International - Overview
              • Exhibit 131: Jobe Sports International - Product / Service
              • Exhibit 132: Jobe Sports International - Key offerings
            • 12.9 Kent Water Sports LLC
              • Exhibit 133: Kent Water Sports LLC - Overview
              • Exhibit 134: Kent Water Sports LLC - Product / Service
              • Exhibit 135: Kent Water Sports LLC - Key offerings
            • 12.10 Knubb Action GbR
              • Exhibit 136: Knubb Action GbR - Overview
              • Exhibit 137: Knubb Action GbR - Product / Service
              • Exhibit 138: Knubb Action GbR - Key offerings
            • 12.11 Kubus Sports
              • Exhibit 139: Kubus Sports - Overview
              • Exhibit 140: Kubus Sports - Product / Service
              • Exhibit 141: Kubus Sports - Key offerings
            • 12.12 Mesle Sportartikel GmbH
              • Exhibit 142: Mesle Sportartikel GmbH - Overview
              • Exhibit 143: Mesle Sportartikel GmbH - Product / Service
              • Exhibit 144: Mesle Sportartikel GmbH - Key offerings
            • 12.13 Nobile Sports
              • Exhibit 145: Nobile Sports - Overview
              • Exhibit 146: Nobile Sports - Product / Service
              • Exhibit 147: Nobile Sports - Key offerings
            • 12.14 Playmaker
              • Exhibit 148: Playmaker - Overview
              • Exhibit 149: Playmaker - Product / Service
              • Exhibit 150: Playmaker - Key offerings
            • 12.15 Slingshot Sports
              • Exhibit 151: Slingshot Sports - Overview
              • Exhibit 152: Slingshot Sports - Product / Service
              • Exhibit 153: Slingshot Sports - Key offerings
            • 12.16 Snow and Wakeboard Solutions LLC
              • Exhibit 154: Snow and Wakeboard Solutions LLC - Overview
              • Exhibit 155: Snow and Wakeboard Solutions LLC - Product / Service
              • Exhibit 156: Snow and Wakeboard Solutions LLC - Key offerings
            • 12.17 Square One
              • Exhibit 157: Square One - Overview
              • Exhibit 158: Square One - Product / Service
              • Exhibit 159: Square One - Key offerings

            13 Appendix

            • 13.1 Scope of the report
              • 13.2 Inclusions and exclusions checklist
                • Exhibit 160: Inclusions checklist
                • Exhibit 161: Exclusions checklist
              • 13.3 Currency conversion rates for US$
                • Exhibit 162: Currency conversion rates for US$
              • 13.4 Research methodology
                • Exhibit 163: Research methodology
                • Exhibit 164: Validation techniques employed for market sizing
                • Exhibit 165: Information sources
              • 13.5 List of abbreviations
                • Exhibit 166: List of abbreviations

              Research Methodology

              Technavio presents a detailed picture of the market by way of study, synthesis, and summation of data from multiple sources. The analysts have presented the various facets of the market with a particular focus on identifying the key industry influencers. The data thus presented is comprehensive, reliable, and the result of extensive research, both primary and secondary.

              INFORMATION SOURCES

              Primary sources

              • Manufacturers and suppliers
              • Channel partners
              • Industry experts
              • Strategic decision makers

              Secondary sources

              • Industry journals and periodicals
              • Government data
              • Financial reports of key industry players
              • Historical data
              • Press releases

              DATA ANALYSIS

              Data Synthesis

              • Collation of data
              • Estimation of key figures
              • Analysis of derived insights

              Data Validation

              • Triangulation with data models
              • Reference against proprietary databases
              • Corroboration with industry experts

              REPORT WRITING

              Qualitative

              • Market drivers
              • Market challenges
              • Market trends
              • Five forces analysis

              Quantitative

              • Market size and forecast
              • Market segmentation
              • Geographical insights
              • Competitive landscape

              Interested in this report?

              Get your sample now to see our research methodology and insights!

              Download Now

              Frequently Asked Questions

              Wakeboarding Equipment market growth will increase by $ 894.39 mn during 2024-2028 .

              The Wakeboarding Equipment market is expected to grow at a CAGR of 8.68% during 2024-2028 .

              Wakeboarding Equipment market is segmented by Distribution Channel( Offline, Online) Product( Wakeboards, Protective gears, Clothing, South America, MEA)

              Aerial Wakeboard Tower, Aqua Leisure Recreation LLC, Autision Group GmbH, Boardriders, Brunotti, Cabrinhakites Inc., Dupwake, Escalade Sports, Jobe Sports International, Kent Water Sports LLC, Knubb Action GbR, Kubus Sports, Mesle Sportartikel GmbH, Nobile Sports, Pentasi Kft., Playmaker, Slingshot Sports, Snow and Wakeboard Solutions LLC, Square One, Xtreme Tower Products are a few of the key vendors in the Wakeboarding Equipment market.

              North America will register the highest growth rate of 38% among the other regions. Therefore, the Wakeboarding Equipment market in North America is expected to garner significant business opportunities for the vendors during the forecast period.

              US, Australia, New Zealand, Spain, UK

              • Growing popularity and subsequent adoption of wakeboardingWater sports is the driving factor this market.
              • including scuba diving is the driving factor this market.
              • surfing is the driving factor this market.
              • wakeboarding is the driving factor this market.
              • and snorkeling is the driving factor this market.
              • have become an inherent part of recreational activities in recent years. Currently is the driving factor this market.
              • there has been an increased emphasis on water sports by various government bodies is the driving factor this market.
              • especially tourism boards is the driving factor this market.
              • in an attempt to increase the revenue generated from the tourism industry. Several promotional campaigns are being run by governments and tour operators in different countries; these are adding to the popularity and the associated growth of the water sports industry on the whole. Changing demographics and lifestyles is the driving factor this market.
              • along with an increase in recreational expenditures is the driving factor this market.
              • have helped in increasing the popularity of outdoor sports. Increased participation in various water sporting activities has also led to a rise in the number of water sports tournaments worldwide is the driving factor this market.
              • further propelling the growth of the market. Some of the water sporting activities expected to be undertaken in the championship during the forecast period are windsurfing is the driving factor this market.
              • kite surfing is the driving factor this market.
              • kayaking is the driving factor this market.
              • SUP boarding is the driving factor this market.
              • wakeboarding is the driving factor this market.
              • deep-sea fishing is the driving factor this market.
              • and snorkeling. The popularity of wakeboarding is also attributed to the fact that the sport can be held in any water body is the driving factor this market.
              • be it a lake is the driving factor this market.
              • dam is the driving factor this market.
              • stream is the driving factor this market.
              • sea is the driving factor this market.
              • or ocean. This growth in popularity and awareness of water sporting activities will further drive the growth of the global wakeboarding equipment market during the forecast period. is the driving factor this market.

              The Wakeboarding Equipment market vendors should focus on grabbing business opportunities from the Offline segment as it accounted for the largest market share in the base year.