
Waste To Energy Market Size 2026-2030
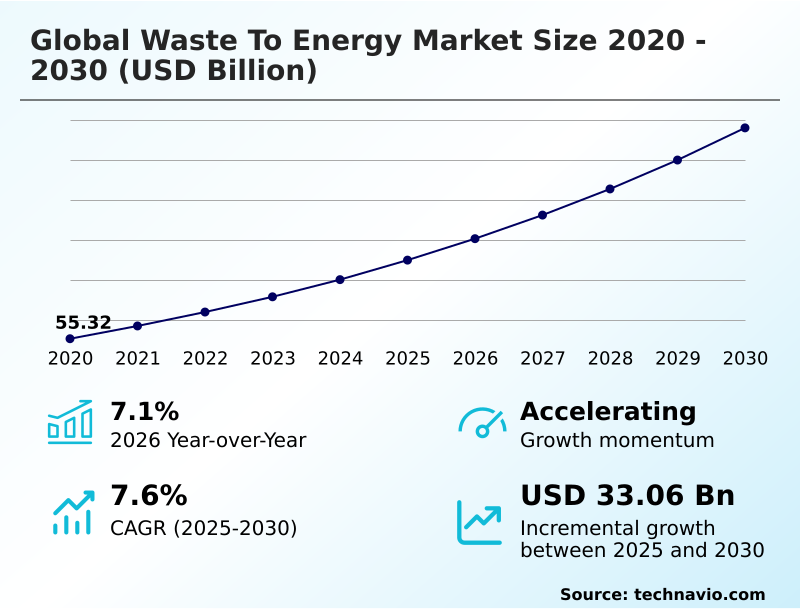
The waste to energy market size is valued to increase by USD 33.06 billion, at a CAGR of 7.6% from 2025 to 2030. Government mandated carbon emission reduction will drive the waste to energy market.
Major Market Trends & Insights
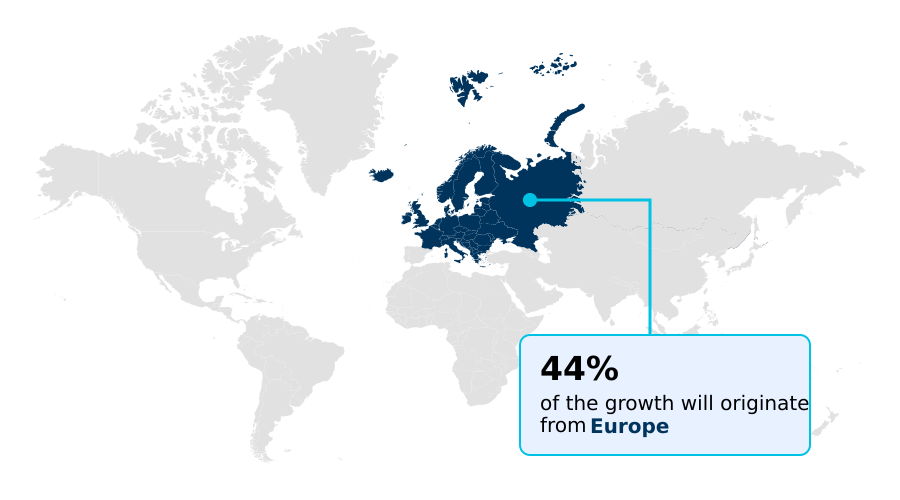
- Europe dominated the market and accounted for a 44.1% growth during the forecast period.
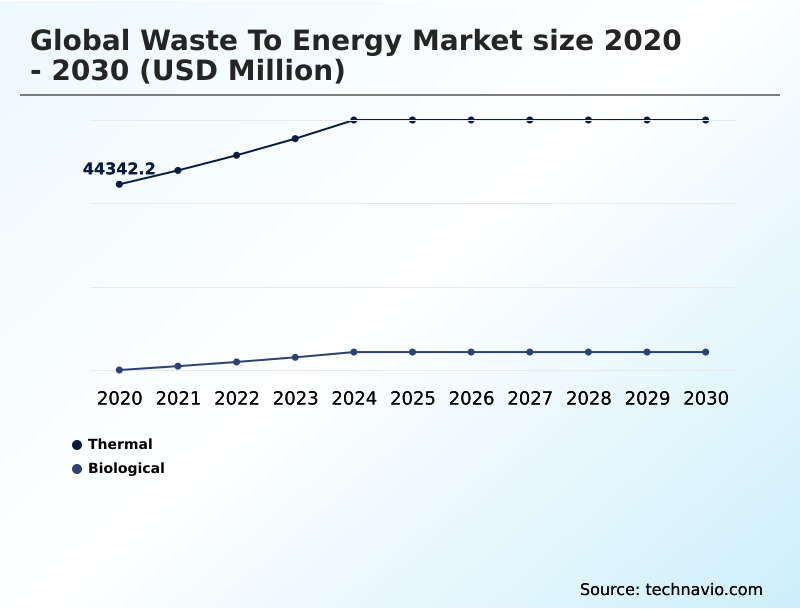
- By Technology - Thermal segment was valued at USD 55.89 billion in 2024
- By Application - Electricity segment accounted for the largest market revenue share in 2024
Market Size & Forecast
- Market Opportunities: USD 52.71 billion
- Market Future Opportunities: USD 33.06 billion
- CAGR from 2025 to 2030 : 7.6%
Market Summary
- The waste to energy market is undergoing a significant evolution, driven by the dual needs of sustainable municipal solid waste management and the demand for renewable energy sources. This industry converts non-recyclable refuse into electricity and heat using thermal treatment technologies and biological treatment methods.
- A key driver is the global shift toward a circular economy, compelling municipalities to seek alternatives to landfilling. For instance, a city might enter a long-term power purchase agreement to finance an integrated waste management facility, ensuring both environmental compliance and a stable energy supply.
- However, the market faces challenges related to the high capital costs of pyrolysis and gasification systems and the operational complexities of managing variable waste streams. Trends such as carbon capture and storage integration and the recovery of valuable materials from bottom ash are reshaping project economics.
- Technological advancements in flue gas cleaning technologies and combustion control systems are enhancing energy recovery efficiency and minimizing environmental impact, making waste to energy a critical component of modern urban infrastructure and decarbonization strategies.
What will be the Size of the Waste To Energy Market during the forecast period?
Get Key Insights on Market Forecast (PDF) Get Free Sample
How is the Waste To Energy Market Segmented?
The waste to energy industry research report provides comprehensive data (region-wise segment analysis), with forecasts and estimates in "USD million" for the period 2026-2030, as well as historical data from 2020-2024 for the following segments.
- Technology
- Thermal
- Biological
- Application
- Electricity
- Heat
- Type
- Municipal solid waste
- Agricultural waste
- Process waste
- Others
- Geography
- Europe
- Germany
- France
- UK
- APAC
- China
- Japan
- India
- North America
- US
- Canada
- Mexico
- Middle East and Africa
- UAE
- Saudi Arabia
- South Africa
- South America
- Brazil
- Argentina
- Rest of World (ROW)
- Europe
By Technology Insights
The thermal segment is estimated to witness significant growth during the forecast period.
Thermal technologies dominate the waste to energy market, focusing on municipal solid waste management through processes like incineration and advanced pyrolysis and gasification systems.
Continuous innovation in flue gas cleaning technologies is critical for meeting stringent environmental regulations, while developments in waste sorting automation enhance feedstock quality. The economic viability of these capital-intensive projects often hinges on public-private partnership models.
Modernization efforts that improve the heat recovery steam generator and overall energy recovery efficiency are central to operational strategy, with some upgrades boosting heat recovery rates by over 15%.
Furthermore, effective resource recovery from ash is creating new value streams, reinforcing the segment's role in a circular economy.
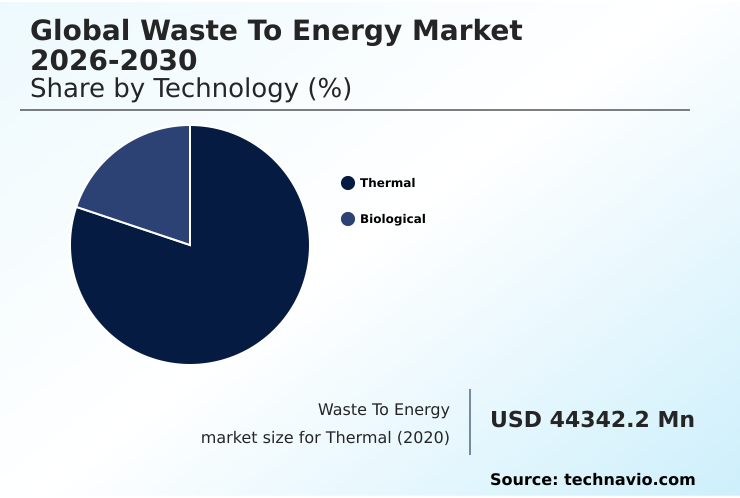
The Thermal segment was valued at USD 55.89 billion in 2024 and showed a gradual increase during the forecast period.
Regional Analysis
Europe is estimated to contribute 44.1% to the growth of the global market during the forecast period.Technavio’s analysts have elaborately explained the regional trends and drivers that shape the market during the forecast period.
See How Waste To Energy Market Demand is Rising in Europe Get Free Sample
The geographic landscape of the waste to energy market is defined by mature, optimization-focused regions and high-growth emerging territories.
Europe, which accounts for over 44% of the incremental growth opportunity, exemplifies a mature market where the focus is on maximizing landfill diversion rates and integrating facilities with district heating networks.
In contrast, the APAC region is projected to expand at a rate of 8.1%, driven by rapid urbanization and strong policy support for new infrastructure.
Key technologies like the reciprocating grate incinerator and advanced boiler and turbine systems are standard, but regional priorities differ. For example, environmental compliance monitoring and waste feedstock characterization are paramount in Europe, while APAC prioritizes scalable solutions.
Investment in bottom ash processing and decentralized energy systems is growing globally, enhancing steam cycle efficiency and resource recovery.
Market Dynamics
Our researchers analyzed the data with 2025 as the base year, along with the key drivers, trends, and challenges. A holistic analysis of drivers will help companies refine their marketing strategies to gain a competitive advantage.
- Strategic decision-making in the waste to energy sector requires a nuanced understanding of its evolving technological and economic landscape. The debate between thermal vs biological waste to energy approaches continues, with thermal methods favored for mixed municipal waste while biological processes excel with organic streams like agricultural waste.
- A key focus is the economic viability of small-scale gasification, which offers decentralized solutions but faces different financial hurdles than large-scale plants. The industry is also exploring how to convert plastic waste to hydrogen fuel, creating higher-value outputs.
- However, significant challenges in financing WTE infrastructure persist, compounded by the public perception of waste incineration, which can create regulatory hurdles for new WTE projects. Improving boiler efficiency in WTE plants and the role of AI in combustion control are critical for optimizing performance.
- The recovery of non-ferrous metals from ash and advanced flue gas treatment for dioxin removal enhance the environmental profile and revenue potential. Success increasingly depends on securing long-term contracts for waste supply and developing financial models for WTE investments that align with the broader waste to energy in circular economy goals.
- Projects incorporating advanced feedstock analysis see an energy output boost of over 12% compared to those with less sophisticated sorting.
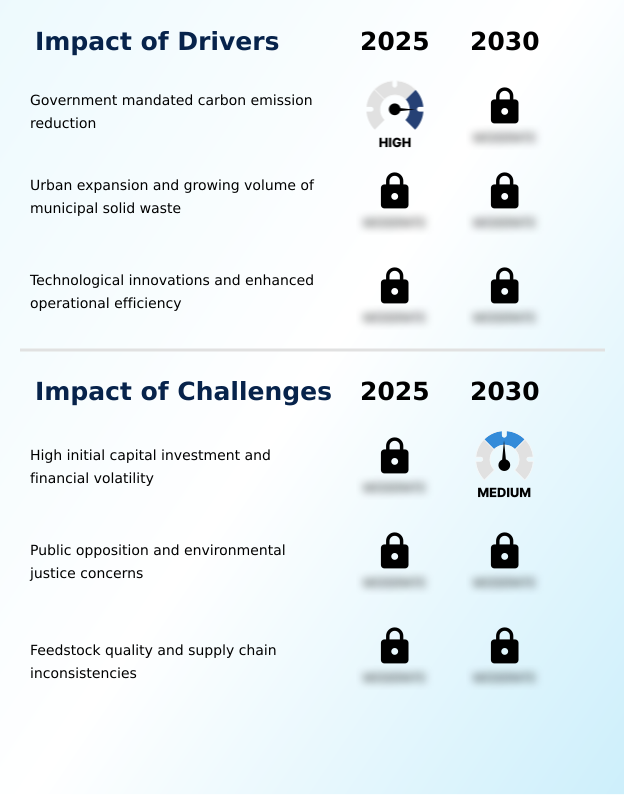
What are the key market drivers leading to the rise in the adoption of Waste To Energy Industry?
- Government-mandated carbon emission reductions are a primary driver accelerating the adoption of waste to energy solutions globally.
- Market growth is propelled by stringent environmental regulations and rapid urbanization, which together necessitate advanced thermal treatment solutions.
- Government mandates and renewable energy subsidies are creating favorable conditions for investment in integrated waste management facility projects, often structured as public-private partnership models.
- In urban centers, these facilities provide essential baseload power generation, with some processing thousands of tons of waste daily. Technological advancements, particularly in AI-driven combustion control systems, are improving energy yields by over 10%.
- Furthermore, stable power purchase agreements and supportive policies for sustainable urban infrastructure are attracting significant capital, including a recent government allocation of over $500 million in one developed nation.
- These drivers ensure a steady demand for efficient and environmentally compliant energy recovery technologies like grate combustion technology.
What are the market trends shaping the Waste To Energy Industry?
- The integration of carbon capture and storage technologies is a transformative trend, reshaping the industry’s approach to long-term sustainability and emission reduction goals.
- Key market trends are centered on enhancing sustainability and creating higher-value energy products. The adoption of carbon capture and storage integration is gaining momentum, with pilot projects demonstrating the potential to achieve a negative carbon footprint. Some facilities aim to capture over 90% of their CO2 emissions.
- Simultaneously, a strategic shift toward industrial symbiosis networks is enabling the production of green fuels, with syngas production from waste being used to create hydrogen and methanol. This diversification beyond electricity generation is supported by new project financing mechanisms. Advanced materials recovery from incineration byproducts is another critical trend, aligning with circular economy principles.
- This focus on maximizing resource utilization is reshaping the economic and environmental profile of modern energy recovery operations, turning waste streams into valuable assets for both energy and manufacturing sectors.
What challenges does the Waste To Energy Industry face during its growth?
- High initial capital investment requirements and financial volatility present a key challenge to the growth of the waste to energy industry.
- The market faces considerable challenges, primarily the high initial capital investment required for new facilities and the financial risks from waste stream variability management. Project budgets can be strained by volatile financing costs, with some projects reporting overruns of more than 10%.
- The quality of feedstock is another major hurdle, as inconsistencies can reduce energy output by up to 15% during certain periods, necessitating investment in pretreatment and refuse-derived fuel (RDF) production. Securing a social license to operate is also increasingly difficult due to public opposition, which can delay or halt projects despite adherence to strict air quality control standards.
- Volatile gate fee pricing structures and the high cost of flue gas desulfurization systems add further complexity, making asset modernization and retrofitting a more attractive option than greenfield development in some regions.
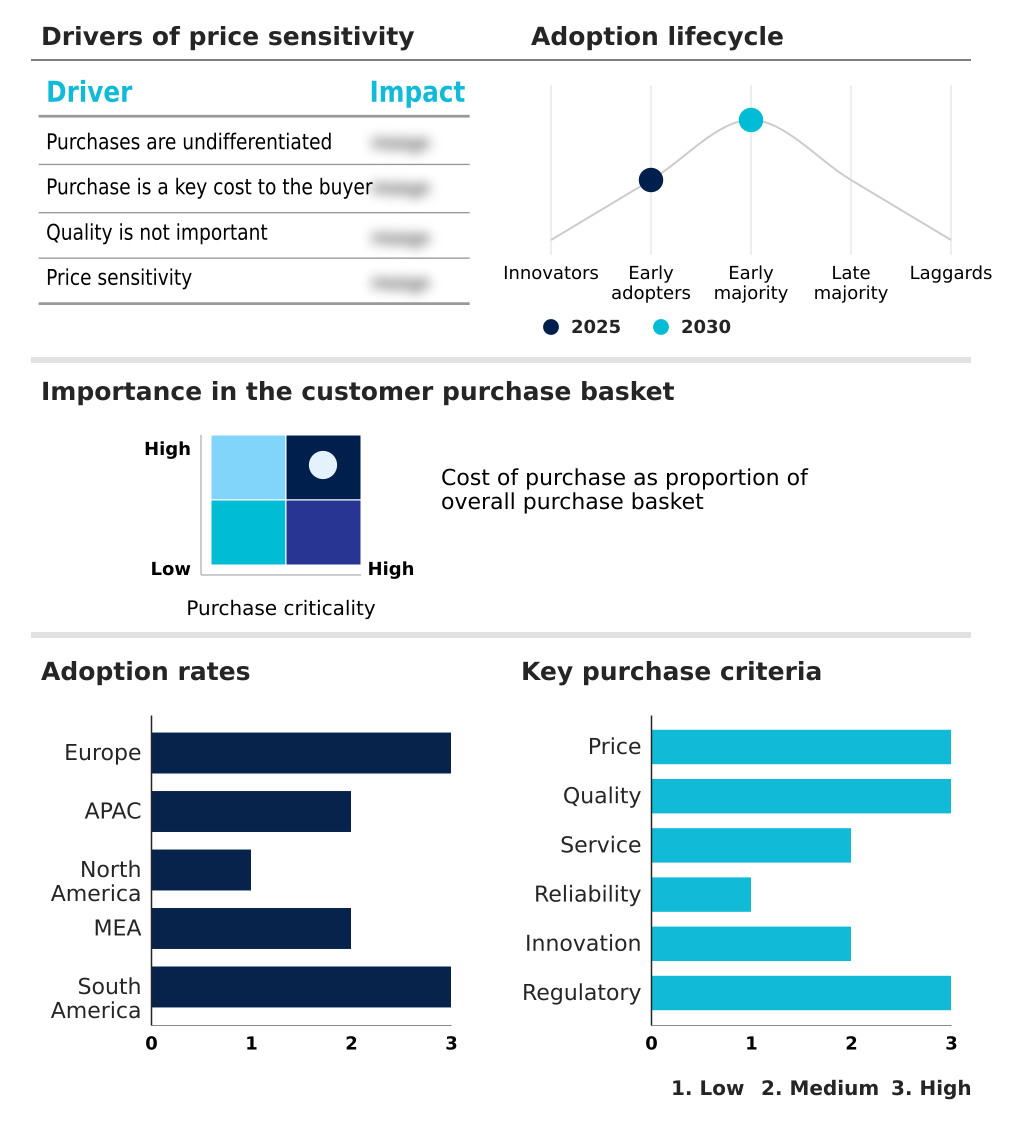
Exclusive Technavio Analysis on Customer Landscape
The waste to energy market forecasting report includes the adoption lifecycle of the market, covering from the innovator’s stage to the laggard’s stage. It focuses on adoption rates in different regions based on penetration. Furthermore, the waste to energy market report also includes key purchase criteria and drivers of price sensitivity to help companies evaluate and develop their market growth analysis strategies.
Customer Landscape of Waste To Energy Industry
Competitive Landscape
Companies are implementing various strategies, such as strategic alliances, waste to energy market forecast, partnerships, mergers and acquisitions, geographical expansion, and product/service launches, to enhance their presence in the industry.
ADQ - Supplying advanced boiler systems, fuel handling equipment, and emissions control technologies that facilitate efficient and compliant energy recovery from various municipal and industrial waste streams.
The industry research and growth report includes detailed analyses of the competitive landscape of the market and information about key companies, including:
- ADQ
- Babcock and Wilcox
- BlueFire Renewables Inc.
- China Everbright Environment
- CNIM SA
- Doosan Lentjes GmbH
- Future Biogas Ltd.
- John Wood Group PLC
- Kanadevia Corp.
- Keppel Ltd.
- MARTIN GmbH
- Meridiam SAS
- Mitsubishi Heavy Ltd.
- MVV Energie AG
- Veolia Environment SA
- Viridor Waste Ltd.
- Waste Management Inc.
- Wheelabrator Group
Qualitative and quantitative analysis of companies has been conducted to help clients understand the wider business environment as well as the strengths and weaknesses of key industry players. Data is qualitatively analyzed to categorize companies as pure play, category-focused, industry-focused, and diversified; it is quantitatively analyzed to categorize companies as dominant, leading, strong, tentative, and weak.
Recent Development and News in Waste to energy market
- In August 2024, Wood PLC was awarded a contract to design a facility integrating waste to energy with green hydrogen production in the United Kingdom.
- In January 2025, Mitsubishi Heavy Industries announced a pilot study in Japan to produce liquid methanol from the emissions of a thermal recovery unit.
- In February 2025, Mitsubishi Heavy Industries introduced a new modular plant design for rapid deployment in remote or rural areas.
- In March 2025, Fortum initiated a project to capture carbon dioxide from the flue gases of its energy recovery plant in Finland to demonstrate carbon capture feasibility.
Dive into Technavio’s robust research methodology, blending expert interviews, extensive data synthesis, and validated models for unparalleled Waste To Energy Market insights. See full methodology.
| Market Scope | |
|---|---|
| Page number | 291 |
| Base year | 2025 |
| Historic period | 2020-2024 |
| Forecast period | 2026-2030 |
| Growth momentum & CAGR | Accelerate at a CAGR of 7.6% |
| Market growth 2026-2030 | USD 33064.1 million |
| Market structure | Fragmented |
| YoY growth 2025-2026(%) | 7.1% |
| Key countries | Germany, Sweden, Denmark, France, UK, The Netherlands, China, Japan, India, South Korea, Singapore, Australia, US, Canada, Mexico, UAE, Saudi Arabia, South Africa, Egypt, Qatar, Brazil, Chile and Argentina |
| Competitive landscape | Leading Companies, Market Positioning of Companies, Competitive Strategies, and Industry Risks |
Research Analyst Overview
- The waste to energy market is fundamentally shifting from a disposal-centric model to one focused on integrated resource and energy recovery. This transition requires significant capital investment in advanced thermal treatment technologies, including grate combustion technology and sophisticated pyrolysis and gasification systems.
- Boardroom decisions increasingly center on aligning plant design with decarbonization goals, making carbon capture and storage integration a strategic priority rather than an option. The deployment of advanced boiler and turbine systems is crucial for maximizing steam cycle efficiency.
- Operational excellence is achieved through technologies like selective catalytic reduction (SCR) and automated combustion control systems, which can improve energy recovery efficiency by over 10% in modernized plants. Furthermore, the industry is creating additional value through comprehensive bottom ash processing and refuse-derived fuel (RDF) production.
- This evolution underscores the market’s move toward complex, high-efficiency facilities that function as pivotal hubs in a circular economy, converting non-recyclable waste into reliable energy while minimizing environmental impact through robust flue gas cleaning technologies.
What are the Key Data Covered in this Waste To Energy Market Research and Growth Report?
-
What is the expected growth of the Waste To Energy Market between 2026 and 2030?
-
USD 33.06 billion, at a CAGR of 7.6%
-
-
What segmentation does the market report cover?
-
The report is segmented by Technology (Thermal, and Biological), Application (Electricity, and Heat), Type (Municipal solid waste, Agricultural waste, Process waste, and Others) and Geography (Europe, APAC, North America, Middle East and Africa, South America)
-
-
Which regions are analyzed in the report?
-
Europe, APAC, North America, Middle East and Africa and South America
-
-
What are the key growth drivers and market challenges?
-
Government mandated carbon emission reduction, High initial capital investment and financial volatility
-
-
Who are the major players in the Waste To Energy Market?
-
ADQ, Babcock and Wilcox, BlueFire Renewables Inc., China Everbright Environment, CNIM SA, Doosan Lentjes GmbH, Future Biogas Ltd., John Wood Group PLC, Kanadevia Corp., Keppel Ltd., MARTIN GmbH, Meridiam SAS, Mitsubishi Heavy Ltd., MVV Energie AG, Veolia Environment SA, Viridor Waste Ltd., Waste Management Inc. and Wheelabrator Group
-
Market Research Insights
- Market dynamics are shaped by a complex interplay of forces, where the high leverage of specialized technology suppliers contrasts with the moderate power of municipal buyers bound by long-term contracts. This balance influences project costs and timelines.
- The industry's alignment with circular economy principles is critical, as facilities are increasingly judged on their landfill diversion rates, which can exceed 90% in advanced plants. Public-private partnership models are essential for mitigating financial risk, while stable gate fee pricing structures are necessary for long-term operational viability.
- The transition is evident as asset modernization and retrofitting projects deliver efficiency gains of over 10% compared to legacy systems, underscoring the focus on performance optimization over simple capacity expansion. These factors collectively steer the market toward greater integration and sustainability.
We can help! Our analysts can customize this waste to energy market research report to meet your requirements.
 RIA -
RIA - 
