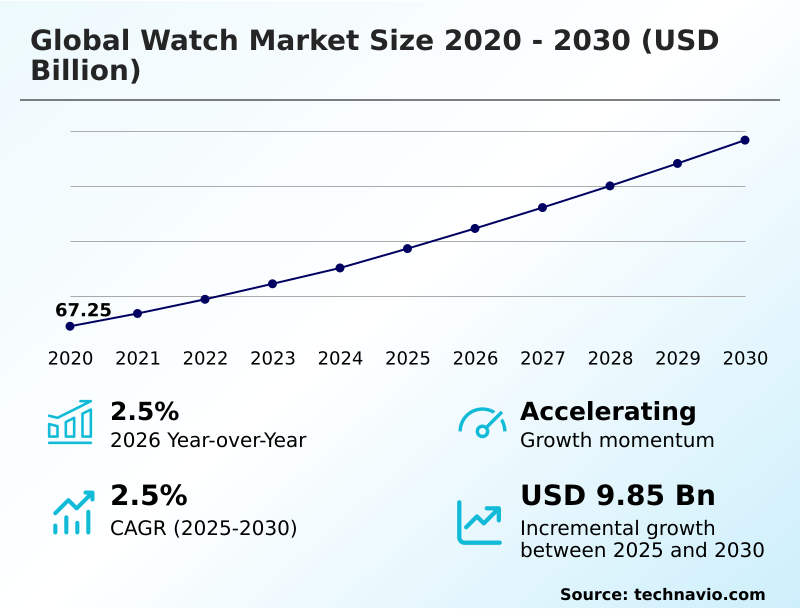
Watch Market Size 2026-2030
The watch market size is valued to increase by USD 9.85 billion, at a CAGR of 2.5% from 2025 to 2030. Rising demand for mid-range watches will drive the watch market.
Major Market Trends & Insights
- APAC dominated the market and accounted for a 51.4% growth during the forecast period.
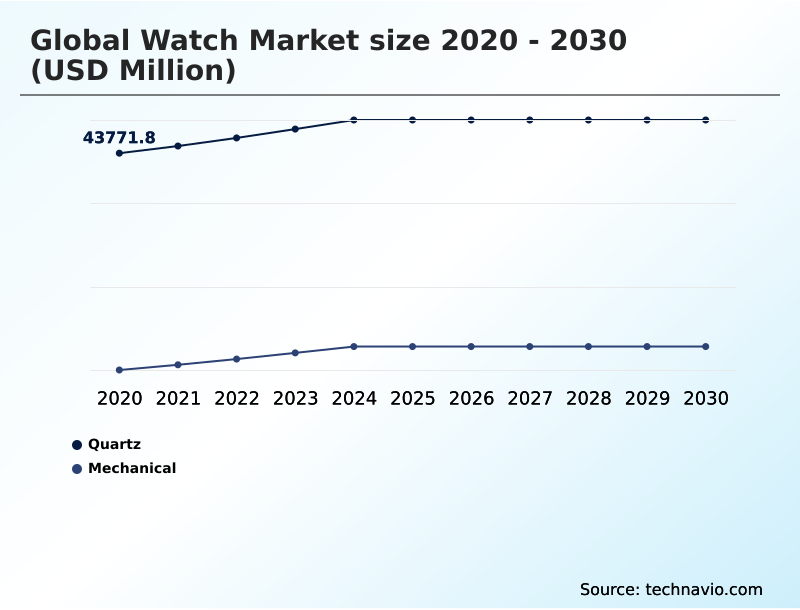
- By Product - Quartz segment was valued at USD 46.88 billion in 2024
- By Distribution Channel - Offline segment accounted for the largest market revenue share in 2024
Market Size & Forecast
- Market Opportunities: USD 16.92 billion
- Market Future Opportunities: USD 9.85 billion
- CAGR from 2025 to 2030 : 2.5%
Market Summary
- The watch market is characterized by a compelling duality, balancing the relentless technological push of smart-connected watches against the enduring appeal of traditional horological craftsmanship. Growth is driven by evolving consumer values that span from a desire for personal health monitoring to an appreciation for mechanical artistry and sustainable luxury.
- The rise of a smart-connected watch with advanced biometric sensor integration is expanding the market's utility, attracting a new demographic focused on wellness and connectivity. Concurrently, the demand for customizable and unique timepieces fuels innovation in materials and design, from specialized watch case materials to intricate dial work.
- However, the industry grapples with the persistent issue of counterfeit goods, which erodes brand value and consumer trust. In response, some firms are implementing supply chain solutions that use blockchain for authenticity, creating a verifiable digital product passport for each timepiece, thereby assuring customers of provenance and enhancing trust in both primary and secondary markets.
What will be the Size of the Watch Market during the forecast period?
Get Key Insights on Market Forecast (PDF) Get Free Sample
How is the Watch Market Segmented?
The watch industry research report provides comprehensive data (region-wise segment analysis), with forecasts and estimates in "USD million" for the period 2026-2030, as well as historical data from 2020-2024 for the following segments.
- Product
- Quartz
- Mechanical
- Distribution channel
- Offline
- Online
- Price range
- Low-range
- Luxury
- Mid-range
- Geography
- APAC
- China
- Japan
- India
- Europe
- Germany
- UK
- France
- North America
- US
- Canada
- Mexico
- Middle East and Africa
- Saudi Arabia
- UAE
- South Africa
- South America
- Brazil
- Argentina
- Colombia
- Rest of World (ROW)
- APAC
By Product Insights
The quartz segment is estimated to witness significant growth during the forecast period.
The quartz segment remains a cornerstone, valued for its accuracy and accessibility. Innovation is centered on the hybrid smartwatch, which blends analog aesthetics with smart features.
A key trend is the integration of advanced power sources, such as solar-powered movement and eco-drive technology, which appeal to eco-conscious consumers by drastically reducing battery waste.
This focus on sustainability extends to material choices, including diverse watch strap materials that align with the principles of a circular economy.
The direct-to-consumer model, often facilitated by augmented reality try-on tools, has also gained traction, with some microbrand watchmaking firms leveraging influencer marketing impact to reach niche audiences.
These strategies have boosted engagement, with online watch configurator tools leading to a 15% increase in user interaction times.
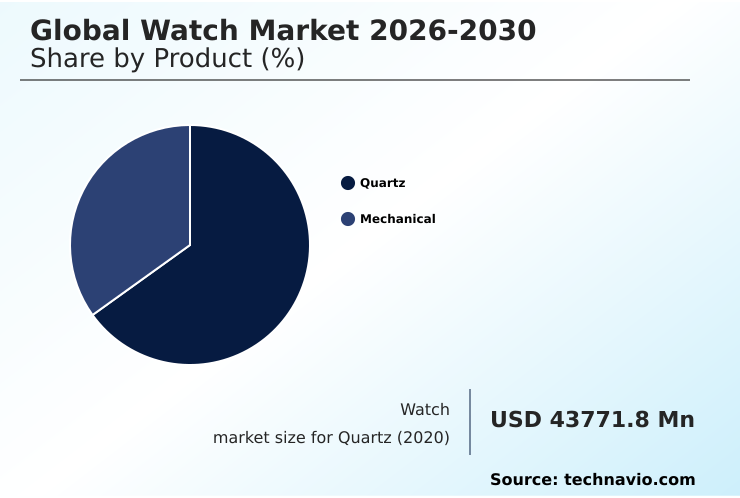
The Quartz segment was valued at USD 46.88 billion in 2024 and showed a gradual increase during the forecast period.
Regional Analysis
APAC is estimated to contribute 51.4% to the growth of the global market during the forecast period.Technavio’s analysts have elaborately explained the regional trends and drivers that shape the market during the forecast period.
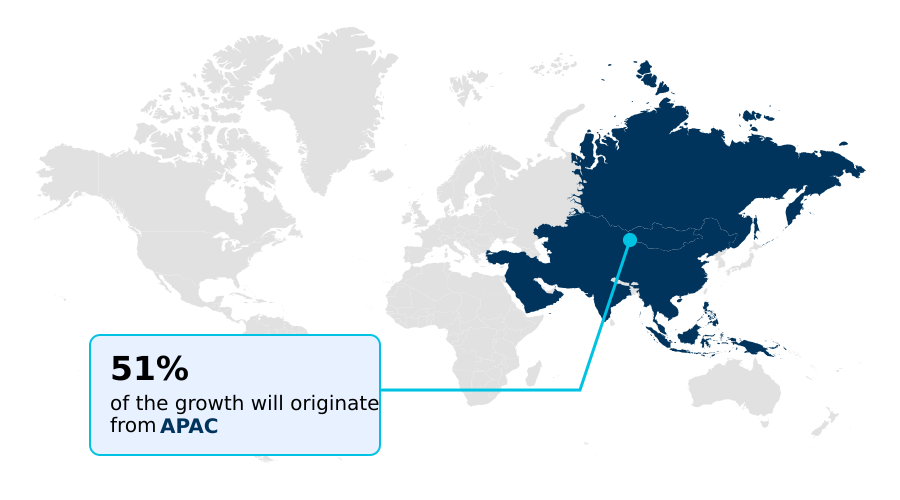
See How Watch Market Demand is Rising in APAC Get Free Sample
The geographic landscape of the watch market is diverse, with APAC emerging as a significant growth engine driven by a digitally native consumer base, while Europe remains the heartland of traditional horological craftsmanship.
In North America, a robust secondary market coexists with high demand for technologically advanced wearables. The emphasis on precision is global, with chronometer certification and the geneva seal serving as key differentiators.
Innovations such as the tourbillon escapement and perpetual calendar complication are highly sought after, often featuring advanced components like a silicon hairspring and ceramic bezel.
The adoption of a world time function and flyback chronograph features caters to a globalized consumer. In APAC, the efficient use of social commerce platforms has improved sales channel performance by over 20%.
Across Europe, manufacturers adopting digital product passports anticipate a 10% reduction in compliance-related administrative overhead.
Market Dynamics
Our researchers analyzed the data with 2025 as the base year, along with the key drivers, trends, and challenges. A holistic analysis of drivers will help companies refine their marketing strategies to gain a competitive advantage.
- The global watch market 2026-2030 is navigating a period of profound transformation, defined by the impact of smartwatches on traditional watchmaking. This has catalyzed innovation, highlighting the benefits of silicon components in mechanical watches to enhance accuracy and durability. Simultaneously, a growing consumer demand for sustainable luxury watches is compelling brands to rethink their supply chains and material sourcing.
- The future of retail for luxury watch brands is increasingly omnichannel, blending digital engagement with exclusive in-person experiences. Marketing strategies are also evolving, with the role of celebrity endorsements in watch marketing being carefully weighed against the challenges of counterfeit watches in e-commerce.
- A key development is the growth of the certified pre-owned watch market, which addresses both sustainability and accessibility. The importance of brand heritage for luxury consumers remains paramount, as it differentiates established houses from the rise of microbrands in the watch industry.
- Understanding the differences between quartz and mechanical movements is now more critical for consumers, who analyze everything from how perpetual calendars work in watches to the significance of chronometer certification for accuracy.
- For investors, the investment potential of vintage rolex watches and other iconic models continues to be a focal point, demonstrating that brands effectively communicating heritage see customer retention rates nearly double those that do not.
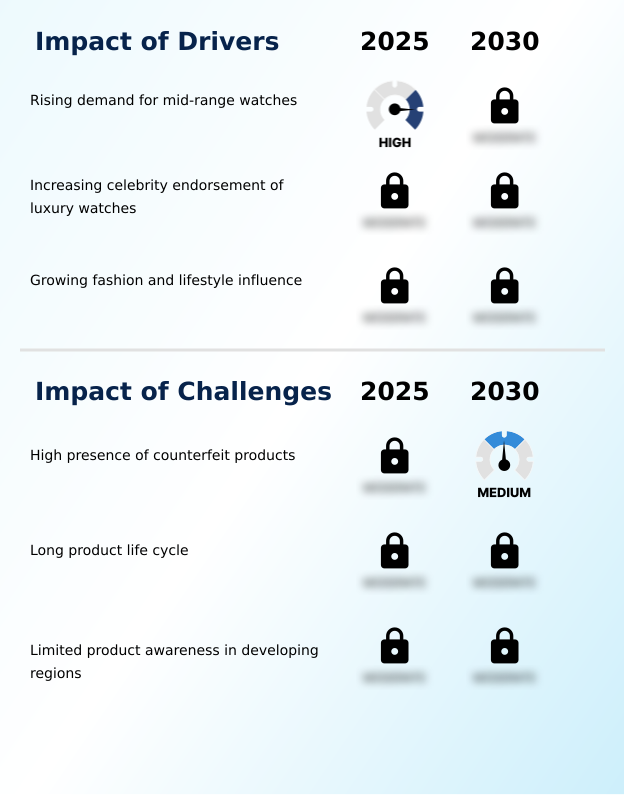
What are the key market drivers leading to the rise in the adoption of Watch Industry?
- The increasing consumer demand for mid-range watches is a key driver stimulating market growth.
- Market growth is significantly driven by the escalating demand for premium timepieces where brand heritage storytelling plays a crucial role. The allure of haute horlogerie, often validated by the prestigious swiss made label, allows brands to command higher price points.
- Consumers are increasingly drawn to the technical excellence of an automatic movement and the aesthetic detail of luminous material application using superluminova.
- This appreciation for craftsmanship has fueled a robust secondary market, with pre-owned watch certification and vintage watch restoration services becoming integral to the luxury ecosystem.
- Brands that effectively leverage a limited edition strategy see product sell-through rates increase by an average of 35% compared to standard collections.
- Furthermore, the use of high-performance watch case materials like titanium grade 5 contributes to a perception of quality that justifies premium pricing.
What are the market trends shaping the Watch Industry?
- Companies are increasingly leveraging social media and entertainment channels to foster direct engagement with consumers. This strategic shift is becoming a prominent trend within the market.
- Key market trends are redefining consumer expectations and product development. The proliferation of the smart-connected watch, powered by increasingly sophisticated watch os, has made advanced biometric sensor integration a standard feature. Innovations such as the digital crown interface enhance user experience, while integrated gps timekeeping offers standalone functionality.
- This shift towards data-driven wellness has led to a 30% improvement in health-tracking accuracy on leading platforms. Concurrently, sustainability has become a central theme, with the digital product passport emerging to promote transparency within a circular economy in horology. This initiative has seen early adopters improve their supply chain traceability by over 40%.
- The trend of sustainable watch production is further supported by the use of recycled steel usage and ethical gold sourcing, meeting growing consumer demand for responsible manufacturing.
What challenges does the Watch Industry face during its growth?
- The high prevalence of counterfeit products presents a key challenge to the industry's growth trajectory.
- The market faces persistent challenges that impact growth and brand integrity. The long product lifecycle of a well-made mechanical movement creates significant headwinds for sales volume, as replacement cycles can exceed a decade. Durability benchmarks, such as a high water resistance rating compliant with the ISO 6425 divers' watch standard, reinforce this longevity.
- This durability, while a mark of quality, contributes to a competitive secondary market that can cannibalize new sales. Moreover, operational complexities arise from sourcing specialized precious metal alloys and ensuring components have sufficient anti-magnetic properties. The intricate craftsmanship required for a guilloché dial or the minute repeater function demands highly skilled labor, creating production bottlenecks.
- Firms investing in advanced anti-counterfeit measures have managed to reduce unauthorized online listings by up to 20%, yet the issue remains a significant drain on resources.
Exclusive Technavio Analysis on Customer Landscape
The watch market forecasting report includes the adoption lifecycle of the market, covering from the innovator’s stage to the laggard’s stage. It focuses on adoption rates in different regions based on penetration. Furthermore, the watch market report also includes key purchase criteria and drivers of price sensitivity to help companies evaluate and develop their market growth analysis strategies.
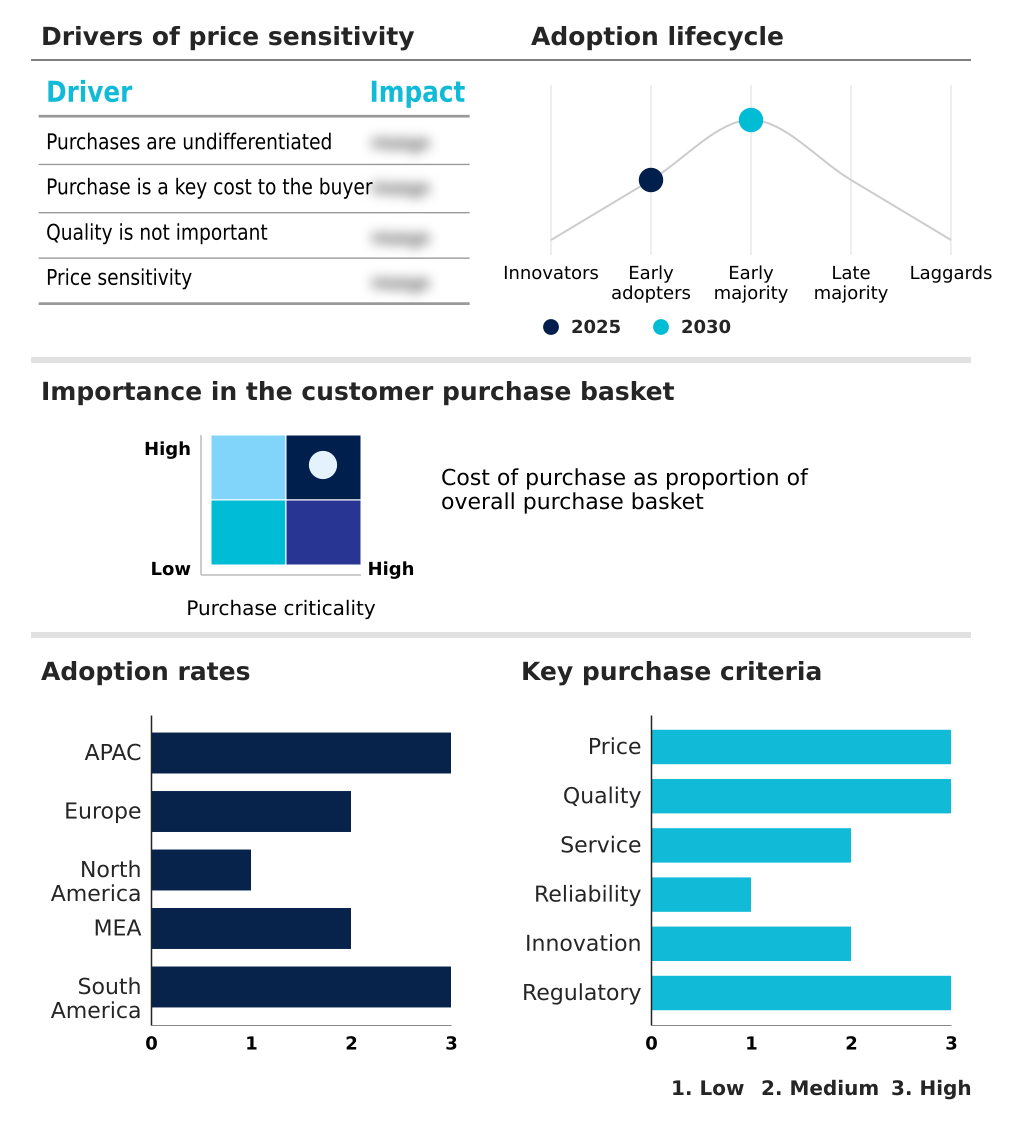
Customer Landscape of Watch Industry
Competitive Landscape
Companies are implementing various strategies, such as strategic alliances, watch market forecast, partnerships, mergers and acquisitions, geographical expansion, and product/service launches, to enhance their presence in the industry.
Apple Inc. - The company's offerings focus on integrating advanced wearable technology with health monitoring functionalities, positioning its products as comprehensive personal wellness devices in the consumer electronics space.
The industry research and growth report includes detailed analyses of the competitive landscape of the market and information about key companies, including:
- Apple Inc.
- Audemars Piguet SA
- Breitling SA
- CASIO Computer Co. Ltd.
- Citizen Watch Co. Ltd.
- Compagnie Financiere Richemont
- Daniel Wellington AB
- Fossil Group Inc.
- Garmin Ltd.
- LVMH Moet Hennessy
- Patek Philippe SA
- Rolex SA
- Samsung Electronics Co. Ltd.
- Seiko Holdings Corp.
- The Swatch Group Ltd.
- Titan Co. Ltd.
- Xiaomi Corp.
Qualitative and quantitative analysis of companies has been conducted to help clients understand the wider business environment as well as the strengths and weaknesses of key industry players. Data is qualitatively analyzed to categorize companies as pure play, category-focused, industry-focused, and diversified; it is quantitatively analyzed to categorize companies as dominant, leading, strong, tentative, and weak.
Recent Development and News in Watch market
- In January 2025, Fossil Group Inc. announced its strategic withdrawal from the smartwatch market to concentrate resources on its core traditional watch, jewelry, and leather goods segments.
- In March 2025, A. Lange & Sohne, under Compagnie Financiere Richemont, introduced the Calibre L021.150, a new automatic movement setting a new benchmark with a 150-hour power reserve.
- In May 2025, The Swatch Group Ltd. expanded its sustainability initiatives by launching a mass-market collection under its Swatch brand using its 'Bioreloaded' materials, reinforcing its commitment to the circular economy.
- In July 2025, Compagnie Financiere Richemont expanded its certified pre-owned program, integrating its entire portfolio of watch brands to standardize authenticity and service across its secondary market offerings.
Dive into Technavio’s robust research methodology, blending expert interviews, extensive data synthesis, and validated models for unparalleled Watch Market insights. See full methodology.
| Market Scope | |
|---|---|
| Page number | 290 |
| Base year | 2025 |
| Historic period | 2020-2024 |
| Forecast period | 2026-2030 |
| Growth momentum & CAGR | Accelerate at a CAGR of 2.5% |
| Market growth 2026-2030 | USD 9854.0 million |
| Market structure | Fragmented |
| YoY growth 2025-2026(%) | 2.5% |
| Key countries | China, Japan, India, South Korea, Australia, Indonesia, Germany, UK, France, Italy, The Netherlands, Spain, US, Canada, Mexico, Saudi Arabia, UAE, South Africa, Israel, Turkey, Brazil, Argentina and Colombia |
| Competitive landscape | Leading Companies, Market Positioning of Companies, Competitive Strategies, and Industry Risks |
Research Analyst Overview
- The watch market is advancing on dual fronts, where traditional artisanship and digital innovation converge. In the realm of mechanical movement, firms are refining complex features like the tourbillon escapement and perpetual calendar complication, supported by material science breakthroughs such as the silicon hairspring, ceramic bezel, and sapphire crystal.
- These high-end pieces often showcase exquisite movement finishing techniques, including côtes de genève and perlage, alongside detailed guilloché dial and enamel dial finishing. Simultaneously, the smart-connected watch segment is evolving with features like the digital crown interface, advanced biometric sensor integration, and sophisticated watch os platforms.
- Power sources are also diversifying, with solar-powered movement and eco-drive technology gaining prominence as part of a broader push toward a circular economy in horology, underscored by the digital product passport initiative. The focus on durability is evident in the widespread use of stainless steel 316l and the high water resistance rating of many models.
- Firms that have achieved chronometer certification report a 25% higher consumer trust rating in brand surveys, directly influencing purchasing decisions at the premium tier.
What are the Key Data Covered in this Watch Market Research and Growth Report?
-
What is the expected growth of the Watch Market between 2026 and 2030?
-
USD 9.85 billion, at a CAGR of 2.5%
-
-
What segmentation does the market report cover?
-
The report is segmented by Product (Quartz, and Mechanical), Distribution Channel (Offline, and Online), Price Range (Low-range, Luxury, and Mid-range) and Geography (APAC, Europe, North America, Middle East and Africa, South America)
-
-
Which regions are analyzed in the report?
-
APAC, Europe, North America, Middle East and Africa and South America
-
-
What are the key growth drivers and market challenges?
-
Rising demand for mid-range watches, High presence of counterfeit products
-
-
Who are the major players in the Watch Market?
-
Apple Inc., Audemars Piguet SA, Breitling SA, CASIO Computer Co. Ltd., Citizen Watch Co. Ltd., Compagnie Financiere Richemont, Daniel Wellington AB, Fossil Group Inc., Garmin Ltd., LVMH Moet Hennessy, Patek Philippe SA, Rolex SA, Samsung Electronics Co. Ltd., Seiko Holdings Corp., The Swatch Group Ltd., Titan Co. Ltd. and Xiaomi Corp.
-
Market Research Insights
- Market dynamics are shaped by a confluence of technological innovation and a renewed appreciation for horological craftsmanship. The value of haute horlogerie is reinforced by benchmarks like the swiss made label and cosc certification, which assure consumers of quality and precision. As the secondary market matures, pre-owned watch certification services are becoming crucial for validating assets.
- This has led to the adoption of advanced watch authentication technology to protect brand integrity. In a strategic response, leading brands are leveraging digital tools; for instance, the implementation of an online watch configurator has been shown to increase direct-to-consumer conversion rates by over 15%.
- Furthermore, firms utilizing blockchain for authenticity report a significant reduction in counterfeit-related support inquiries, improving operational efficiency by as much as 30%. These shifts highlight a market that is actively integrating digital solutions to enhance and protect traditional value propositions.
We can help! Our analysts can customize this watch market research report to meet your requirements.
 RIA -
RIA - 
