Water Coolers Market Analysis, Size, and Forecast 2026-2030: Europe (France, UK, and Germany), North America (US, Canada, and Mexico), APAC (China, Japan, and India), Middle East and Africa (Saudi Arabia, UAE, and South Africa), South America (Brazil, Argentina, and Chile), and Rest of World (ROW)

Water Coolers Market Analysis, Size, and Forecast 2026-2030:
Europe (France, UK, and Germany), North America (US, Canada, and Mexico), APAC (China, Japan, and India), Middle East and Africa (Saudi Arabia, UAE, and South Africa), South America (Brazil, Argentina, and Chile), and Rest of World (ROW)

Published: May 2026 290 Pages SKU: IRTNTR43488

Market Overview at a Glance

$787 Mn
Market Opportunity
6.3%
CAGR 2025 - 2030
34.1%
Europe Growth
$1.29 B
Bottled water coolers segment 2024

Water Coolers Market Size and Growth Forecast 2026-2030

The Water Coolers Market size was valued at USD 2.22 billion in 2025 growing at a CAGR of 6.3% during the forecast period 2026-2030.

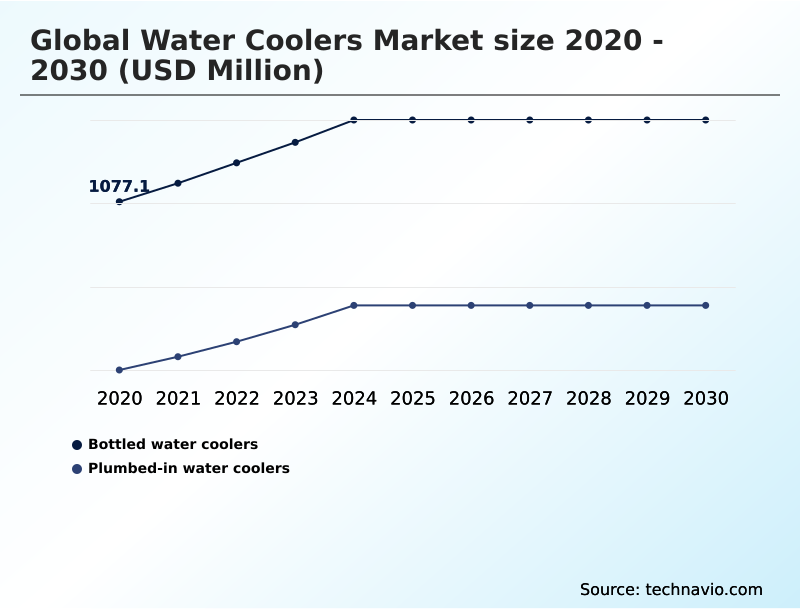
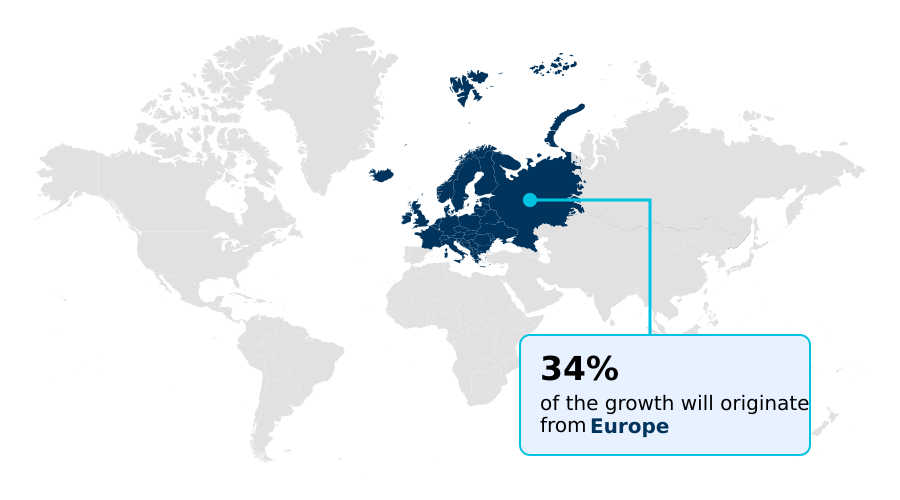
Europe accounts for 34.1% of incremental growth during the forecast period. The Bottled water coolers segment by Product was valued at USD 1.29 billion in 2024, while the Commercial segment holds the largest revenue share by Application.

The market is projected to grow by USD 1.30 billion from 2020 to 2030, with USD 787 million of the growth expected during the forecast period of 2025 to 2030.

Get Key Insights on Market Forecast (PDF) Request Free Sample

Water Coolers Market Overview

The water coolers market is evolving beyond simple hydration, driven by demands for sustainability and advanced water treatment. Corporate wellness programs now routinely specify high-performance integrated purification systems as a standard workplace amenity. A key driver is the transition toward point-of-use systems that eliminate plastic waste. For instance, a large corporate campus in Europe, aligning with EU Green Deal objectives, replaced its fleet of bottled dispensers with a network of plumbed-in systems. These IoT-enabled dispensers feature multi-stage filtration, including reverse osmosis filtration and UV sanitization, providing real-time data analytics on consumption and quality back to the central building management systems. This strategic shift not only reduced the facility's carbon footprint but also lowered operational expenditures associated with water delivery and storage. This move toward intelligent, networked public hydration infrastructure is indicative of the broader market direction, where connectivity and purification performance are paramount. The market is projected to grow by USD 787.0 million between 2025 and 2030.

Drivers, Trends, and Challenges in the Water Coolers Market

Strategic decision-making in the water coolers market hinges on a complex interplay of upfront capital versus long-term operational expenditures, particularly evident in the point-of-use vs bottled water cooler TCO analysis.

A facility manager for a large hospital, for instance, must evaluate the high initial investment for a network of plumbed-in systems against the recurring costs and logistical burdens of a bottled water service. The adoption of IoT integration for remote water cooler management allows for predictive maintenance and filter replacement scheduling, significantly improving operational efficiency and hygiene.

Furthermore, the challenge of advanced filtration for emerging water contaminants like PFAS necessitates investment in systems with nanotechnology filtration or reverse osmosis, moving beyond standard carbon block filters. This is compounded by the need to comply with evolving energy efficiency standards for commercial appliances, such as those outlined in Australia's GEMS program.

The use of sustainable materials in water cooler manufacturing is also becoming a key vendor qualification criterion, especially for corporations with ESG mandates. Finally, navigating regulatory compliance for direct potable reuse systems, as seen with Arizona's Aquifer Protection Permit rule, requires dispensers with robust, multi-stage purification capabilities to ensure safety at the tap.

This landscape shows a market where technological sophistication and regulatory adherence are inextricably linked.

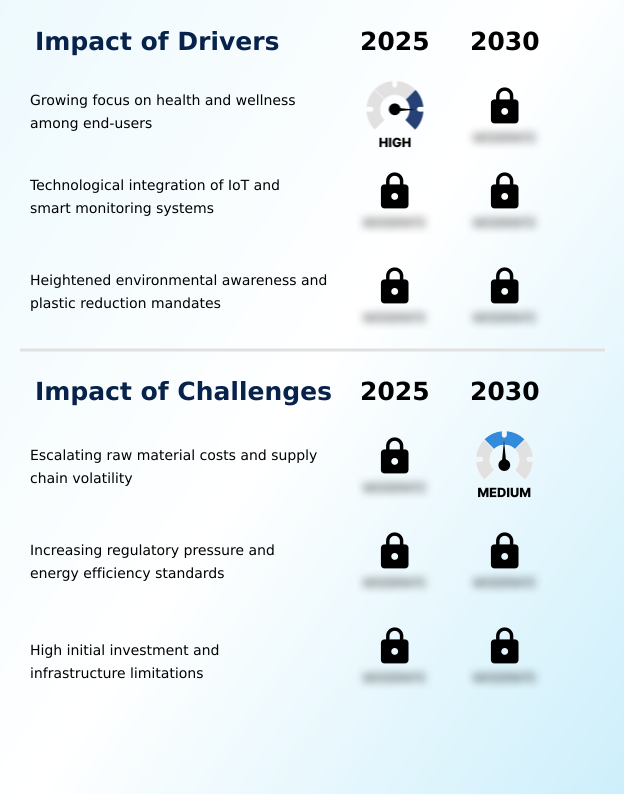
Primary Growth Driver: A growing focus on health and wellness among end-users is a key driver for the market.

The market's growth is fundamentally driven by a global focus on sustainability and health.

The urgent need for single-use plastic reduction is accelerating the transition from bottled delivery models to permanent public hydration infrastructure, particularly bottleless water coolers and point-of-use systems.

This shift is reinforced by corporate sustainability initiatives, where the carbon footprint of water logistics is under intense scrutiny. Consequently, businesses are prioritizing plumbed-in systems that offer advanced water treatment on-site.

The growing emphasis on workplace wellness initiatives further fuels this trend, with employers investing in high-quality hydration to support employee health and productivity.

The integration of IoT technology in these systems enhances operational efficiency, providing data that supports both sustainability reporting and maintenance scheduling, making it a cornerstone of modern corporate wellness programs.

Emerging Market Trend: The expansion of premium, multi-functional, and high-capacity dispensing systems defines a primary market trend.

Key trends are reshaping product design, moving beyond basic chilling to encompass integrated wellness and sustainability features. The market is seeing a diversification toward multi-functional dispensing, with high-end commercial units now offering sparkling water dispensers and ambient options alongside traditional hot and cold. This premiumization aligns with corporate wellness programs aimed at enhancing the workplace environment.

Technologically, the adoption of smart sensing capabilities is enabling features like touchless dispensing, which has become a standard for hygienic hydration solutions. Furthermore, advancements in nanotechnology filtration are addressing growing concerns over water purity, with systems now capable of advanced PFAS removal at the point of use.

This shift toward more sophisticated, integrated purification systems is a direct response to consumer and commercial demand for higher safety standards and enhanced user experience.

Key Industry Challenge: Escalating raw material costs and supply chain volatility present a key challenge to industry growth.

The primary challenges facing the market are rooted in supply chain economics and intensifying regulatory pressures. Persistent supply chain volatility has led to escalating costs for critical raw materials like metals and polymers, directly impacting profit margins for manufacturers of both commercial and residential water coolers.

This forces a difficult choice between absorbing costs or raising prices, which can dampen demand. Simultaneously, governments are imposing stricter energy efficiency standards, such as Australia's GEMS Determination 2025, and environmental mandates.

While these regulations promote sustainability, they require significant R&D investment and can increase the total cost of ownership for end-users, creating a barrier to adoption, particularly for advanced point-of-use water purification systems that already carry a high initial investment.

Explore Full Market Dynamics Analysis Request Free Sample

Water Coolers Market Segmentation

The water coolers industry research report provides comprehensive data including region-wise segment analysis, with forecasts and analysis for the period 2026-2030, as well as historical data from 2020-2024 for the following segments.

Market Segment by Product
  • Bottled water coolers
  • Plumbed-in water coolers
Market Segment by Application
  • Commercial
  • Residential
Market Segment by Distribution channel
  • Offline
  • Online
Market Segment by Geography
Europe
France, UK, Germany, Italy, Spain, The Netherlands
North America
US, Canada, Mexico
APAC
China, Japan, India, South Korea, Australia, Indonesia
Middle East and Africa
Saudi Arabia, UAE, South Africa, Israel, Turkey
South America
Brazil, Argentina, Chile

Product Segment Analysis

The bottled water coolers segment is estimated to witness significant growth during the forecast period.

The global water coolers market is segmented by product, application, distribution channel, and geography.

The bottled water coolers segment continues to hold a significant market position, accounting for over 60% of the market in 2024, favored for its minimal setup requirements and flexibility in environments without direct plumbing access.

These systems, including modern bottom-loading water coolers, provide essential hygienic hydration solutions.

However, a notable shift is occurring toward point-of-use systems as procurement decision-makers conduct total cost of ownership analyses that favor the long-term economic and environmental benefits of bottleless alternatives.

This dynamic is most pronounced in the commercial sector, which dominates market demand, while the residential segment shows increasing adoption of more compact countertop water coolers.

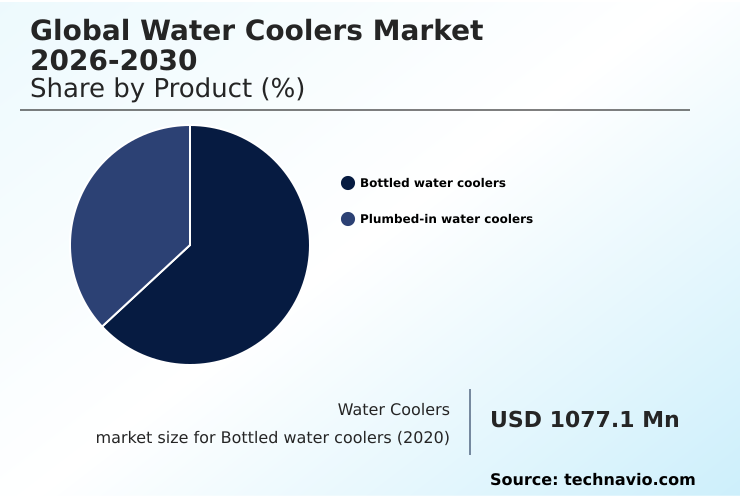
The Bottled water coolers segment was valued at USD 1.29 billion in 2024 and showed a gradual increase during the forecast period.

Water Coolers Market by Region: Europe Leads with 34.1% Growth Share

Europe is estimated to contribute 34.1% to the growth of the global market during the forecast period.

The geographic landscape of the water coolers market is diverse, with APAC poised to contribute the highest growth, driven by rapid urbanization and increasing health awareness in countries like India and China.

Europe is expected to contribute 34% of the market's growth, where stringent regulations such as the European Green Deal and a focus on single-use plastic reduction are accelerating the adoption of sustainable hydration solutions and plumbed-in systems.

In North America, which accounts for a significant market share, there is a strong trend toward residential water coolers and home water purification, driven by concerns over municipal water quality and an emphasis on wellness.

In Australia, the GEMS program's Commercial Ice-makers Determination 2025 reflects a broader regional push for energy-efficient appliances, influencing the design of high-capacity cooling units and other commercial water coolers.

Customer Landscape Analysis for the Water Coolers Market

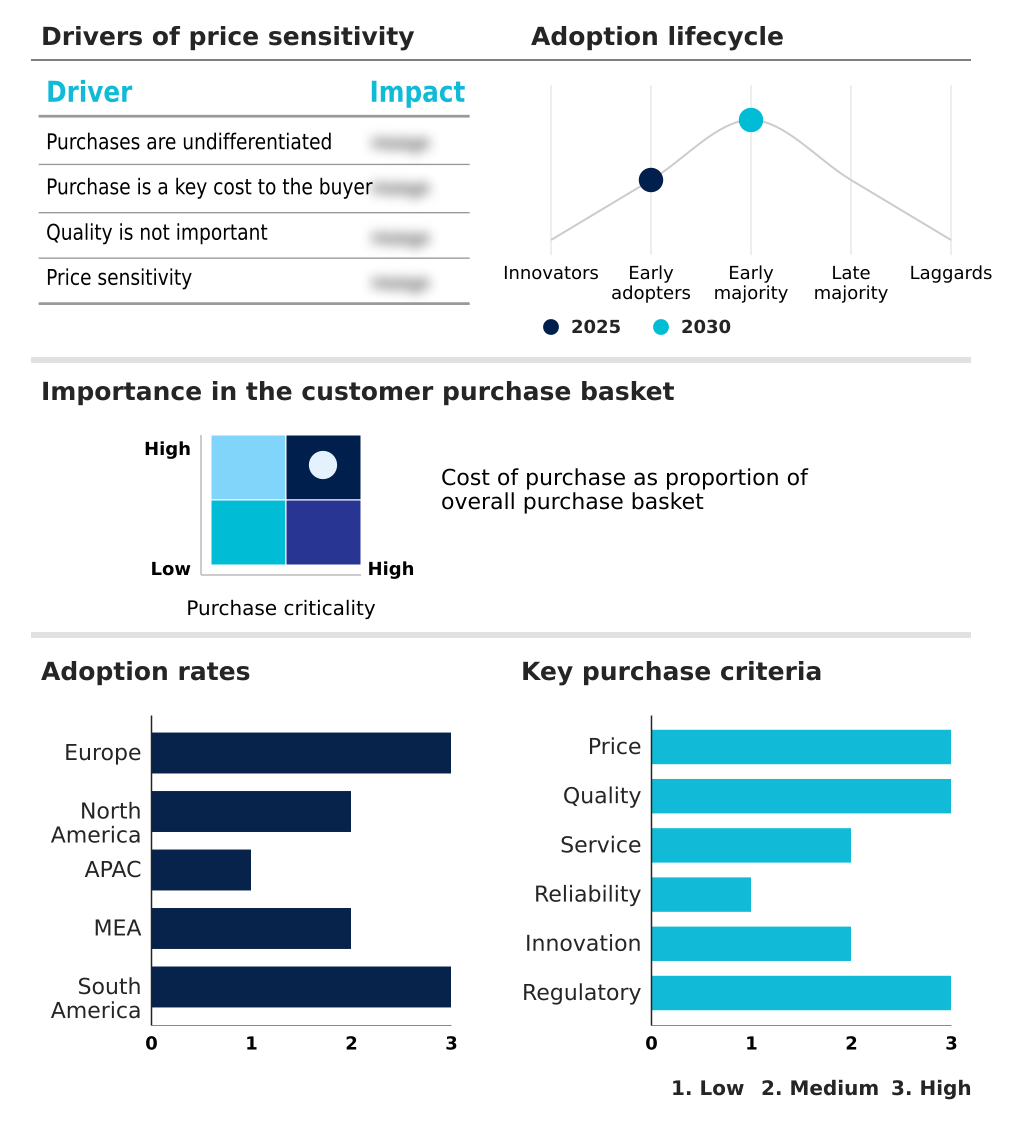
The water coolers market forecasting report includes the adoption lifecycle of the market, covering from the innovator’s stage to the laggard’s stage. It focuses on adoption rates in different regions based on penetration. Furthermore, the water coolers market report also includes key purchase criteria and drivers of price sensitivity to help companies evaluate and develop their market growth analysis strategies.

Competitive Landscape of the Water Coolers Market

Companies are implementing various strategies, such as strategic alliances, partnerships, mergers and acquisitions, geographical expansion, and product/service launches, to enhance their presence in the water coolers market industry.

AB Electrolux - An established portfolio of water coolers includes tabletop and floor-standing models, addressing diverse commercial and residential appliance needs.

The industry research and growth report includes detailed analyses of the competitive landscape of the market and information about key companies, including:

  • AB Electrolux
  • Blue Star Ltd.
  • Breville Group Ltd.
  • Carrier Global Corp.
  • Clover Co. Ltd
  • Culligan International Co.
  • Elkay Manufacturing Co.
  • Haier Smart Home Co. Ltd.
  • Honeywell International Inc.
  • JNOD Group
  • KENT RO Systems Ltd.
  • LAMO Electrical Appliance Group
  • Midea Group Co. Ltd.
  • OASIS International
  • Olansi Healthcare Co. Ltd.
  • Pure Water Systems Inc.
  • Sunrise Aquacooler
  • Voltas Ltd.
  • Waterlogic Holdings Ltd.
  • Whirlpool Corp.

Qualitative and quantitative analysis of companies has been conducted to help clients understand the wider business environment as well as the strengths and weaknesses of key industry players. Data is qualitatively analyzed to categorize companies as pure play, category-focused, industry-focused, and diversified; it is quantitatively analyzed to categorize companies as dominant, leading, strong, tentative, and weak.

Recent Developments in the Water Coolers Market

  • In February, 2025, Blue Star Ltd. introduced a specialized range of water coolers in India that employ R290 refrigerant, a move designed to reduce the global warming potential of its cooling systems in line with international environmental standards.
  • In March, 2025, Primo Water Corp. entered into a strategic technical alliance with Siemens to incorporate advanced sensor arrays and IoT capabilities into its high-capacity water dispensing units for corporate clients.
  • In March, 2025, Culligan Quench, a subsidiary of Culligan International Co., expanded its North American service capabilities by acquiring Stonybrook Water Co., a Massachusetts-based supplier of point-of-use water and ice appliances for the commercial sector.
  • In March, 2025, the Arizona Department of Environmental Quality finalized its Aquifer Protection Permit rule, a regulatory change that facilitates direct potable reuse of treated water and is expected to drive demand for advanced end-user purification systems from companies like Pure Water Systems Inc.

Research Analyst Overview: Water Coolers Market

From an analyst perspective, the water coolers market is at an inflection point where total cost of ownership and ESG compliance are steering capital investment. Boardroom decisions increasingly favor point-of-use systems, despite higher upfront costs, due to their alignment with corporate sustainability goals and the elimination of recurring bottled water contracts.

This is not merely a cost-saving measure but a strategic response to regulatory pressures like the EU's F-gas regulations, which mandate a shift toward eco-friendly refrigerants and energy-efficient compressors. The integration of BLDC motors and advanced power-saving modes is becoming standard.

For instance, a multinational corporation evaluating a refresh of its global office infrastructure must now weigh the operational benefits of IoT-enabled dispensers—offering remote maintenance monitoring and consumption data—against the complexities of a multi-regional rollout.

The market's growth, with Europe contributing over 34% of the forecast period's expansion, is directly tied to this convergence of technological readiness and regulatory imperative, making advanced water treatment and sustainable hydration solutions central to modern facility management.

Dive into Technavio’s robust research methodology, blending expert interviews, extensive data synthesis, and validated models for unparalleled Water Coolers Market insights. See full methodology.

Request Free Sample

Market Scope
Page number 290
Base year 2025
Historic period 2020-2024
Forecast period 2026-2030
Growth momentum & CAGR Accelerate at a CAGR of 6.3%
Market growth 2026-2030 USD 787.0 million
Market structure Fragmented
YoY growth 2025-2026(%) 6.0%
Key countries France, UK, Germany, Italy, Spain, The Netherlands, US, Canada, Mexico, China, Japan, India, South Korea, Australia, Indonesia, Saudi Arabia, UAE, South Africa, Israel, Turkey, Brazil, Argentina and Chile
Competitive landscape Leading Companies, Market Positioning of Companies, Competitive Strategies, and Industry Risks

Water Coolers Market: Key Questions Answered in This Report

  • What is the expected growth of the Water Coolers Market between 2026 and 2030?

    • The Water Coolers Market is expected to grow by USD 787 million during 2026-2030, registering a CAGR of 6.3%. Year-over-year growth in 2026 is estimated at 6.0%%. This acceleration is shaped by growing focus on health and wellness among end-users, which is intensifying demand across multiple end-use verticals covered in the report.

  • What segmentation does the market report cover?

    • The report is segmented by Product (Bottled water coolers, and Plumbed-in water coolers), Application (Commercial, and Residential), Distribution Channel (Offline, and Online) and Geography (Europe, North America, APAC, Middle East and Africa, South America). Among these, the Bottled water coolers segment is estimated to witness significant growth during the forecast period, driven by rising adoption across key application areas. Each segment includes detailed qualitative and quantitative analysis, along with historical data from 2020-2024 and forecasts through 2030 with year-over-year growth rates.

  • Which regions are analyzed in the report?

    • The report covers Europe, North America, APAC, Middle East and Africa and South America. Europe is estimated to contribute 34.1% to market growth during the forecast period. Country-level analysis includes France, UK, Germany, Italy, Spain, The Netherlands, US, Canada, Mexico, China, Japan, India, South Korea, Australia, Indonesia, Saudi Arabia, UAE, South Africa, Israel, Turkey, Brazil, Argentina and Chile, with dedicated market size tables and year-over-year growth for each.

  • What are the key growth drivers and market challenges?

    • The primary driver is growing focus on health and wellness among end-users, which is accelerating investment and industry demand. The main challenge is escalating raw material costs and supply chain volatility, creating operational barriers for key market participants. The report quantifies the impact of each driver and challenge across 2026 and 2030 with comparative analysis.

  • Who are the major players in the Water Coolers Market?

    • Key vendors include AB Electrolux, Blue Star Ltd., Breville Group Ltd., Carrier Global Corp., Clover Co. Ltd, Culligan International Co., Elkay Manufacturing Co., Haier Smart Home Co. Ltd., Honeywell International Inc., JNOD Group, KENT RO Systems Ltd., LAMO Electrical Appliance Group, Midea Group Co. Ltd., OASIS International, Olansi Healthcare Co. Ltd., Pure Water Systems Inc., Sunrise Aquacooler, Voltas Ltd., Waterlogic Holdings Ltd. and Whirlpool Corp.. The report provides qualitative and quantitative analysis categorizing companies as dominant, leading, strong, tentative, and weak based on their market positioning. Company profiles include business segment analysis, SWOT assessment, key offerings, and recent strategic developments.

Water Coolers Market Research Insights

Market dynamics are increasingly shaped by technological integration and heightened hygiene standards. The demand for sensor-based dispensing and touchless water coolers has become a core expectation in commercial settings, reducing physical contact points and supporting public health objectives. This shift is compelling manufacturers to integrate advanced smart sensing capabilities for both user interaction and internal diagnostics.

Concurrently, the ability to ensure water purity at the final point of delivery is critical. Systems now incorporate sophisticated water quality monitoring tools that provide assurance to end-users, a key factor in both commercial and residential water coolers.

These intelligent systems are often designed to integrate with building management systems, allowing facility managers to oversee performance and maintenance schedules efficiently across an entire fleet of assets, thereby improving operational efficiency.

We can help! Our analysts can customize this water coolers market research report to meet your requirements.

Get in touch

1. Executive Summary

1.1 Market overview

Executive Summary - Chart on Market Overview
Executive Summary - Data Table on Market Overview
Executive Summary - Chart on Global Market Characteristics
Executive Summary - Chart on Market by Geography
Executive Summary - Chart on Market Segmentation by Product
Executive Summary - Chart on Market Segmentation by Application
Executive Summary - Chart on Market Segmentation by Distribution Channel
Executive Summary - Chart on Incremental Growth
Executive Summary - Data Table on Incremental Growth
Executive Summary - Chart on Company Market Positioning

2. Technavio Analysis

2.1 Analysis of price sensitivity, lifecycle, customer purchase basket, adoption rates, and purchase criteria

2.2 Criticality of inputs and Factors of differentiation

Chart on Overview on criticality of inputs and factors of differentiation

2.3 Factors of disruption

Chart on Overview on factors of disruption

2.4 Impact of drivers and challenges

Chart on Impact of drivers and challenges in 2025 and 2030

3. Market Landscape

3.1 Market ecosystem

Chart on Parent Market
Data Table on - Parent Market

3.2 Market characteristics

Chart on Market characteristics analysis

3.3 Value chain analysis

Chart on Value chain analysis

4. Market Sizing

4.1 Market definition

Data Table on Offerings of companies included in the market definition

4.2 Market segment analysis

Market segments

4.3 Market size 2025

4.4 Market outlook: Forecast for 2025-2030

Chart on Global - Market size and forecast 2025-2030 ($ million)
Data Table on Global - Market size and forecast 2025-2030 ($ million)
Chart on Global Market: Year-over-year growth 2025-2030 (%)
Data Table on Global Market: Year-over-year growth 2025-2030 (%)

5. Historic Market Size

5.1 Global Water Coolers Market 2020 - 2024

Historic Market Size - Data Table on Global Water Coolers Market 2020 - 2024 ($ million)

5.2 Product segment analysis 2020 - 2024

Historic Market Size - Product Segment 2020 - 2024 ($ million)

5.3 Application segment analysis 2020 - 2024

Historic Market Size - Application Segment 2020 - 2024 ($ million)

5.4 Distribution Channel segment analysis 2020 - 2024

Historic Market Size - Distribution Channel Segment 2020 - 2024 ($ million)

5.5 Geography segment analysis 2020 - 2024

Historic Market Size - Geography Segment 2020 - 2024 ($ million)

5.6 Country segment analysis 2020 - 2024

Historic Market Size - Country Segment 2020 - 2024 ($ million)

6. Qualitative Analysis

6.1 Impact of AI on Global Water Coolers Market

6.2 Impact of Geopolitical Conflict Global Water Coolers Market

7. Five Forces Analysis

7.1 Five forces summary

Five forces analysis - Comparison between 2025 and 2030

7.2 Bargaining power of buyers

Bargaining power of buyers - Impact of key factors 2025 and 2030

7.3 Bargaining power of suppliers

Bargaining power of suppliers - Impact of key factors in 2025 and 2030

7.4 Threat of new entrants

Threat of new entrants - Impact of key factors in 2025 and 2030

7.5 Threat of substitutes

Threat of substitutes - Impact of key factors in 2025 and 2030

7.6 Threat of rivalry

Threat of rivalry - Impact of key factors in 2025 and 2030

7.7 Market condition

Chart on Market condition - Five forces 2025 and 2030

8. Market Segmentation by Product

8.1 Market segments

Chart on Product - Market share 2025-2030 (%)
Data Table on Product - Market share 2025-2030 (%)

8.2 Comparison by Product

Chart on Comparison by Product
Data Table on Comparison by Product

8.3 Bottled water coolers - Market size and forecast 2025-2030

Chart on Bottled water coolers - Market size and forecast 2025-2030 ($ million)
Data Table on Bottled water coolers - Market size and forecast 2025-2030 ($ million)
Chart on Bottled water coolers - Year-over-year growth 2025-2030 (%)
Data Table on Bottled water coolers - Year-over-year growth 2025-2030 (%)

8.4 Plumbed-in water coolers - Market size and forecast 2025-2030

Chart on Plumbed-in water coolers - Market size and forecast 2025-2030 ($ million)
Data Table on Plumbed-in water coolers - Market size and forecast 2025-2030 ($ million)
Chart on Plumbed-in water coolers - Year-over-year growth 2025-2030 (%)
Data Table on Plumbed-in water coolers - Year-over-year growth 2025-2030 (%)

8.5 Market opportunity by Product

Market opportunity by Product ($ million)
Data Table on Market opportunity by Product ($ million)

9. Market Segmentation by Application

9.1 Market segments

Chart on Application - Market share 2025-2030 (%)
Data Table on Application - Market share 2025-2030 (%)

9.2 Comparison by Application

Chart on Comparison by Application
Data Table on Comparison by Application

9.3 Commercial - Market size and forecast 2025-2030

Chart on Commercial - Market size and forecast 2025-2030 ($ million)
Data Table on Commercial - Market size and forecast 2025-2030 ($ million)
Chart on Commercial - Year-over-year growth 2025-2030 (%)
Data Table on Commercial - Year-over-year growth 2025-2030 (%)

9.4 Residential - Market size and forecast 2025-2030

Chart on Residential - Market size and forecast 2025-2030 ($ million)
Data Table on Residential - Market size and forecast 2025-2030 ($ million)
Chart on Residential - Year-over-year growth 2025-2030 (%)
Data Table on Residential - Year-over-year growth 2025-2030 (%)

9.5 Market opportunity by Application

Market opportunity by Application ($ million)
Data Table on Market opportunity by Application ($ million)

10. Market Segmentation by Distribution Channel

10.1 Market segments

Chart on Distribution Channel - Market share 2025-2030 (%)
Data Table on Distribution Channel - Market share 2025-2030 (%)

10.2 Comparison by Distribution Channel

Chart on Comparison by Distribution Channel
Data Table on Comparison by Distribution Channel

10.3 Offline - Market size and forecast 2025-2030

Chart on Offline - Market size and forecast 2025-2030 ($ million)
Data Table on Offline - Market size and forecast 2025-2030 ($ million)
Chart on Offline - Year-over-year growth 2025-2030 (%)
Data Table on Offline - Year-over-year growth 2025-2030 (%)

10.4 Online - Market size and forecast 2025-2030

Chart on Online - Market size and forecast 2025-2030 ($ million)
Data Table on Online - Market size and forecast 2025-2030 ($ million)
Chart on Online - Year-over-year growth 2025-2030 (%)
Data Table on Online - Year-over-year growth 2025-2030 (%)

10.5 Market opportunity by Distribution Channel

Market opportunity by Distribution Channel ($ million)
Data Table on Market opportunity by Distribution Channel ($ million)

11. Customer Landscape

11.1 Customer landscape overview

Analysis of price sensitivity, lifecycle, customer purchase basket, adoption rates, and purchase criteria

12. Geographic Landscape

12.1 Geographic segmentation

Chart on Market share by geography 2025-2030 (%)
Data Table on Market share by geography 2025-2030 (%)

12.2 Geographic comparison

Chart on Geographic comparison
Data Table on Geographic comparison

12.3 Europe - Market size and forecast 2025-2030

Chart on Europe - Market size and forecast 2025-2030 ($ million)
Data Table on Europe - Market size and forecast 2025-2030 ($ million)
Chart on Europe - Year-over-year growth 2025-2030 (%)
Data Table on Europe - Year-over-year growth 2025-2030 (%)
Chart on Regional Comparison - Europe
Data Table on Regional Comparison - Europe

12.3.1 France - Market size and forecast 2025-2030

Chart on France - Market size and forecast 2025-2030 ($ million)
Data Table on France - Market size and forecast 2025-2030 ($ million)
Chart on France - Year-over-year growth 2025-2030 (%)
Data Table on France - Year-over-year growth 2025-2030 (%)

12.3.2 UK - Market size and forecast 2025-2030

Chart on UK - Market size and forecast 2025-2030 ($ million)
Data Table on UK - Market size and forecast 2025-2030 ($ million)
Chart on UK - Year-over-year growth 2025-2030 (%)
Data Table on UK - Year-over-year growth 2025-2030 (%)

12.3.3 Germany - Market size and forecast 2025-2030

Chart on Germany - Market size and forecast 2025-2030 ($ million)
Data Table on Germany - Market size and forecast 2025-2030 ($ million)
Chart on Germany - Year-over-year growth 2025-2030 (%)
Data Table on Germany - Year-over-year growth 2025-2030 (%)

12.3.4 Italy - Market size and forecast 2025-2030

Chart on Italy - Market size and forecast 2025-2030 ($ million)
Data Table on Italy - Market size and forecast 2025-2030 ($ million)
Chart on Italy - Year-over-year growth 2025-2030 (%)
Data Table on Italy - Year-over-year growth 2025-2030 (%)

12.3.5 Spain - Market size and forecast 2025-2030

Chart on Spain - Market size and forecast 2025-2030 ($ million)
Data Table on Spain - Market size and forecast 2025-2030 ($ million)
Chart on Spain - Year-over-year growth 2025-2030 (%)
Data Table on Spain - Year-over-year growth 2025-2030 (%)

12.3.6 The Netherlands - Market size and forecast 2025-2030

Chart on The Netherlands - Market size and forecast 2025-2030 ($ million)
Data Table on The Netherlands - Market size and forecast 2025-2030 ($ million)
Chart on The Netherlands - Year-over-year growth 2025-2030 (%)
Data Table on The Netherlands - Year-over-year growth 2025-2030 (%)

12.4 North America - Market size and forecast 2025-2030

Chart on North America - Market size and forecast 2025-2030 ($ million)
Data Table on North America - Market size and forecast 2025-2030 ($ million)
Chart on North America - Year-over-year growth 2025-2030 (%)
Data Table on North America - Year-over-year growth 2025-2030 (%)
Chart on Regional Comparison - North America
Data Table on Regional Comparison - North America

12.4.1 US - Market size and forecast 2025-2030

Chart on US - Market size and forecast 2025-2030 ($ million)
Data Table on US - Market size and forecast 2025-2030 ($ million)
Chart on US - Year-over-year growth 2025-2030 (%)
Data Table on US - Year-over-year growth 2025-2030 (%)

12.4.2 Canada - Market size and forecast 2025-2030

Chart on Canada - Market size and forecast 2025-2030 ($ million)
Data Table on Canada - Market size and forecast 2025-2030 ($ million)
Chart on Canada - Year-over-year growth 2025-2030 (%)
Data Table on Canada - Year-over-year growth 2025-2030 (%)

12.4.3 Mexico - Market size and forecast 2025-2030

Chart on Mexico - Market size and forecast 2025-2030 ($ million)
Data Table on Mexico - Market size and forecast 2025-2030 ($ million)
Chart on Mexico - Year-over-year growth 2025-2030 (%)
Data Table on Mexico - Year-over-year growth 2025-2030 (%)

12.5 APAC - Market size and forecast 2025-2030

Chart on APAC - Market size and forecast 2025-2030 ($ million)
Data Table on APAC - Market size and forecast 2025-2030 ($ million)
Chart on APAC - Year-over-year growth 2025-2030 (%)
Data Table on APAC - Year-over-year growth 2025-2030 (%)
Chart on Regional Comparison - APAC
Data Table on Regional Comparison - APAC

12.5.1 China - Market size and forecast 2025-2030

Chart on China - Market size and forecast 2025-2030 ($ million)
Data Table on China - Market size and forecast 2025-2030 ($ million)
Chart on China - Year-over-year growth 2025-2030 (%)
Data Table on China - Year-over-year growth 2025-2030 (%)

12.5.2 Japan - Market size and forecast 2025-2030

Chart on Japan - Market size and forecast 2025-2030 ($ million)
Data Table on Japan - Market size and forecast 2025-2030 ($ million)
Chart on Japan - Year-over-year growth 2025-2030 (%)
Data Table on Japan - Year-over-year growth 2025-2030 (%)

12.5.3 India - Market size and forecast 2025-2030

Chart on India - Market size and forecast 2025-2030 ($ million)
Data Table on India - Market size and forecast 2025-2030 ($ million)
Chart on India - Year-over-year growth 2025-2030 (%)
Data Table on India - Year-over-year growth 2025-2030 (%)

12.5.4 South Korea - Market size and forecast 2025-2030

Chart on South Korea - Market size and forecast 2025-2030 ($ million)
Data Table on South Korea - Market size and forecast 2025-2030 ($ million)
Chart on South Korea - Year-over-year growth 2025-2030 (%)
Data Table on South Korea - Year-over-year growth 2025-2030 (%)

12.5.5 Australia - Market size and forecast 2025-2030

Chart on Australia - Market size and forecast 2025-2030 ($ million)
Data Table on Australia - Market size and forecast 2025-2030 ($ million)
Chart on Australia - Year-over-year growth 2025-2030 (%)
Data Table on Australia - Year-over-year growth 2025-2030 (%)

12.5.6 Indonesia - Market size and forecast 2025-2030

Chart on Indonesia - Market size and forecast 2025-2030 ($ million)
Data Table on Indonesia - Market size and forecast 2025-2030 ($ million)
Chart on Indonesia - Year-over-year growth 2025-2030 (%)
Data Table on Indonesia - Year-over-year growth 2025-2030 (%)

12.6 Middle East and Africa - Market size and forecast 2025-2030

Chart on Middle East and Africa - Market size and forecast 2025-2030 ($ million)
Data Table on Middle East and Africa - Market size and forecast 2025-2030 ($ million)
Chart on Middle East and Africa - Year-over-year growth 2025-2030 (%)
Data Table on Middle East and Africa - Year-over-year growth 2025-2030 (%)
Chart on Regional Comparison - Middle East and Africa
Data Table on Regional Comparison - Middle East and Africa

12.6.1 Saudi Arabia - Market size and forecast 2025-2030

Chart on Saudi Arabia - Market size and forecast 2025-2030 ($ million)
Data Table on Saudi Arabia - Market size and forecast 2025-2030 ($ million)
Chart on Saudi Arabia - Year-over-year growth 2025-2030 (%)
Data Table on Saudi Arabia - Year-over-year growth 2025-2030 (%)

12.6.2 UAE - Market size and forecast 2025-2030

Chart on UAE - Market size and forecast 2025-2030 ($ million)
Data Table on UAE - Market size and forecast 2025-2030 ($ million)
Chart on UAE - Year-over-year growth 2025-2030 (%)
Data Table on UAE - Year-over-year growth 2025-2030 (%)

12.6.3 South Africa - Market size and forecast 2025-2030

Chart on South Africa - Market size and forecast 2025-2030 ($ million)
Data Table on South Africa - Market size and forecast 2025-2030 ($ million)
Chart on South Africa - Year-over-year growth 2025-2030 (%)
Data Table on South Africa - Year-over-year growth 2025-2030 (%)

12.6.4 Israel - Market size and forecast 2025-2030

Chart on Israel - Market size and forecast 2025-2030 ($ million)
Data Table on Israel - Market size and forecast 2025-2030 ($ million)
Chart on Israel - Year-over-year growth 2025-2030 (%)
Data Table on Israel - Year-over-year growth 2025-2030 (%)

12.6.5 Turkey - Market size and forecast 2025-2030

Chart on Turkey - Market size and forecast 2025-2030 ($ million)
Data Table on Turkey - Market size and forecast 2025-2030 ($ million)
Chart on Turkey - Year-over-year growth 2025-2030 (%)
Data Table on Turkey - Year-over-year growth 2025-2030 (%)

12.7 South America - Market size and forecast 2025-2030

Chart on South America - Market size and forecast 2025-2030 ($ million)
Data Table on South America - Market size and forecast 2025-2030 ($ million)
Chart on South America - Year-over-year growth 2025-2030 (%)
Data Table on South America - Year-over-year growth 2025-2030 (%)
Chart on Regional Comparison - South America
Data Table on Regional Comparison - South America

12.7.1 Brazil - Market size and forecast 2025-2030

Chart on Brazil - Market size and forecast 2025-2030 ($ million)
Data Table on Brazil - Market size and forecast 2025-2030 ($ million)
Chart on Brazil - Year-over-year growth 2025-2030 (%)
Data Table on Brazil - Year-over-year growth 2025-2030 (%)

12.7.2 Argentina - Market size and forecast 2025-2030

Chart on Argentina - Market size and forecast 2025-2030 ($ million)
Data Table on Argentina - Market size and forecast 2025-2030 ($ million)
Chart on Argentina - Year-over-year growth 2025-2030 (%)
Data Table on Argentina - Year-over-year growth 2025-2030 (%)

12.7.3 Chile - Market size and forecast 2025-2030

Chart on Chile - Market size and forecast 2025-2030 ($ million)
Data Table on Chile - Market size and forecast 2025-2030 ($ million)
Chart on Chile - Year-over-year growth 2025-2030 (%)
Data Table on Chile - Year-over-year growth 2025-2030 (%)

12.8 Market opportunity by geography

Market opportunity by geography ($ million)
Data Tables on Market opportunity by geography ($ million)

13. Drivers, Challenges, and Opportunity

13.1 Market drivers

Growing focus on health and wellness among end-users
Technological integration of IoT and smart monitoring systems
Heightened environmental awareness and plastic reduction mandates

13.2 Market challenges

Escalating raw material costs and supply chain volatility
Increasing regulatory pressure and energy efficiency standards
High initial investment and infrastructure limitations

13.3 Impact of drivers and challenges

Impact of drivers and challenges in 2025 and 2030

13.4 Market opportunities

Expansion of premium multi-functional and high-capacity dispensing systems
Acceleration of energy-efficient compressor technologies and eco-friendly refrigerants
Emergence of specialized nanotechnology and targeted contaminant filtration

14. Competitive Landscape

14.1 Overview

14.2

Overview on criticality of inputs and factors of differentiation

14.3 Landscape disruption

Overview on factors of disruption

14.4 Industry risks

Impact of key risks on business

15. Competitive Analysis

15.1 Companies profiled

Companies covered

15.2 Company ranking index

15.3 Market positioning of companies

Matrix on companies position and classification

15.4 AB Electrolux

AB Electrolux - Overview
AB Electrolux - Business segments
AB Electrolux - Key offerings
AB Electrolux - Segment focus
SWOT

15.5 Blue Star Ltd.

Blue Star Ltd. - Overview
Blue Star Ltd. - Business segments
Blue Star Ltd. - Key offerings
Blue Star Ltd. - Segment focus
SWOT

15.6 Breville Group Ltd.

Breville Group Ltd. - Overview
Breville Group Ltd. - Business segments
Breville Group Ltd. - Key offerings
Breville Group Ltd. - Segment focus
SWOT

15.7 Carrier Global Corp.

Carrier Global Corp. - Overview
Carrier Global Corp. - Business segments
Carrier Global Corp. - Key news
Carrier Global Corp. - Key offerings
Carrier Global Corp. - Segment focus
SWOT

15.8 Clover Co. Ltd

Clover Co. Ltd - Overview
Clover Co. Ltd - Product / Service
Clover Co. Ltd - Key offerings
SWOT

15.9 Elkay Manufacturing Co.

Elkay Manufacturing Co. - Overview
Elkay Manufacturing Co. - Product / Service
Elkay Manufacturing Co. - Key offerings
SWOT

15.10 Haier Smart Home Co. Ltd.

Haier Smart Home Co. Ltd. - Overview
Haier Smart Home Co. Ltd. - Business segments
Haier Smart Home Co. Ltd. - Key offerings
Haier Smart Home Co. Ltd. - Segment focus
SWOT

15.11 Honeywell International Inc.

Honeywell International Inc. - Overview
Honeywell International Inc. - Business segments
Honeywell International Inc. - Key news
Honeywell International Inc. - Key offerings
Honeywell International Inc. - Segment focus
SWOT

15.12 KENT RO Systems Ltd.

KENT RO Systems Ltd. - Overview
KENT RO Systems Ltd. - Product / Service
KENT RO Systems Ltd. - Key offerings
SWOT

15.13 LAMO Electrical Appliance Group

LAMO Electrical Appliance Group - Overview
LAMO Electrical Appliance Group - Product / Service
LAMO Electrical Appliance Group - Key offerings
SWOT

15.14 Midea Group Co. Ltd.

Midea Group Co. Ltd. - Overview
Midea Group Co. Ltd. - Business segments
Midea Group Co. Ltd. - Key offerings
Midea Group Co. Ltd. - Segment focus
SWOT

15.15 Pure Water Systems Inc.

Pure Water Systems Inc. - Overview
Pure Water Systems Inc. - Product / Service
Pure Water Systems Inc. - Key offerings
SWOT

15.16 Voltas Ltd.

Voltas Ltd. - Overview
Voltas Ltd. - Business segments
Voltas Ltd. - Key offerings
Voltas Ltd. - Segment focus
SWOT

15.17 Waterlogic Holdings Ltd.

Waterlogic Holdings Ltd. - Overview
Waterlogic Holdings Ltd. - Product / Service
Waterlogic Holdings Ltd. - Key offerings
SWOT

15.18 Whirlpool Corp.

Whirlpool Corp. - Overview
Whirlpool Corp. - Business segments
Whirlpool Corp. - Key offerings
Whirlpool Corp. - Segment focus
SWOT

16. Appendix

16.1 Scope of the report

Market definition
Objectives
Notes and caveats

16.2 Inclusions and exclusions checklist

Inclusions checklist
Exclusions checklist

16.3 Currency conversion rates for US$

16.4 Research methodology

16.5 Data procurement

Information sources

16.6 Data validation

16.7 Validation techniques employed for market sizing

16.8 Data synthesis

16.9 360 degree market analysis

16.10 List of abbreviations

Research Methodology

Technavio presents a detailed picture of the market by way of study, synthesis, and summation of data from multiple sources. The analysts have presented the various facets of the market with a particular focus on identifying the key industry influencers. The data thus presented is comprehensive, reliable, and the result of extensive research, both primary and secondary.

INFORMATION SOURCES

Primary sources

  • Manufacturers and suppliers
  • Channel partners
  • Industry experts
  • Strategic decision makers

Secondary sources

  • Industry journals and periodicals
  • Government data
  • Financial reports of key industry players
  • Historical data
  • Press releases

DATA ANALYSIS

Data Synthesis

  • Collation of data
  • Estimation of key figures
  • Analysis of derived insights

Data Validation

  • Triangulation with data models
  • Reference against proprietary databases
  • Corroboration with industry experts

REPORT WRITING

Qualitative

  • Market drivers
  • Market challenges
  • Market trends
  • Five forces analysis

Quantitative

  • Market size and forecast
  • Market segmentation
  • Geographical insights
  • Competitive landscape

Interested in this report?

Get your sample now to see our research methodology and insights!

Download Now

Frequently Asked Questions

Water Coolers market growth will increase by USD 787.0 million during 2026-2030.

The Water Coolers market is expected to grow at a CAGR of 6.3% during 2026-2030.

Water Coolers market is segmented by Product (Bottled water coolers, Plumbed-in water coolers) Application (Commercial, Residential) Distribution channel (Offline, Online)

AB Electrolux, Blue Star Ltd., Breville Group Ltd., Carrier Global Corp., Clover Co. Ltd, Culligan International Co., Elkay Manufacturing Co., Haier Smart Home Co. Ltd., Honeywell International Inc., JNOD Group, KENT RO Systems Ltd., LAMO Electrical Appliance Group, Midea Group Co. Ltd., OASIS International, Olansi Healthcare Co. Ltd., Pure Water Systems Inc., Sunrise Aquacooler, Voltas Ltd., Waterlogic Holdings Ltd., Whirlpool Corp. are a few of the key vendors in the Water Coolers market.

Europe will register the highest growth rate of 34.1% among the other regions. Therefore, the Water Coolers market in Europe is expected to garner significant business opportunities for the vendors during the forecast period.

France, UK, Germany, Italy, Spain, The Netherlands, US, Canada, Mexico, China, Japan, India, South Korea, Australia, Indonesia, Saudi Arabia, UAE, South Africa, Israel, Turkey, Brazil, Argentina, Chile

  • Growing focus on health and wellness among end-users is the driving factor this market.

The Water Coolers market vendors should focus on grabbing business opportunities from the Product segment as it accounted for the largest market share in the base year.
RIA - Research AI Assistant
Ask RIA