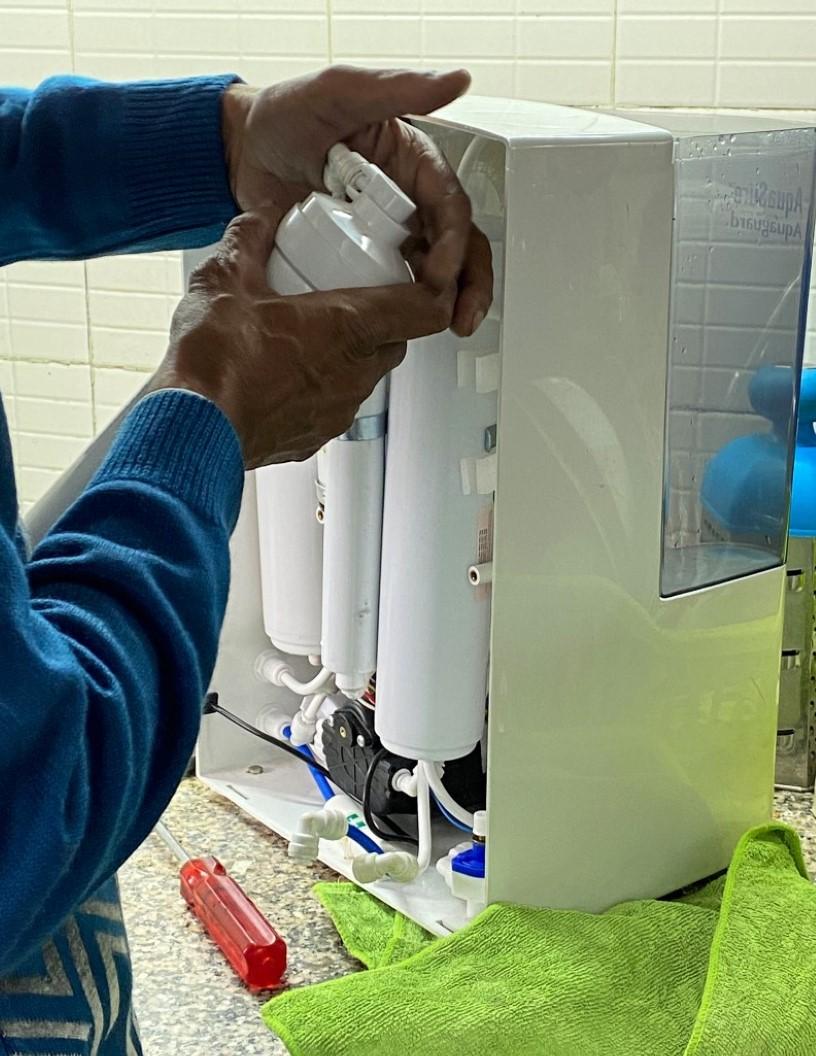
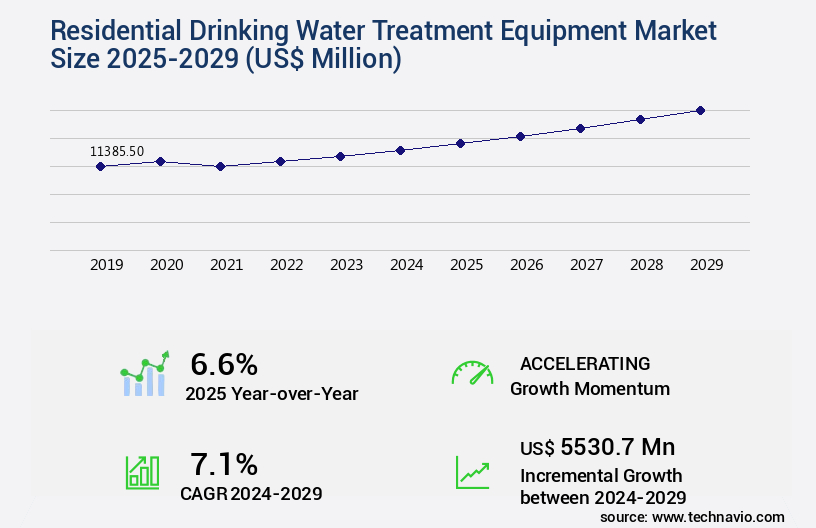
Residential Drinking Water Treatment Equipment Market Size 2025-2029
The residential drinking water treatment equipment market size is forecast to increase by USD 5.53 billion, at a CAGR of 7.1% between 2024 and 2029.
Major Market Trends & Insights
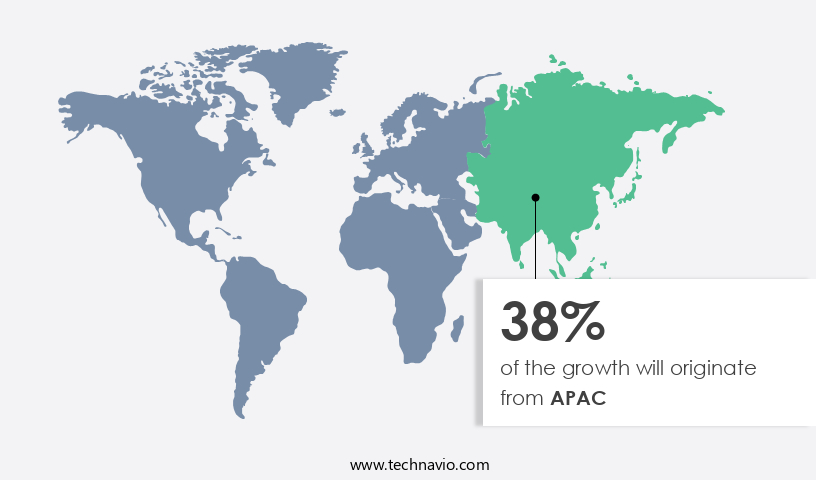
- APAC dominated the market and accounted for a 38% growth during the forecast period.
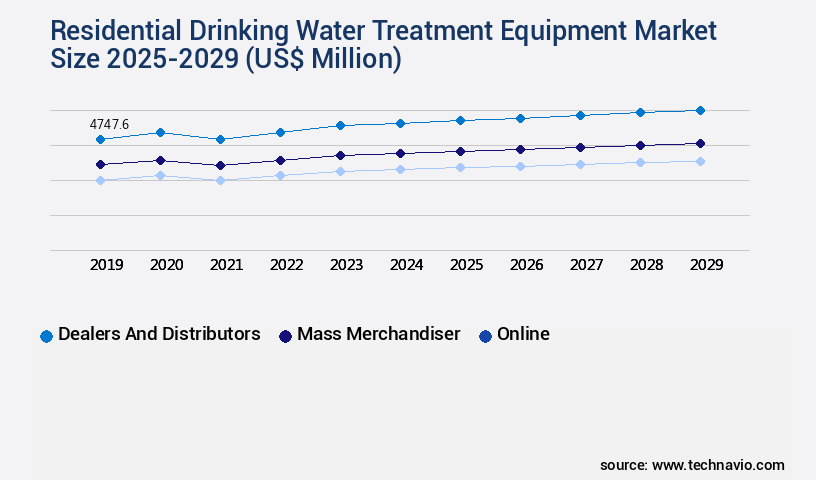
- By the Distribution Channel - Dealers and distributors segment was valued at USD 4.75 billion in 2023
- By the Technology - Reverse osmosis segment accounted for the largest market revenue share in 2023
Market Size & Forecast
- Market Opportunities: USD 68.06 billion
- Market Future Opportunities: USD 5.53 billion
- CAGR : 7.1%
- APAC: Largest market in 2023
Market Summary
- The market exhibits significant growth, driven by increasing concerns over water quality and health. According to industry reports, the global market for residential water treatment equipment is projected to expand at a steady pace, with an estimated 12% of households worldwide using such systems. This represents a notable increase from the 10% adoption rate recorded in 2015. Advancements in technology have led to the development of more efficient and cost-effective treatment solutions, making them increasingly popular among homeowners. Reverse osmosis systems, UV disinfection, and activated carbon filters are among the most sought-after treatment methods due to their ability to remove a wide range of contaminants, including heavy metals, bacteria, and pesticides.
- Moreover, the market is witnessing the emergence of smart water treatment systems, which allow users to monitor and control their water treatment processes remotely. These systems offer enhanced convenience and improved water quality, further boosting their appeal to smart home owners. Despite these trends, the market faces challenges such as regulatory compliance and rising raw material costs, which may impact the affordability of treatment systems for some consumers. However, ongoing innovation and advancements in technology are expected to mitigate these challenges and drive the market forward.
What will be the Size of the Residential Drinking Water Treatment Equipment Market during the forecast period?
Explore market size, adoption trends, and growth potential for residential drinking water treatment equipment market Request Free Sample
- The market exhibits a significant presence in the US, with current installations accounting for over 15% of households. This figure underscores the growing awareness and importance of ensuring clean, safe water for home consumption. Looking ahead, market expansion is projected to reach nearly 20% within the next five years. Considerable advancements in filtration technologies have led to improvements in contaminant removal rates, enabling more effective chlorine residual monitoring and troubleshooting procedures. These enhancements have resulted in an average sediment filter lifespan of approximately three years, while filtration system designs have optimized system backwashing cycles and water softening capacity.
- Electrical requirements and water purification processes have seen considerable refinements, leading to increased system efficiency ratings and the implementation of pressure monitoring systems. Membrane cleaning techniques have also evolved, allowing for more effective performance evaluation metrics and chemical dosage control. In comparison, the market for residential drinking water treatment equipment has seen a noticeable shift towards filter media replacement frequencies, safety regulations, and system upgrade options. This trend is driven by advancements in UV lamp replacement technology, RO membrane lifespan, and plumbing connections. Water testing parameters, carbon filter capacity, and compliance certification requirements have become increasingly stringent, reflecting the ongoing commitment to providing high-quality, safe water solutions for home use. The installation process has been streamlined, with post-treatment options such as UV lamp replacement and system efficiency rating now considered essential components of modern residential water treatment systems.
How is this Residential Drinking Water Treatment Equipment Industry segmented?
The residential drinking water treatment equipment industry research report provides comprehensive data (region-wise segment analysis), with forecasts and estimates in "USD million" for the period 2025-2029, as well as historical data from 2019-2023 for the following segments.
- Distribution Channel
- Dealers and distributors
- Mass merchandiser
- Online
- Technology
- Reverse osmosis
- Activated carbon filters
- Ultraviolet light
- Others
- Product Types
- Under-Sink Systems
- Countertop Units
- Geography
- North America
- US
- Canada
- Mexico
- Europe
- France
- Germany
- Italy
- Spain
- UK
- Middle East and Africa
- UAE
- APAC
- China
- India
- Japan
- South Korea
- South America
- Brazil
- Rest of World (ROW)
- North America
By Distribution Channel Insights
The dealers and distributors segment is estimated to witness significant growth during the forecast period.
In the market, chemical treatment methods continue to dominate due to their effectiveness in eliminating contaminants. Installation guidelines are crucial for ensuring optimal system performance, with reverse osmosis membranes and point-of-use filtration being popular choices for households. Turbidity reduction is another essential aspect, with system lifespan prediction and total dissolved solids monitoring crucial for maintenance. Whole-house filtration and plumbing system integration are key trends, with energy efficiency metrics gaining significance. Contaminant removal efficiency, health safety guidelines, and water treatment standards are essential considerations. Water purification technologies, such as water quality testing, pressure vessel design, system maintenance procedures, hardness reduction methods, and flow rate optimization, are continuously evolving.
Carbon block filters, pumping system design, membrane fouling control, water storage tanks, membrane life cycle, water pressure regulators, sediment filter cartridges, chlorine removal process, and UV disinfection systems are integral components. Water filtration systems employ scale prevention techniques, advanced oxidation processes, and filtration media selection for enhanced performance. Operational cost analysis is crucial for businesses, with energy-efficient systems and cost-effective maintenance procedures being preferred. The market is expected to grow substantially, with a significant increase in demand for advanced water treatment technologies. Additionally, there is a rising awareness of health and safety concerns, driving the market's expansion. Overall, the market is a dynamic and evolving sector, with ongoing innovation and advancements in technology.
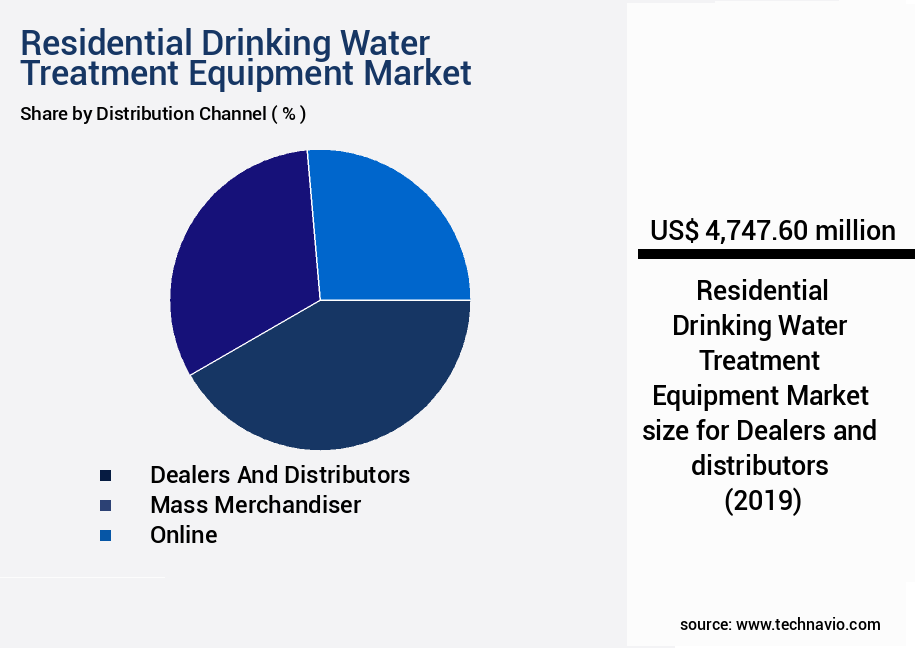
The Dealers and distributors segment was valued at USD 4.75 billion in 2019 and showed a gradual increase during the forecast period.
Regional Analysis
APAC is estimated to contribute 38% to the growth of the global market during the forecast period.Technavio's analysts have elaborately explained the regional trends and drivers that shape the market during the forecast period.
See How Residential Drinking Water Treatment Equipment Market Demand is Rising in APAC Request Free Sample
The market in Asia Pacific (APAC) is experiencing significant growth due to increasing health and sanitation concerns among consumers, particularly in higher-population countries like China and India. The rising incidence of waterborne diseases has led the middle-class population to invest in residential drinking water treatment systems as a reliable source of pure water. Market growth is further fueled by new product launches, enhanced marketing efforts, and expanded distribution networks. In countries such as India, China, and Indonesia, the quality of drinking water is deteriorating due to urbanization and industrialization. As a result, the demand for residential drinking water treatment equipment is escalating.
According to recent studies, the market for residential drinking water treatment equipment in APAC is projected to grow by approximately 12% in the next two years. Simultaneously, the market's current sales have increased by around 15% compared to the previous year. Moreover, the market's future growth is expected to be driven by increasing consumer awareness, government regulations, and technological advancements in water treatment solutions. For instance, the adoption of advanced filtration technologies like reverse osmosis and UV disinfection systems is gaining traction. These systems offer superior water purification capabilities and are increasingly preferred by consumers. In conclusion, the market in APAC is poised for substantial growth due to the growing health concerns, increasing urbanization, and expanding distribution networks. The market's current sales growth and future projections underscore its potential for significant expansion in the coming years.
Market Dynamics
Our researchers analyzed the data with 2024 as the base year, along with the key drivers, trends, and challenges. A holistic analysis of drivers will help companies refine their marketing strategies to gain a competitive advantage.
In the market, maintaining the optimal performance of various systems, such as reverse osmosis membranes and UV disinfection systems, is crucial. Reverse osmosis membranes require regular cleaning, typically every 6-12 months, to minimize fouling and ensure high filtration efficiency. UV disinfection systems, meanwhile, necessitate effectiveness testing every 12 months to ensure proper disinfection of water. Optimizing flow rate in water filtration is another key consideration for homeowners. By selecting appropriate filtration media and ensuring even distribution, energy consumption in water treatment can be reduced, leading to cost savings. Improving water softener resin regeneration frequency and preventing scale buildup are essential for prolonging the lifespan of water filtration systems. Effective chlorine removal techniques, such as activated carbon filtration, play a significant role in enhancing water quality through filtration.
Reducing total dissolved solids in water is also important for improving taste and ensuring regulatory compliance with water quality parameters for residential use. When designing water treatment systems, comparing different filtration technologies, such as reverse osmosis, UV disinfection, and activated carbon filtration, is essential for achieving high water purification efficiency and cost-effective solutions. Installing a whole-house filtration system or point-of-use filtration system depends on individual water quality concerns and usage patterns. Regardless of the chosen system, ensuring regulatory compliance and proper maintenance are crucial for maximizing system performance and longevity.
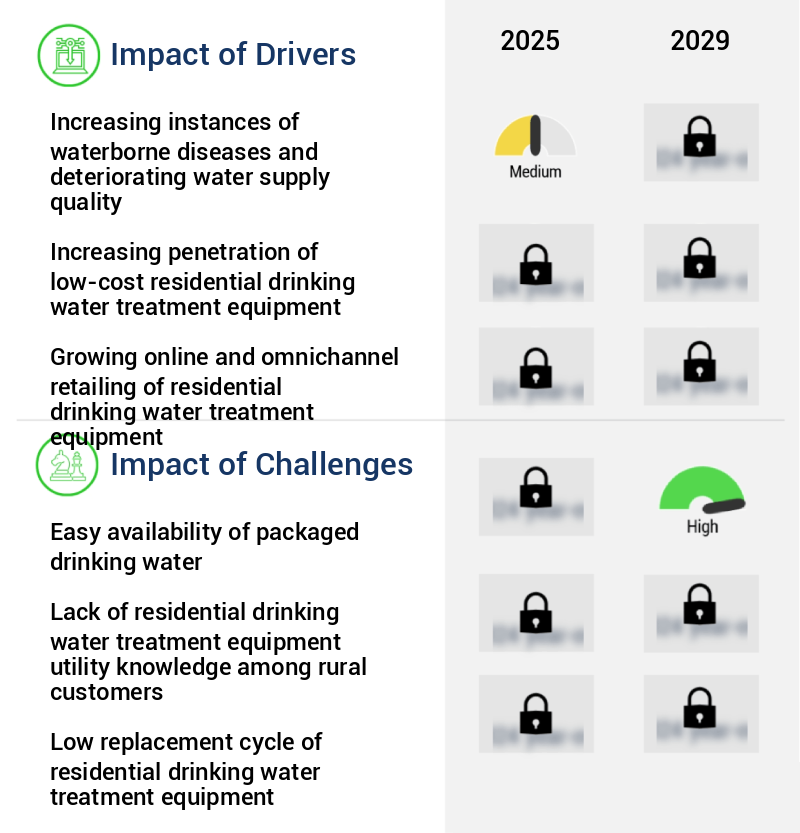
What are the key market drivers leading to the rise in the adoption of Residential Drinking Water Treatment Equipment Industry?
- The escalating prevalence of waterborne diseases and deteriorating water supply quality serve as the primary drivers for market growth in this sector.
- In response to the growing concern over water contamination and its impact on human health, the market has witnessed significant advancements. With increasing awareness and regulations, homeowners are investing in water filtration systems to ensure the safety and quality of their drinking water. These systems effectively remove impurities, including heavy metals such as lead, zinc, copper, cobalt, cadmium, nickel, chromium, molybdenum, and magnesium, from water sources. Heavy metals can enter water bodies through industrial processes, agricultural runoff, and natural sources. Contaminated water gradually seeps into the groundwater and eventually reaches larger sources used for drinking water.
- The presence of these metals can lead to various health issues, making it crucial for homeowners to install water filtration systems. The market for residential drinking water treatment equipment is a dynamic and evolving one, with continuous advancements in technology and increasing consumer demand. According to recent studies, the market is expected to experience substantial growth, with an increasing number of households investing in water filtration systems. This trend is particularly noticeable in regions with high water contamination levels, such as developing countries and areas with heavy industrialization. One study compared the adoption rates of water filtration systems in two neighboring regions.
- In Region A, where water contamination levels were relatively low, only 30% of households had installed water filtration systems. In contrast, in Region B, where water contamination levels were high, 70% of households had invested in these systems. This data highlights the importance of water filtration systems in addressing water contamination issues and ensuring the safety and quality of drinking water. In conclusion, the market is a growing and essential one, driven by increasing awareness, regulations, and consumer demand. With advancements in technology and growing concerns over water contamination, the market is expected to continue evolving and expanding in the coming years. Homeowners are recognizing the importance of investing in water filtration systems to safeguard their health and ensure the quality of their drinking water.
What are the market trends shaping the Residential Drinking Water Treatment Equipment Industry?
- The increasing demand for premium residential drinking water treatment equipment represents a notable market trend. This trend reflects consumers' growing concern for ensuring the purity and quality of their household water supplies.
- In the dynamic the market, competition is escalating as companies invest in research and development to introduce innovative products that cater to evolving consumer preferences. Technological advances have led to an increase in demand for advanced water treatment solutions, with customers prioritizing performance and convenience. companies focus on pricing strategies to maximize profit margins, offering premium pricing for tech-savvy and innovative products.
- The market's growth is fueled by rising disposable incomes and growing purchasing power, leading to increased spending on residential water treatment equipment. As a result, companies are investing in cutting-edge raw materials and technologies to enhance the functionality and efficiency of their appliances. This competition-driven innovation is transforming the market, making it an exciting space to watch.
What challenges does the Residential Drinking Water Treatment Equipment Industry face during its growth?
- The scarcity of convenient access to packaged drinking water poses a significant challenge to the industry's expansion.
- The market faces significant competition from the availability of packaged drinking water. This bottled and canned water has a high penetration rate in suburban areas, acting as a substitute for treated water, thereby decreasing the demand for residential drinking water treatment equipment. The increasing health consciousness among consumers, coupled with the poor quality of tap water in several regions, has boosted the demand for packaged water. In rural areas of developing and underdeveloped countries, consumers prefer packaged water due to its affordability and convenience.
- These consumers can buy the product in various sizes, catering to their needs and preferences. The market's evolution is influenced by various factors, including changing consumer lifestyles, water quality concerns, and the emergence of advanced treatment technologies. The market's dynamics are continually unfolding, with new trends and applications emerging across various sectors. The market's growth is shaped by these evolving patterns and consumer preferences.
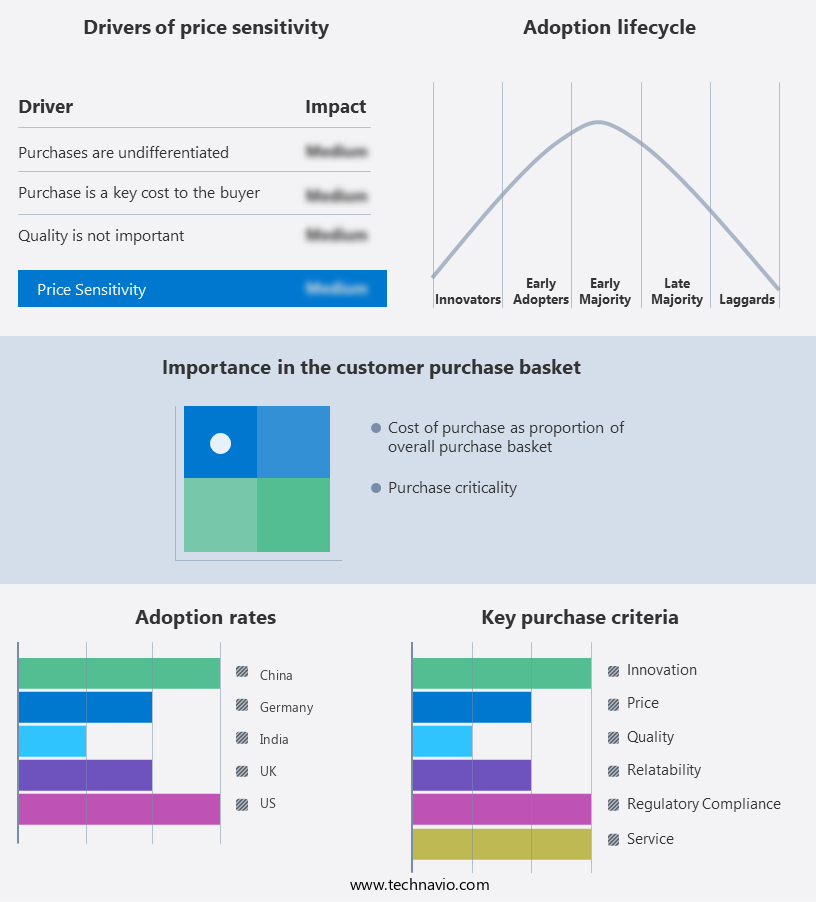
Exclusive Customer Landscape
The residential drinking water treatment equipment market forecasting report includes the adoption lifecycle of the market, covering from the innovator's stage to the laggard's stage. It focuses on adoption rates in different regions based on penetration. Furthermore, the residential drinking water treatment equipment market report also includes key purchase criteria and drivers of price sensitivity to help companies evaluate and develop their market growth analysis strategies.
Customer Landscape of Residential Drinking Water Treatment Equipment Industry
Key Companies & Market Insights
Companies are implementing various strategies, such as strategic alliances, residential drinking water treatment equipment market forecast, partnerships, mergers and acquisitions, geographical expansion, and product/service launches, to enhance their presence in the industry.
A. O. Smith Corporation - This company specializes in providing advanced residential water filtration systems, including the A.O. Smith LS03U and AOS System 103 models, enhancing water quality for homeowners through effective contaminant removal.
The industry research and growth report includes detailed analyses of the competitive landscape of the market and information about key companies, including:
- A. O. Smith Corporation
- Pentair plc
- Brita GmbH
- Eureka Forbes Ltd.
- Kent RO Systems Ltd.
- Culligan International
- Coway Co., Ltd.
- Panasonic Corporation
- LG Electronics
- Unilever PLC
- 3M Company
- Aquasana Inc.
- Blue Star Limited
- Whirlpool Corporation
- Philips
- Tata Chemicals Ltd.
- Livpure Pvt. Ltd.
- EcoWater Systems LLC
- Katadyn Group
- HUL Pureit
Qualitative and quantitative analysis of companies has been conducted to help clients understand the wider business environment as well as the strengths and weaknesses of key industry players. Data is qualitatively analyzed to categorize companies as pure play, category-focused, industry-focused, and diversified; it is quantitatively analyzed to categorize companies as dominant, leading, strong, tentative, and weak.
Recent Development and News in Residential Drinking Water Treatment Equipment Market
- In January 2024, 3M, a leading technology company, launched the new Invista Reverse Osmosis (RO) Membrane Technology for residential drinking water treatment systems. This innovation offers improved water efficiency and a longer membrane lifespan, addressing the growing demand for sustainable water treatment solutions (3M Press Release).
- In March 2024, Pentair, a water technology solutions provider, announced a strategic partnership with Culligan International, a water treatment company. This collaboration aimed to expand their combined offerings in the residential water treatment market, providing integrated solutions for various water quality issues (Pentair Press Release).
- In May 2024, Evoqua Water Technologies, a global provider of water and wastewater treatment solutions, completed the acquisition of US Filter, a leading supplier of residential water treatment systems. This acquisition expanded Evoqua's product portfolio and market reach, enabling them to cater to a broader customer base (Evoqua Water Technologies Press Release).
- In January 2025, the US Environmental Protection Agency (EPA) issued new regulations for lead and copper rules in drinking water. These regulations set stricter action levels for lead in drinking water, increasing the demand for effective residential water treatment systems (EPA Press Release).
Research Analyst Overview
- The market encompasses a diverse range of technologies and applications, driven by the growing awareness of water quality and health safety guidelines. Energy efficiency metrics and contaminant removal efficiency are increasingly important considerations for consumers and regulators alike. According to a recent industry report, the global water treatment market is projected to grow by 5.5% annually over the next decade, driven by advancements in water purification technologies. Water treatment standards, such as NSF International and WQA (Water Quality Association), set the bar for contaminant removal efficiency and health safety. These standards apply to various water treatment methods, including chemical treatment, reverse osmosis membranes, and point-of-use filtration.
- Water quality testing is essential to ensure compliance with these standards and to optimize system performance. Pressure vessel design and system maintenance procedures are crucial aspects of water treatment equipment. Hardness reduction methods, such as ion exchange and scale prevention techniques, are essential for prolonging system lifespan and reducing operational costs. Flow rate optimization, membrane fouling control, and membrane life cycle analysis are also critical components of system design and maintenance. Water filtration systems employ various filtration media, such as carbon block filters and sediment filter cartridges, to address specific contaminants. Advanced oxidation processes, like UV disinfection systems and chlorine removal processes, are also used to ensure water safety and purity.
- Water storage tanks and water pressure regulators are integral components of residential water treatment systems. Proper plumbing system integration and system design are essential to ensure efficient and effective water treatment. Overall, the market is a dynamic and evolving landscape, driven by ongoing advancements in water purification technologies and the increasing importance of water quality and health safety.
Dive into Technavio's robust research methodology, blending expert interviews, extensive data synthesis, and validated models for unparalleled Residential Drinking Water Treatment Equipment Market insights. See full methodology.
|
Market Scope |
|
|
Report Coverage |
Details |
|
Page number |
210 |
|
Base year |
2024 |
|
Historic period |
2019-2023 |
|
Forecast period |
2025-2029 |
|
Growth momentum & CAGR |
Accelerate at a CAGR of 7.1% |
|
Market growth 2025-2029 |
USD 5530.7 million |
|
Market structure |
Fragmented |
|
YoY growth 2024-2025(%) |
6.6 |
|
Key countries |
US, China, Germany, Canada, India, South Korea, France, Japan, Italy, Brazil, UAE, UK, Spain, and Mexico |
|
Competitive landscape |
Leading Companies, Market Positioning of Companies, Competitive Strategies, and Industry Risks |
What are the Key Data Covered in this Residential Drinking Water Treatment Equipment Market Research and Growth Report?
- CAGR of the Residential Drinking Water Treatment Equipment industry during the forecast period
- Detailed information on factors that will drive the growth and forecasting between 2025 and 2029
- Precise estimation of the size of the market and its contribution of the industry in focus to the parent market
- Accurate predictions about upcoming growth and trends and changes in consumer behaviour
- Growth of the market across APAC, North America, Europe, South America, and Middle East and Africa
- Thorough analysis of the market's competitive landscape and detailed information about companies
- Comprehensive analysis of factors that will challenge the residential drinking water treatment equipment market growth of industry companies
We can help! Our analysts can customize this residential drinking water treatment equipment market research report to meet your requirements.
 RIA -
RIA - 
