Water Treatment Equipment In Power Industry Market Size 2025-2029
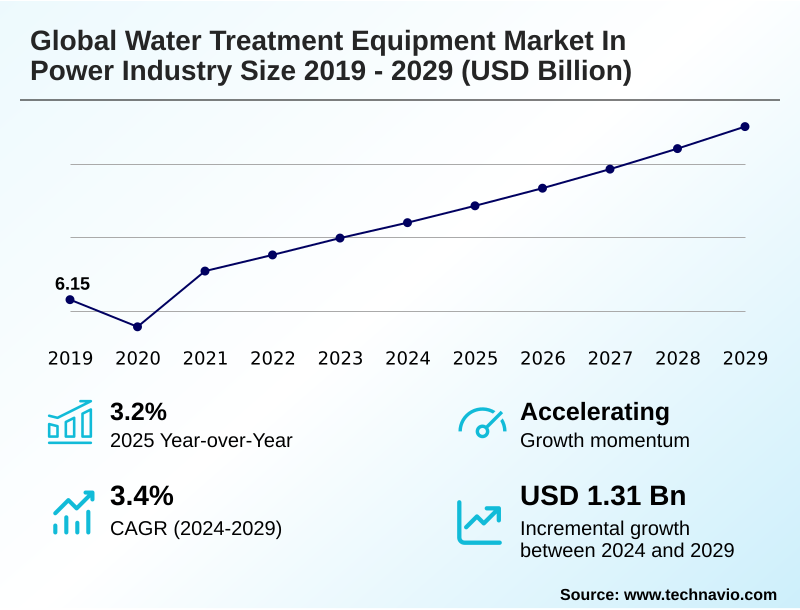
The water treatment equipment in power industry market size is valued to increase by USD 1.31 billion, at a CAGR of 3.4% from 2024 to 2029. Increasing power demand will drive the water treatment equipment in power industry market.
Major Market Trends & Insights
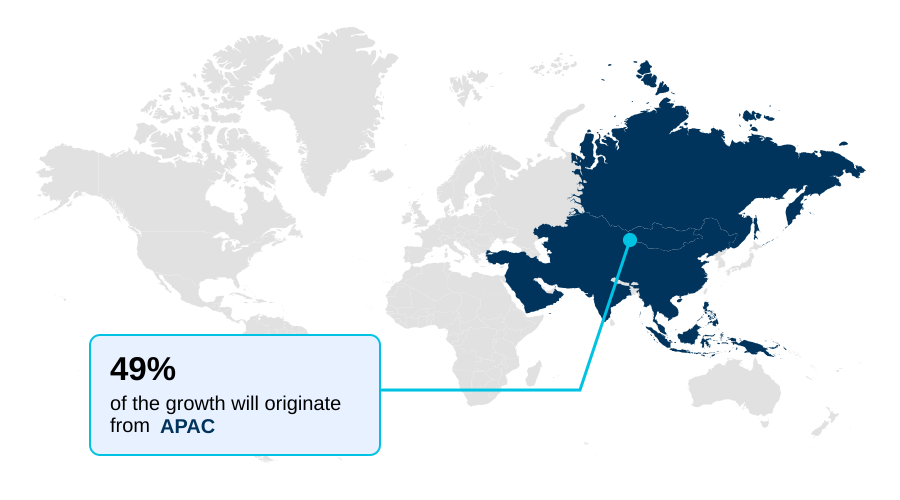
- APAC dominated the market and accounted for a 49.4% growth during the forecast period.
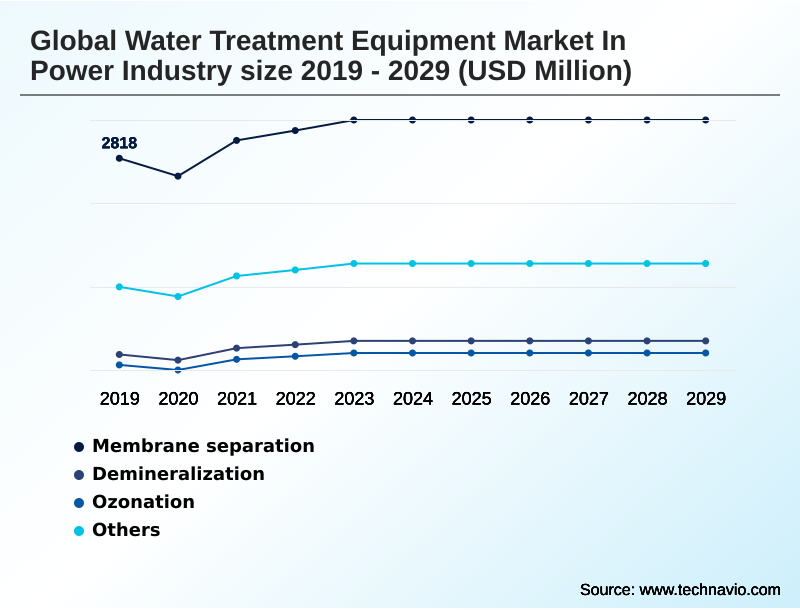
- By Type - Membrane separation segment was valued at USD 3.19 billion in 2023
- By Application - Raw water treatment segment accounted for the largest market revenue share in 2023
Market Size & Forecast
- Market Opportunities: USD 2.37 billion
- Market Future Opportunities: USD 1.31 billion
- CAGR from 2024 to 2029 : 3.4%
Market Summary
- The water treatment equipment market in power industry is expanding, driven by the critical need for high-purity water in power generation cycles and increasingly stringent environmental regulations. Key industry drivers include the global rise in electricity demand, the expansion of industrial infrastructure, and the growing emphasis on water conservation and reuse.
- Market trends are shaped by technological innovation, particularly in membrane filtration, zero liquid discharge systems, and smart water management technologies that leverage AI and IoT for predictive analytics and operational optimization.
- For instance, a thermal power plant can deploy an integrated system combining reverse osmosis and boiler feed water treatment to ensure water purity, minimize scaling, and comply with strict wastewater discharge limits, thereby enhancing operational efficiency and extending asset lifespan.
- However, the market faces challenges related to the high capital investment required for advanced systems, the operational complexity of managing diverse water sources, and the need to upgrade aging infrastructure. Navigating these dynamics requires a strategic focus on cost-effective, adaptable, and sustainable water treatment solutions that address both regulatory pressures and the operational demands of the power sector.
What will be the Size of the Water Treatment Equipment In Power Industry Market during the forecast period?
Get Key Insights on Market Forecast (PDF) Get Free Sample
How is the Water Treatment Equipment In Power Industry Market Segmented?
The water treatment equipment in power industry industry research report provides comprehensive data (region-wise segment analysis), with forecasts and estimates in "USD million" for the period 2025-2029, as well as historical data from 2019-2023 for the following segments.
- Type
- Membrane separation
- Demineralization
- Ozonation
- Others
- Application
- Raw water treatment
- Wastewater treatment
- Solution
- Secondary treatment
- Primary treatment
- Tertiary treatment
- Geography
- APAC
- China
- Japan
- India
- Europe
- Germany
- UK
- France
- North America
- US
- Canada
- Mexico
- South America
- Brazil
- Argentina
- Colombia
- Middle East and Africa
- Saudi Arabia
- UAE
- South Africa
- Rest of World (ROW)
- APAC
By Type Insights
The membrane separation segment is estimated to witness significant growth during the forecast period.
The membrane separation segment is integral to the water treatment equipment market in power industry, driven by high-efficiency contaminant removal. This segment’s growth is underpinned by stringent regulations and the need for high-purity water.
The deployment of advanced ion exchange resins and condensate polishing units is critical for maintaining boiler integrity and preventing corrosion and scale inhibition.
Innovations in activated carbon filtration and UV disinfection systems are enhancing process water purity standards, a key factor in operational reliability.
Effective water-energy nexus optimization is a primary goal, with modern systems demonstrating a 15% improvement in resource recovery from wastewater streams. This focus on efficiency and purity reinforces the segment’s indispensable role in modern power generation facilities.
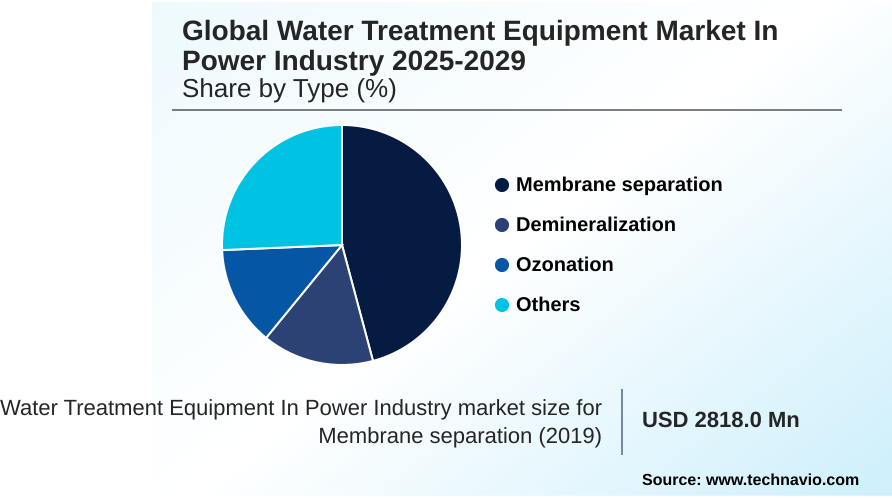
The Membrane separation segment was valued at USD 3.19 billion in 2023 and showed a gradual increase during the forecast period.
Regional Analysis
APAC is estimated to contribute 49.4% to the growth of the global market during the forecast period.Technavio’s analysts have elaborately explained the regional trends and drivers that shape the market during the forecast period.
See How Water Treatment Equipment In Power Industry Market Demand is Rising in APAC Get Free Sample
The geographic landscape of the water treatment equipment market in power industry is led by APAC, which accounts for 49.4% of the market's incremental growth, driven by massive capital expenditure on water assets in countries like China and India.
This region is rapidly adopting technologies like reverse osmosis systems and ultrafiltration membranes to manage the thermal power plant water cycle and treat flue gas desulfurization wastewater.
North America focuses on upgrading existing facilities, integrating membrane bioreactors and advanced raw water intake screens to build resilient water infrastructure.
Europe is advancing decentralized water treatment solutions, while developing economies in South America and the Middle East and Africa are initiating new projects.
The US market, comparatively larger than China's by a significant margin, shows mature adoption but continued investment in technology upgrades.
Market Dynamics
Our researchers analyzed the data with 2024 as the base year, along with the key drivers, trends, and challenges. A holistic analysis of drivers will help companies refine their marketing strategies to gain a competitive advantage.
- Strategic decision-making in the water treatment equipment market in power industry increasingly centers on specialized applications and long-term operational viability. The effective implementation of advanced monitoring for boiler feedwater is critical, as it directly impacts thermal efficiency, with performance gaps of up to 15% observed between optimized and standard plants.
- Concurrently, automation in cooling tower treatment is becoming standard practice to manage water chemistry and reduce manual oversight. For facilities focused on sustainability, the choice between different membrane filtration for industrial reuse technologies is pivotal. A major focus is on reducing operational complexity in treatment, often through the adoption of modular water treatment solutions and hybrid water treatment system design.
- Firms are actively managing varying raw water sources by investing in adaptable systems and upgrading aging water treatment infrastructure to mitigate risks. The high cost of non-compliance discharge is a powerful incentive for investing in reliable biological treatment of power plant effluent. This investment yields significant efficiency gains from smart water technologies.
- The zero liquid discharge system cost, though substantial, is often justified by long-term water security and regulatory certainty. Key technical considerations include membrane fouling prevention techniques and the real-time control of chemical dosing to optimize performance. Sustainable water management in power generation is no longer optional, involving data analytics for water optimization and thorough risk mitigation for water assets.
- Regulatory impact on treatment design continues to evolve, favoring energy-efficient desalination for power and systems that deliver high-purity water for turbines.
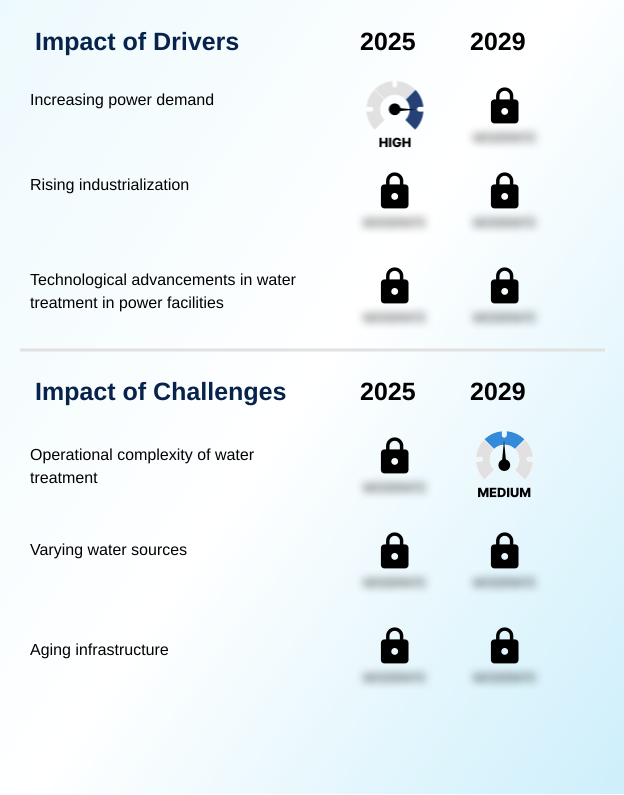
What are the key market drivers leading to the rise in the adoption of Water Treatment Equipment In Power Industry Industry?
- The primary market driver is the increasing global demand for power, which necessitates greater volumes of treated water for plant operations and cooling processes.
- Stringent environmental mandates and growing water scarcity impact on power generation are the primary drivers for the market.
- The push for regulatory compliance for discharge has accelerated the adoption of zero liquid discharge systems, with early adopters reporting a 90% reduction in non-compliance incidents.
- This shift supports a broader move toward a circular economy in water management and a significant industrial water footprint reduction. Advanced wastewater reuse technology is now capable of cutting plant-level freshwater consumption by as much as 75%.
- Essential processes like boiler feed water treatment, cooling tower water management, and the construction of new demineralization plants are increasingly designed with water reuse as a core component, reflecting a fundamental change in resource strategy.
What are the market trends shaping the Water Treatment Equipment In Power Industry Industry?
- The emergence of advanced monitoring and automation technologies is a primary trend in the market, driven by the increasing need for enhanced operational efficiency and predictive maintenance.
- Key market trends are centered on digitalization to enhance asset performance management and operational efficiency in power plants. The integration of smart water grid technology and SCADA systems for water plants enables comprehensive remote plant operation, which has been shown to reduce on-site staffing needs by up to 15%.
- Predictive maintenance for pumps, powered by AI analytics, is another critical development, cutting equipment downtime by over 20%. Furthermore, the use of a digital twin for water plants allows for scenario modeling and process optimization, improving decision-making accuracy.
- These advancements are complemented by sophisticated online water quality monitoring and dissolved air flotation systems that provide real-time data, ensuring immediate response to process deviations and maintaining consistent output quality.
What challenges does the Water Treatment Equipment In Power Industry Industry face during its growth?
- A significant challenge facing the market is the operational complexity of advanced water treatment systems, which requires specialized expertise and significant investment.
- The market faces significant challenges related to the technical and economic complexities of advanced treatment processes. Managing brine concentration management from desalination and zero-liquid-discharge systems remains a primary hurdle, as disposal can account for up to 30% of the lifecycle cost of water systems.
- The effective micropollutant removal from wastewater streams requires sophisticated advanced oxidation processes or electrodeionization systems, which can increase the overall energy consumption of treatment by 15-20% compared to conventional methods. Furthermore, optimizing chemical dosing systems and sludge dewatering equipment continues to be a complex operational task, with inefficiencies directly impacting operating expenditures and environmental compliance in biological wastewater treatment stages.
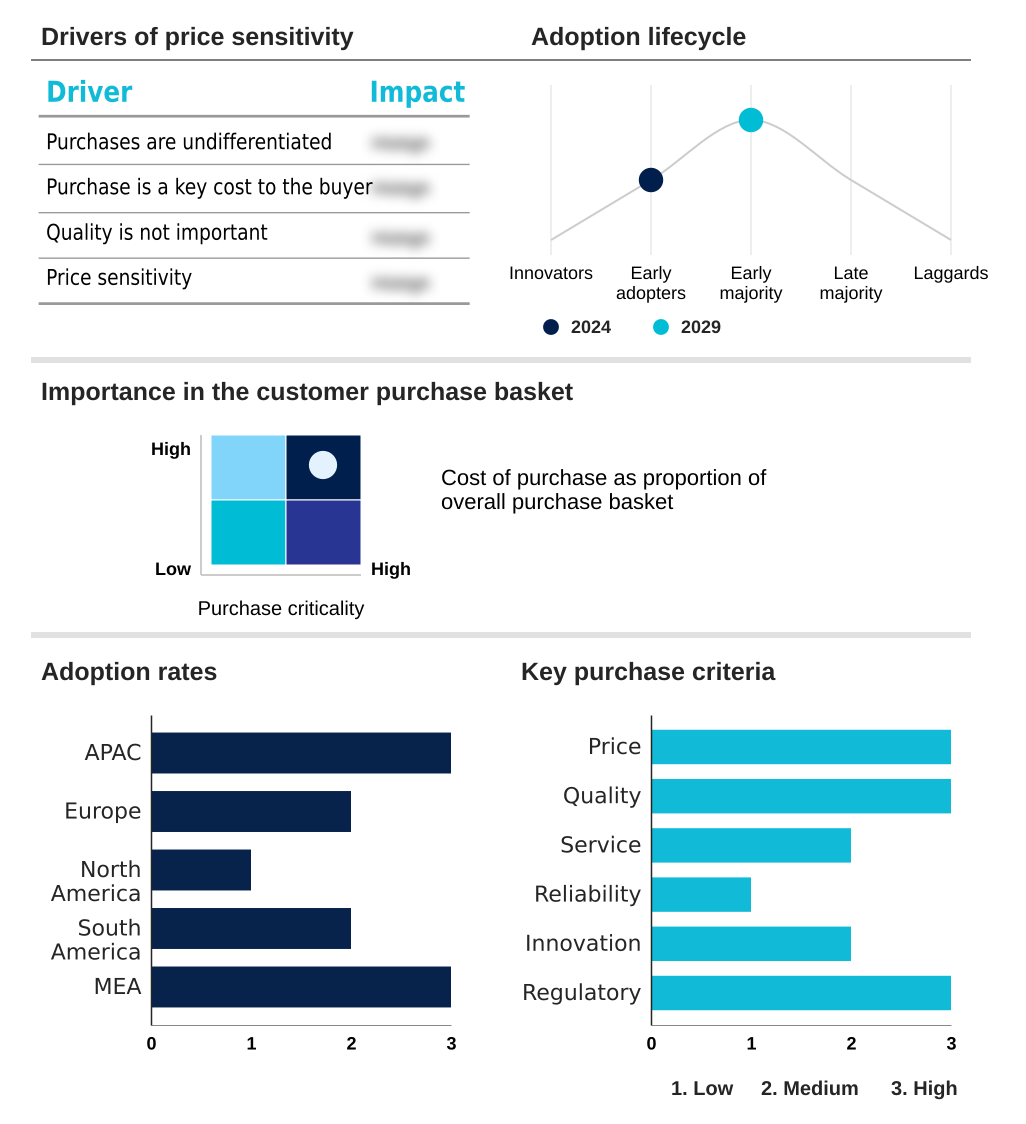
Exclusive Technavio Analysis on Customer Landscape
The water treatment equipment in power industry market forecasting report includes the adoption lifecycle of the market, covering from the innovator’s stage to the laggard’s stage. It focuses on adoption rates in different regions based on penetration. Furthermore, the water treatment equipment in power industry market report also includes key purchase criteria and drivers of price sensitivity to help companies evaluate and develop their market growth analysis strategies.
Customer Landscape of Water Treatment Equipment In Power Industry Industry
Competitive Landscape
Companies are implementing various strategies, such as strategic alliances, water treatment equipment in power industry market forecast, partnerships, mergers and acquisitions, geographical expansion, and product/service launches, to enhance their presence in the industry.
3M Co. - The company delivers integrated water purification and process technologies, specializing in desalination, water reuse, and zero liquid discharge (ZLD) systems for industrial and infrastructure clients.
The industry research and growth report includes detailed analyses of the competitive landscape of the market and information about key companies, including:
- 3M Co.
- Aquatech International LLC
- Black and Veatch Holding Co.
- Culligan International Co.
- Danaher Corp.
- Dow Chemical Co.
- DuPont de Nemours Inc.
- Ecolab Inc.
- Fluence Corp. Ltd.
- General Electric Co.
- Graver Technologies LLC
- KURARAY Co. Ltd.
- Lenntech BV
- Nitto Denko Corp.
- Nomura Micro Science Co. Ltd.
- Pentair Plc
- SKion Water GmbH
- SUEZ SA
- Veolia Environment SA
- Xylem Inc.
Qualitative and quantitative analysis of companies has been conducted to help clients understand the wider business environment as well as the strengths and weaknesses of key industry players. Data is qualitatively analyzed to categorize companies as pure play, category-focused, industry-focused, and diversified; it is quantitatively analyzed to categorize companies as dominant, leading, strong, tentative, and weak.
Recent Development and News in Water treatment equipment in power industry market
- In November, 2024, Xylem Inc. launched its new HydroSphere digital platform, integrating AI-powered analytics to optimize water management and reduce energy consumption in power plant cooling systems.
- In January, 2025, Veolia Environment SA secured a long-term contract to design, build, and operate an advanced water recycling facility for a new semiconductor manufacturing complex, utilizing reverse osmosis and ultraviolet purification.
- In March, 2025, DuPont de Nemours Inc. announced the completion of its new production line for high-rejection reverse osmosis membranes, increasing its global supply capacity to meet demand from the power and industrial sectors.
- In May, 2025, Ecolab Inc. completed the acquisition of Aqua-Chem, a specialized provider of thermal and membrane-based water purification systems, strengthening its portfolio for high-purity water applications in critical industries.
Dive into Technavio’s robust research methodology, blending expert interviews, extensive data synthesis, and validated models for unparalleled Water Treatment Equipment In Power Industry Market insights. See full methodology.
| Market Scope | |
|---|---|
| Page number | 288 |
| Base year | 2024 |
| Historic period | 2019-2023 |
| Forecast period | 2025-2029 |
| Growth momentum & CAGR | Accelerate at a CAGR of 3.4% |
| Market growth 2025-2029 | USD 1311.4 million |
| Market structure | Fragmented |
| YoY growth 2024-2025(%) | 3.2% |
| Key countries | China, Japan, India, South Korea, Australia, Indonesia, Germany, UK, France, Italy, The Netherlands, Spain, US, Canada, Mexico, Brazil, Argentina, Colombia, Saudi Arabia, UAE, South Africa, Israel and Turkey |
| Competitive landscape | Leading Companies, Market Positioning of Companies, Competitive Strategies, and Industry Risks |
Research Analyst Overview
- The water treatment equipment market in power industry is undergoing a significant transformation, driven by the convergence of regulatory pressures and technological advancements. The deployment of integrated systems, including reverse osmosis systems and demineralization plants, is becoming standard for ensuring operational continuity.
- A key boardroom consideration is the shift from capital expenditure to total lifecycle cost, where investments in smart water grid technology and predictive maintenance for pumps are justified by long-term savings and reliability. Technologies such as ultrafiltration membranes and advanced oxidation processes are critical in addressing complex treatment challenges.
- We are observing a clear trend where facilities using online water quality monitoring coupled with automated chemical dosing systems are achieving up to a 25% reduction in chemical consumption. The adoption of membrane bioreactors and electrodeionization systems supports wastewater reuse technology, while innovations in biological wastewater treatment and dissolved air flotation enhance efficiency.
- The focus extends to boiler feed water treatment, cooling tower water management, and handling flue gas desulfurization wastewater, all managed through sophisticated SCADA systems for water plants. Furthermore, ion exchange resins, condensate polishing units, and activated carbon filtration remain essential for achieving high-purity water, with UV disinfection systems and sludge dewatering equipment completing the comprehensive treatment train.
What are the Key Data Covered in this Water Treatment Equipment In Power Industry Market Research and Growth Report?
-
What is the expected growth of the Water Treatment Equipment In Power Industry Market between 2025 and 2029?
-
USD 1.31 billion, at a CAGR of 3.4%
-
-
What segmentation does the market report cover?
-
The report is segmented by Type (Membrane separation, Demineralization, Ozonation, and Others), Application (Raw water treatment, and Wastewater treatment), Solution (Secondary treatment, Primary treatment, and Tertiary treatment) and Geography (APAC, Europe, North America, South America, Middle East and Africa)
-
-
Which regions are analyzed in the report?
-
APAC, Europe, North America, South America and Middle East and Africa
-
-
What are the key growth drivers and market challenges?
-
Increasing power demand, Operational complexity of water treatment
-
-
Who are the major players in the Water Treatment Equipment In Power Industry Market?
-
3M Co., Aquatech International LLC, Black and Veatch Holding Co., Culligan International Co., Danaher Corp., Dow Chemical Co., DuPont de Nemours Inc., Ecolab Inc., Fluence Corp. Ltd., General Electric Co., Graver Technologies LLC, KURARAY Co. Ltd., Lenntech BV, Nitto Denko Corp., Nomura Micro Science Co. Ltd., Pentair Plc, SKion Water GmbH, SUEZ SA, Veolia Environment SA and Xylem Inc.
-
Market Research Insights
- The water treatment equipment market in power industry is shaped by a focus on maximizing the lifecycle cost of water systems and improving asset performance management. Stricter regulatory compliance for discharge is compelling a shift toward advanced solutions, with adoption rates for such technologies being 20% higher than five years ago.
- This drive for industrial water footprint reduction and a circular economy in water management is supported by technologies that improve process water purity standards. Firms leveraging resilient water infrastructure report 15% fewer operational disruptions.
- The emphasis on water-energy nexus optimization has led to new designs that outperform older systems in efficiency, highlighting a clear return on investment through reduced operational expenditures.
We can help! Our analysts can customize this water treatment equipment in power industry market research report to meet your requirements.
 RIA -
RIA - 
