Wearable Patch Market Analysis, Size, and Forecast 2025-2029: North America (US and Canada), Europe (France, Germany, Italy, UK), Middle East and Africa , APAC (China, India, Japan), South America (Brazil), and Rest of World (ROW)

Wearable Patch Market Analysis, Size, and Forecast 2025-2029:
North America (US and Canada), Europe (France, Germany, Italy, UK), Middle East and Africa , APAC (China, India, Japan), South America (Brazil), and Rest of World (ROW)

Published: Apr 2025 238 Pages SKU: IRTNTR43181

Market Overview at a Glance

$8.59 B
Market Opportunity
14.1%
CAGR
12.5
YoY growth 2024-2025(%)

Wearable Patch Market Size 2025-2029

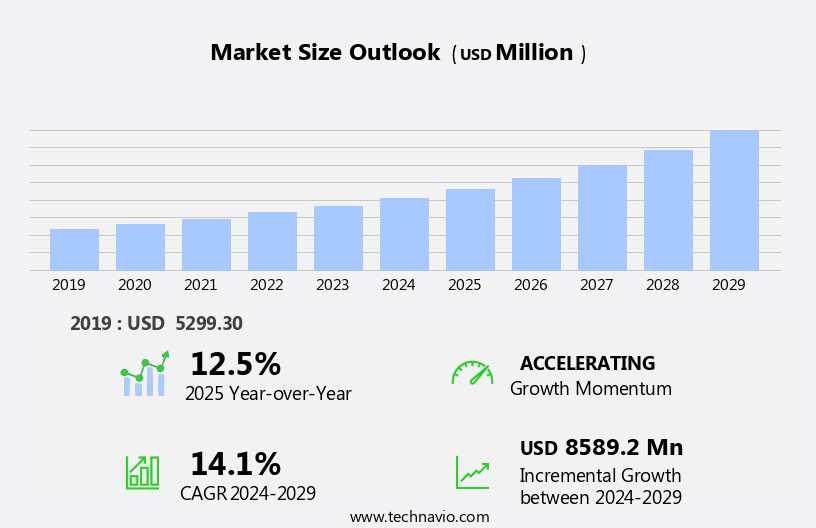
The wearable patch market size is forecast to increase by USD 8.59 billion at a CAGR of 14.1% between 2024 and 2029.

  • The market is experiencing significant growth due to the increasing prevalence of chronic diseases and the subsequent demand for continuous health monitoring solutions. These patches, which can be worn discreetly on the skin, offer real-time health data collection and analysis, enabling early detection and intervention. Furthermore, the shift towards cloud-based solutions is driving market expansion, as these technologies enable remote monitoring, data storage, and analysis. However, concerns regarding data privacy and security pose a significant challenge to market growth. Furthermore, the trend towards cloud-based healthcare services is gaining traction, enabling real-time data access and analysis for healthcare providers and patients.  As companies seek to capitalize on this market opportunity, it is crucial to prioritize data protection measures and transparent data handling practices to build trust with consumers and regulatory bodies.
  • Effective navigation of these challenges, alongside continued innovation in patch technology and design, will be key to success in this dynamic and growing market. The market for electronic skin patches, including nicotine patches, is driven by the increasing prevalence of chronic diseases, which necessitate continuous monitoring and management.

What will be the Size of the Wearable Patch Market during the forecast period?

Wearable Patch Market Size

 Request Free Sample

  • The market is experiencing significant advancements, with key focus areas including user interface design and mobile app integration. Biosensing platforms are at the forefront of innovation, leveraging biodegradable materials and standardization for improved patch adhesion and dermal absorption. Manufacturing processes are refining, with sensor calibration and optical sensing techniques advancing organic electronics and electrochemical sensing. Biocompatible polymers and patch validation are crucial for ensuring patch sustainability and biocompatibility. Cloud-based platforms are transforming patch lifecycle management, enabling real-time data interpretation and patch prototyping. Microneedle patches are gaining traction, offering enhanced functionality and sustainability. The integration of biodegradable polymers and printable electronics is further driving market growth. The market is experiencing significant growth, particularly in the connected wearable segment, driven by advancements in myoelectric technology and Bluetooth connectivity.
  • Patch prototyping and biocompatibility testing are essential components of the wearable patch design process. Innovations in flexible circuits and sensor calibration are addressing challenges in patch manufacturing, while optical sensing and organic electronics are revolutionizing data interpretation. The market is witnessing a shift towards patch sustainability and patch validation, as companies prioritize biocompatible materials and efficient patch lifecycle management. The future of wearable patches lies in the seamless integration of these technologies, providing businesses with valuable insights and improved patient care solutions. Further, connected wearable patches deliver drugs, such as nicotine, through electronic skin, offering an alternative to traditional methods like nicotine patches.

How is this Wearable Patch Industry segmented?

The wearable patch industry research report provides comprehensive data (region-wise segment analysis), with forecasts and estimates in "USD million" for the period 2025-2029, as well as historical data from 2019-2023 for the following segments.

  • Application
    • Clinical
    • Non-clinical
  • Technology
    • Regular
    • Connected
  • End-user
    • Healthcare providers
    • Individual consumers
    • Fitness centers and sports organizations
    • Research institutions
  • Type
    • Glucose monitoring patches
    • Cardiac monitoring patches
    • Fitness and wellness patches
    • Temperature monitoring patches
    • Pain relief and drug delivery patches
  • Geography
    • North America
      • US
      • Canada
    • Europe
      • France
      • Germany
      • Italy
      • UK
    • Middle East and Africa
    • APAC
      • China
      • India
      • Japan
    • South America
      • Brazil
    • Rest of World (ROW)

By Application Insights

The clinical segment is estimated to witness significant growth during the forecast period. Wearable patches represent a significant advancement in healthcare technology, enabling continuous monitoring of patients' health conditions. These patches collect biometric data at regular intervals and transmit it to connected devices, such as smartphones and laptops, for real-time analysis. This remote monitoring eliminates the need for frequent physical consultations with healthcare professionals. In the realm of medical innovation, manufacturers are increasingly focusing on developing wearable devices to address the growing prevalence of lifestyle diseases. These devices aim to provide doctors with valuable insights into patients' health issues, enhancing the overall disease management process. Advancements in technology have led to the creation of sophisticated wearable patches, including those powered by artificial intelligence (AI).

However, the adoption of wearable patches and related technologies also raises concerns regarding data security and privacy. Ensuring the protection of sensitive biometric data is essential to maintain patient trust and confidence in these innovative healthcare solutions. As the market for wearable patches continues to evolve, it is essential to navigate the complex regulatory landscape and comply with compliance regulations. The Internet of Things (IoT) and sensor networks play a crucial role in facilitating the seamless integration of wearable patches into healthcare systems, while adhesive technology ensures the patches remain securely attached to the skin.

In summary, wearable patches represent a transformative force in healthcare, offering remote monitoring, personalized medicine, and early disease detection capabilities. As the technology advances, it is crucial to address concerns related to data security, patient compliance, and regulatory compliance to ensure the successful adoption and integration of wearable patches into healthcare systems.

Wearable Patch Market Size

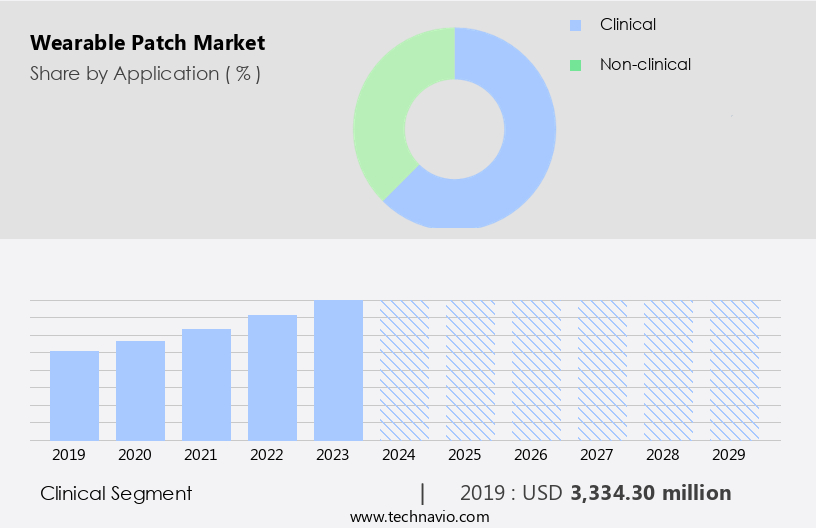
Get a glance at the market report of share of various segments Request Free Sample

The Clinical segment was valued at USD 3.33 billion in 2019 and showed a gradual increase during the forecast period. These AI-driven patches are capable of early detection and diagnosis of conditions such as heart diseases, offering a crucial advantage in preventing potential health complications. Moreover, the integration of transdermal drug delivery systems into wearable patches has given rise to personalized medicine, ensuring effective and efficient treatment plans for patients. Additionally, the development of biocompatible materials and flexible electronics has made wearable patches more comfortable and discreet, increasing patient compliance. The convergence of healthcare and technology has also led to the emergence of digital health solutions, including mobile health applications and body area networks. These technologies facilitate seamless communication between patients and healthcare providers, ensuring timely and accurate diagnosis and treatment.

Regional Analysis

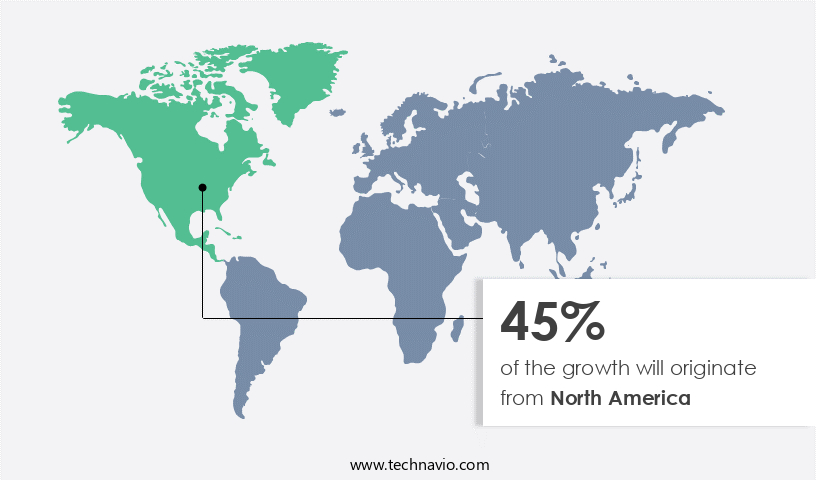
North America is estimated to contribute 45% to the growth of the global market during the forecast period. Technavio's analysts have elaborately explained the regional trends and drivers that shape the market during the forecast period.

Wearable Patch Market Share by Geography

For more insights on the market size of various regions, Request Free Sample

The market in North America is experiencing significant growth due to the increasing health consciousness among individuals in the region. Canada and the United States are the primary contributors to this market, driven by the rising prevalence of obesity and lifestyle diseases. With hectic work schedules leading to unhealthy food choices and decreased physical activity, there is a growing demand for technologies that enable continuous health monitoring. Wearable patches, which offer non-invasive sensing capabilities, are gaining popularity as they allow users to track vital signs, biometric data, and other health metrics in real-time. These patches incorporate advanced technologies such as machine learning algorithms, artificial intelligence, and biocompatible materials to provide accurate and reliable health data. These patches utilize advanced technologies like microprocessor controllers, myoelectric technology, and Bluetooth for wireless connectivity.

Moreover, the integration of other emerging technologies, such as transdermal drug delivery, personalized medicine, and flexible electronics, is expanding the applications of wearable patches beyond basic health monitoring. For instance, smart textiles infused with sensors can be used for health monitoring, patient engagement, and disease management. Wearable patches also offer benefits in areas like sports medicine, where they can be used for fitness tracking and performance optimization. However, privacy concerns and patient compliance remain critical challenges in the market. Ensuring data security and maintaining patient privacy are essential to gaining regulatory approval and market acceptance. As the market evolves, addressing these concerns through advanced data analytics, biometric data encryption, and compliant regulatory frameworks will be crucial.

In summary, the North American market is witnessing growth due to the increasing health consciousness among individuals and the integration of advanced technologies. Addressing privacy concerns and ensuring patient compliance will be key to further expanding the market's potential.

Market Dynamics

Our researchers analyzed the data with 2024 as the base year, along with the key drivers, trends, and challenges. A holistic analysis of drivers will help companies refine their marketing strategies to gain a competitive advantage.

What are the key market drivers leading to the rise in the adoption of Wearable Patch Industry?

  • Growing prevalence of chronic diseases is the key driver of the market. The global wearable patches market is experiencing significant growth due to the increasing prevalence of chronic diseases, such as cancer, cardiovascular conditions, diabetes, and asthma. Wearable patches offer a convenient solution for both physicians and patients, making them an attractive alternative to traditional treatment methods. A sedentary lifestyle contributes to the development of various health disorders, including cardiovascular diseases (CVDs), diabetes, sleep apnea, and other chronic illnesses. With an aging population, the number of individuals suffering from these conditions is expected to increase. In 2024, it is estimated that over 1 billion people will be aged 60 or above. The critical nature of treating these diseases has led to increased hospitalization. Among chronic diseases, CVDs remain the leading cause, followed by chronic respiratory diseases and diabetes. The demand for wearable patches is expected to grow as they provide continuous monitoring and timely intervention, ultimately improving patient outcomes and reducing healthcare costs.

What are the market trends shaping the Wearable Patch Industry?

  • Increasing demand for cloud-based solutions is the upcoming market trend. The healthcare industry's shift towards advanced technologies is driven by the need for improved patient data management and privacy. Cloud computing, as an economical solution, has gained significant traction due to its flexibility and compatibility with existing systems. This technology allows users to access cloud-based storage solutions from any location through web-based portals, enhancing business agility. Furthermore, cloud computing is easily compatible with various software systems, including security systems, device management systems, databases, and business analytics, simplifying implementation. According to a quantitative analysis, the number of diseases managed through wearable patches is projected to expand, with cardiovascular diseases, diabetes, and atrial fibrillation being major areas of focus. With the increasing pressure to manage patient data securely and efficiently, cloud computing offers a viable solution for the healthcare sector.

What challenges does the Wearable Patch Industry face during its growth?

  • Concerns regarding data privacy and security is a key challenge affecting the industry growth. The healthcare industry's digital transformation, marked by the integration of data-generating devices and electronic patient records, has brought about significant advancements in healthcare quality, insights, and cost reduction. However, this shift has also exposed organizational and patient data to increased cybersecurity risks. With healthcare data becoming a valuable asset for various stakeholders, including hospitals, clinics, and insurance companies, securing this data has become a top priority. The proliferation of cyberattacks in the healthcare sector has raised concerns over privacy and data protection. As more medical data is generated and centralized, it becomes increasingly vulnerable to breaches. The digitalization of healthcare workflows and the maintenance of electronic patient records have necessitated cybersecurity measures to safeguard sensitive information. Despite the benefits of advanced technologies in healthcare, security and privacy concerns are hindering their widespread adoption. Ensuring the security and confidentiality of medical data is essential to maintaining trust and building a relationship between patients, healthcare providers, and insurers. Therefore, investing in advanced cybersecurity solutions and implementing best practices to mitigate cyber risks is crucial for the healthcare industry's growth and success.

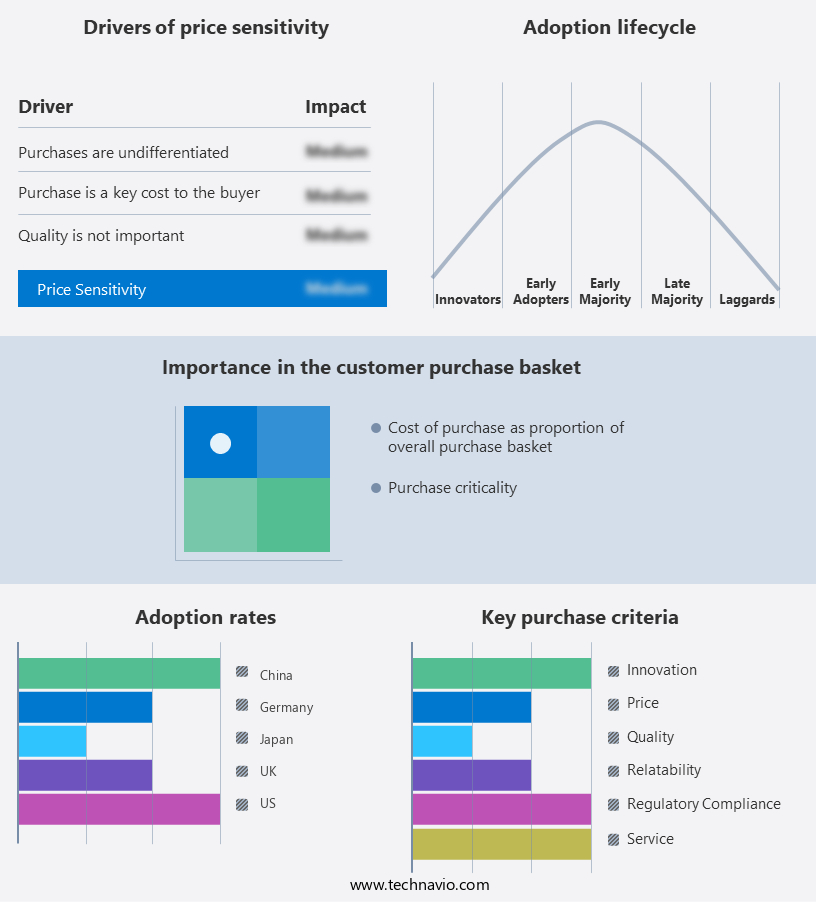
Exclusive Customer Landscape

The wearable patch market forecasting report includes the adoption lifecycle of the market, covering from the innovator's stage to the laggard's stage. It focuses on adoption rates in different regions based on penetration. Furthermore, the wearable patch market report also includes key purchase criteria and drivers of price sensitivity to help companies evaluate and develop their market growth analysis strategies.

Wearable Patch Market Share by Geography

 Customer Landscape

Key Companies & Market Insights

Companies are implementing various strategies, such as strategic alliances, wearable patch market forecast, partnerships, mergers and acquisitions, geographical expansion, and product/service launches, to enhance their presence in the industry.

2M Engineering Ltd. -The company offers wearable health patch which measures and record physiological signals like ECG, bioimpedance, accelerometer and others for research applications.

The industry research and growth report includes detailed analyses of the competitive landscape of the market and information about key companies, including:

  • 2M Engineering Ltd.
  • Abbott Laboratories
  • Apple Inc.
  • Beneli AB
  • Biofourmis Inc.
  • DarioHealth Corp.
  • Dassault Systemes SE
  • DuPont de Nemours Inc.
  • Eoflow Co. Ltd.
  • GENTAG Inc.
  • greenTEG AG
  • Kenzen Inc.
  • LifeSignals Group Inc.
  • Nemaura Medical Inc.
  • PKvitality S.A.S.
  • Prevent Biometrics
  • Qualcomm Inc.
  • Samsung Electronics Co. Ltd.
  • The Surgical Co.
  • VitalConnect Inc.

Qualitative and quantitative analysis of companies has been conducted to help clients understand the wider business environment as well as the strengths and weaknesses of key industry players. Data is qualitatively analyzed to categorize companies as pure play, category-focused, industry-focused, and diversified; it is quantitatively analyzed to categorize companies as dominant, leading, strong, tentative, and weak.

Research Analyst Overview

The market encompasses a diverse range of technologies aimed at delivering various health-related functionalities. These patches, which can be applied to the skin, represent a significant advancement in the realm of healthcare and wellness. Transdermal drug delivery, a key application of wearable patches, enables the administration of medications through the skin, offering several advantages over traditional methods. Machine learning algorithms are increasingly being integrated into wearable patches to facilitate personalized medicine. By analyzing biometric data collected from patients, these systems can provide customized treatment plans, enhancing patient engagement and improving outcomes. Health monitoring is another significant application of wearable patches, with continuous monitoring capabilities enabling early detection and intervention of potential health issues.

The integration of smart textiles and sensor networks in wearable patches has led to the development of body area networks. These networks facilitate the collection and transmission of data from various sensors, allowing for real-time monitoring and analysis. The advent of wearable patches has also given rise to mobile health and precision medicine, enabling remote patient monitoring and disease management. Regulatory approval is a crucial aspect of the market, with regulatory bodies ensuring the safety and efficacy of these devices. Adherence to compliance regulations is essential for market acceptance and growth. Wearable patches also face privacy concerns, necessitating data security measures to protect sensitive patient information.

Power management and energy harvesting are essential considerations in the design and development of wearable patches. Flexible electronics and wireless communication technologies are key enablers, ensuring the patches remain unobtrusive and comfortable for extended periods. Biocompatible materials are another critical factor, ensuring the patches do not cause skin irritation or allergic reactions. The market is also influenced by the Internet of Things (IoT) and digital health trends. Data analytics and biomarker detection are essential applications, enabling healthcare professionals to make informed decisions based on real-time patient data. Fitness tracking and wellness applications are gaining popularity, with wearable patches offering non-invasive sensing capabilities. The global population is aging, leading to an increased prevalence of chronic diseases such as diabetes, cardiovascular diseases, and atrial fibrillation.

Sports medicine is another significant application area for wearable patches, with these devices providing valuable insights into athlete performance and recovery. Wearable patches are also being explored for use in various industries, including industrial safety and military applications. The market represents a rapidly evolving landscape, with numerous applications and technologies driving growth. From transdermal drug delivery and health monitoring to personalized medicine and remote monitoring, wearable patches offer significant benefits across various sectors. Regulatory approval, privacy concerns, and power management are key challenges, but advancements in technology and materials are addressing these issues. The integration of machine learning, artificial intelligence, and data analytics is set to further revolutionize the market, enabling more personalized and effective healthcare solutions.

Market Scope

Report Coverage

Details

Page number

238

Base year

2024

Historic period

2019-2023

Forecast period

2025-2029

Growth momentum & CAGR

Accelerate at a CAGR of 14.1%

Market growth 2025-2029

USD 8.59 billion

Market structure

Fragmented

YoY growth 2024-2025(%)

12.5

Key countries

US, Germany, Canada, UK, China, France, Japan, Italy, India, and Brazil

Competitive landscape

Leading Companies, Market Positioning of Companies, Competitive Strategies, and Industry Risks

Request Free Sample

What are the Key Data Covered in this Wearable Patch Market Research and Growth Report?

  • CAGR of the Wearable Patch industry during the forecast period
  • Detailed information on factors that will drive the growth and forecasting between 2025 and 2029
  • Precise estimation of the size of the market and its contribution of the industry in focus to the parent market
  • Accurate predictions about upcoming growth and trends and changes in consumer behaviour
  • Growth of the market across North America, Europe, Asia, and Rest of World (ROW)
  • Thorough analysis of the market's competitive landscape and detailed information about companies
  • Comprehensive analysis of factors that will challenge the wearable patch market growth and forecasting

We can help! Our analysts can customize this wearable patch market research report to meet your requirements.

Get in touch

1 Executive Summary

  • 1.1 Market overview
    • Executive Summary - Chart on Market Overview
    • Executive Summary - Data Table on Market Overview
    • Executive Summary - Chart on Global Market Characteristics
    • Executive Summary - Chart on Market by Geography
    • Executive Summary - Chart on Market Segmentation by Application
    • Executive Summary - Chart on Market Segmentation by Technology
    • Executive Summary - Chart on Market Segmentation by End-user
    • Executive Summary - Chart on Market Segmentation by Type
    • Executive Summary - Chart on Incremental Growth
    • Executive Summary - Data Table on Incremental Growth
    • Executive Summary - Chart on Company Market Positioning

2 Technavio Analysis

  • 2.1 Analysis of price sensitivity, lifecycle, customer purchase basket, adoption rates, and purchase criteria
    • Analysis of price sensitivity, lifecycle, customer purchase basket, adoption rates, and purchase criteria
  • 2.2 Criticality of inputs and Factors of differentiation
    • Overview on criticality of inputs and factors of differentiation
  • 2.3 Factors of disruption
    • Overview on factors of disruption
  • 2.4 Impact of drivers and challenges
    • Impact of drivers and challenges in 2024 and 2029

3 Market Landscape

  • 3.1 Market ecosystem
    • Parent Market
    • Data Table on - Parent Market
  • 3.2 Market characteristics
    • Market characteristics analysis
  • 3.3 Value chain analysis
    • Value chain analysis

4 Market Sizing

  • 4.1 Market definition
    • Offerings of companies included in the market definition
  • 4.2 Market segment analysis
    • Market segments
  • 4.3 Market size 2024
    • 4.4 Market outlook: Forecast for 2024-2029
      • Chart on Global - Market size and forecast 2024-2029 ($ million)
      • Data Table on Global - Market size and forecast 2024-2029 ($ million)
      • Chart on Global Market: Year-over-year growth 2024-2029 (%)
      • Data Table on Global Market: Year-over-year growth 2024-2029 (%)

    5 Historic Market Size

    • 5.1 Global Wearable Patch Market 2019 - 2023
      • Historic Market Size - Data Table on Global Wearable Patch Market 2019 - 2023 ($ million)
    • 5.2 Application segment analysis 2019 - 2023
      • Historic Market Size - Application Segment 2019 - 2023 ($ million)
    • 5.3 Technology segment analysis 2019 - 2023
      • Historic Market Size - Technology Segment 2019 - 2023 ($ million)
    • 5.4 End-user segment analysis 2019 - 2023
      • Historic Market Size - End-user Segment 2019 - 2023 ($ million)
    • 5.5 Type segment analysis 2019 - 2023
      • Historic Market Size - Type Segment 2019 - 2023 ($ million)
    • 5.6 Geography segment analysis 2019 - 2023
      • Historic Market Size - Geography Segment 2019 - 2023 ($ million)
    • 5.7 Country segment analysis 2019 - 2023
      • Historic Market Size - Country Segment 2019 - 2023 ($ million)

    6 Qualitative Analysis

    • 6.1 Impact of AI in global wearable patch market

      7 Five Forces Analysis

      • 7.1 Five forces summary
        • Five forces analysis - Comparison between 2024 and 2029
      • 7.2 Bargaining power of buyers
        • Bargaining power of buyers - Impact of key factors 2024 and 2029
      • 7.3 Bargaining power of suppliers
        • Bargaining power of suppliers - Impact of key factors in 2024 and 2029
      • 7.4 Threat of new entrants
        • Threat of new entrants - Impact of key factors in 2024 and 2029
      • 7.5 Threat of substitutes
        • Threat of substitutes - Impact of key factors in 2024 and 2029
      • 7.6 Threat of rivalry
        • Threat of rivalry - Impact of key factors in 2024 and 2029
      • 7.7 Market condition
        • Chart on Market condition - Five forces 2024 and 2029

      8 Market Segmentation by Application

      • 8.1 Market segments
        • Chart on Application - Market share 2024-2029 (%)
        • Data Table on Application - Market share 2024-2029 (%)
      • 8.2 Comparison by Application
        • Chart on Comparison by Application
        • Data Table on Comparison by Application
      • 8.3 Clinical - Market size and forecast 2024-2029
        • Chart on Clinical - Market size and forecast 2024-2029 ($ million)
        • Data Table on Clinical - Market size and forecast 2024-2029 ($ million)
        • Chart on Clinical - Year-over-year growth 2024-2029 (%)
        • Data Table on Clinical - Year-over-year growth 2024-2029 (%)
      • 8.4 Non-clinical - Market size and forecast 2024-2029
        • Chart on Non-clinical - Market size and forecast 2024-2029 ($ million)
        • Data Table on Non-clinical - Market size and forecast 2024-2029 ($ million)
        • Chart on Non-clinical - Year-over-year growth 2024-2029 (%)
        • Data Table on Non-clinical - Year-over-year growth 2024-2029 (%)
      • 8.5 Market opportunity by Application
        • Market opportunity by Application ($ million)
        • Data Table on Market opportunity by Application ($ million)

      9 Market Segmentation by Technology

      • 9.1 Market segments
        • Chart on Technology - Market share 2024-2029 (%)
        • Data Table on Technology - Market share 2024-2029 (%)
      • 9.2 Comparison by Technology
        • Chart on Comparison by Technology
        • Data Table on Comparison by Technology
      • 9.3 Regular - Market size and forecast 2024-2029
        • Chart on Regular - Market size and forecast 2024-2029 ($ million)
        • Data Table on Regular - Market size and forecast 2024-2029 ($ million)
        • Chart on Regular - Year-over-year growth 2024-2029 (%)
        • Data Table on Regular - Year-over-year growth 2024-2029 (%)
      • 9.4 Connected - Market size and forecast 2024-2029
        • Chart on Connected - Market size and forecast 2024-2029 ($ million)
        • Data Table on Connected - Market size and forecast 2024-2029 ($ million)
        • Chart on Connected - Year-over-year growth 2024-2029 (%)
        • Data Table on Connected - Year-over-year growth 2024-2029 (%)
      • 9.5 Market opportunity by Technology
        • Market opportunity by Technology ($ million)
        • Data Table on Market opportunity by Technology ($ million)

      10 Market Segmentation by End-user

      • 10.1 Market segments
        • Chart on End-user - Market share 2024-2029 (%)
        • Data Table on End-user - Market share 2024-2029 (%)
      • 10.2 Comparison by End-user
        • Chart on Comparison by End-user
        • Data Table on Comparison by End-user
      • 10.3 Healthcare providers - Market size and forecast 2024-2029
        • Chart on Healthcare providers - Market size and forecast 2024-2029 ($ million)
        • Data Table on Healthcare providers - Market size and forecast 2024-2029 ($ million)
        • Chart on Healthcare providers - Year-over-year growth 2024-2029 (%)
        • Data Table on Healthcare providers - Year-over-year growth 2024-2029 (%)
      • 10.4 Individual consumers - Market size and forecast 2024-2029
        • Chart on Individual consumers - Market size and forecast 2024-2029 ($ million)
        • Data Table on Individual consumers - Market size and forecast 2024-2029 ($ million)
        • Chart on Individual consumers - Year-over-year growth 2024-2029 (%)
        • Data Table on Individual consumers - Year-over-year growth 2024-2029 (%)
      • 10.5 Fitness centers and sports organizations - Market size and forecast 2024-2029
        • Chart on Fitness centers and sports organizations - Market size and forecast 2024-2029 ($ million)
        • Data Table on Fitness centers and sports organizations - Market size and forecast 2024-2029 ($ million)
        • Chart on Fitness centers and sports organizations - Year-over-year growth 2024-2029 (%)
        • Data Table on Fitness centers and sports organizations - Year-over-year growth 2024-2029 (%)
      • 10.6 Research institutions - Market size and forecast 2024-2029
        • Chart on Research institutions - Market size and forecast 2024-2029 ($ million)
        • Data Table on Research institutions - Market size and forecast 2024-2029 ($ million)
        • Chart on Research institutions - Year-over-year growth 2024-2029 (%)
        • Data Table on Research institutions - Year-over-year growth 2024-2029 (%)
      • 10.7 Market opportunity by End-user
        • Market opportunity by End-user ($ million)
        • Data Table on Market opportunity by End-user ($ million)

      11 Market Segmentation by Type

      • 11.1 Market segments
        • Chart on Type - Market share 2024-2029 (%)
        • Data Table on Type - Market share 2024-2029 (%)
      • 11.2 Comparison by Type
        • Chart on Comparison by Type
        • Data Table on Comparison by Type
      • 11.3 Glucose monitoring patches - Market size and forecast 2024-2029
        • Chart on Glucose monitoring patches - Market size and forecast 2024-2029 ($ million)
        • Data Table on Glucose monitoring patches - Market size and forecast 2024-2029 ($ million)
        • Chart on Glucose monitoring patches - Year-over-year growth 2024-2029 (%)
        • Data Table on Glucose monitoring patches - Year-over-year growth 2024-2029 (%)
      • 11.4 Cardiac monitoring patches - Market size and forecast 2024-2029
        • Chart on Cardiac monitoring patches - Market size and forecast 2024-2029 ($ million)
        • Data Table on Cardiac monitoring patches - Market size and forecast 2024-2029 ($ million)
        • Chart on Cardiac monitoring patches - Year-over-year growth 2024-2029 (%)
        • Data Table on Cardiac monitoring patches - Year-over-year growth 2024-2029 (%)
      • 11.5 Fitness and wellness patches - Market size and forecast 2024-2029
        • Chart on Fitness and wellness patches - Market size and forecast 2024-2029 ($ million)
        • Data Table on Fitness and wellness patches - Market size and forecast 2024-2029 ($ million)
        • Chart on Fitness and wellness patches - Year-over-year growth 2024-2029 (%)
        • Data Table on Fitness and wellness patches - Year-over-year growth 2024-2029 (%)
      • 11.6 Temperature monitoring patches - Market size and forecast 2024-2029
        • Chart on Temperature monitoring patches - Market size and forecast 2024-2029 ($ million)
        • Data Table on Temperature monitoring patches - Market size and forecast 2024-2029 ($ million)
        • Chart on Temperature monitoring patches - Year-over-year growth 2024-2029 (%)
        • Data Table on Temperature monitoring patches - Year-over-year growth 2024-2029 (%)
      • 11.7 Pain relief and drug delivery patches - Market size and forecast 2024-2029
        • Chart on Pain relief and drug delivery patches - Market size and forecast 2024-2029 ($ million)
        • Data Table on Pain relief and drug delivery patches - Market size and forecast 2024-2029 ($ million)
        • Chart on Pain relief and drug delivery patches - Year-over-year growth 2024-2029 (%)
        • Data Table on Pain relief and drug delivery patches - Year-over-year growth 2024-2029 (%)
      • 11.8 Market opportunity by Type
        • Market opportunity by Type ($ million)
        • Data Table on Market opportunity by Type ($ million)

      12 Customer Landscape

      • 12.1 Customer landscape overview
        • Analysis of price sensitivity, lifecycle, customer purchase basket, adoption rates, and purchase criteria

      13 Geographic Landscape

      • 13.1 Geographic segmentation
        • Chart on Market share by geography 2024-2029 (%)
        • Data Table on Market share by geography 2024-2029 (%)
      • 13.2 Geographic comparison
        • Chart on Geographic comparison
        • Data Table on Geographic comparison
      • 13.3 North America - Market size and forecast 2024-2029
        • Chart on North America - Market size and forecast 2024-2029 ($ million)
        • Data Table on North America - Market size and forecast 2024-2029 ($ million)
        • Chart on North America - Year-over-year growth 2024-2029 (%)
        • Data Table on North America - Year-over-year growth 2024-2029 (%)
      • 13.4 Europe - Market size and forecast 2024-2029
        • Chart on Europe - Market size and forecast 2024-2029 ($ million)
        • Data Table on Europe - Market size and forecast 2024-2029 ($ million)
        • Chart on Europe - Year-over-year growth 2024-2029 (%)
        • Data Table on Europe - Year-over-year growth 2024-2029 (%)
      • 13.5 Asia - Market size and forecast 2024-2029
        • Chart on Asia - Market size and forecast 2024-2029 ($ million)
        • Data Table on Asia - Market size and forecast 2024-2029 ($ million)
        • Chart on Asia - Year-over-year growth 2024-2029 (%)
        • Data Table on Asia - Year-over-year growth 2024-2029 (%)
      • 13.6 Rest of World (ROW) - Market size and forecast 2024-2029
        • Chart on Rest of World (ROW) - Market size and forecast 2024-2029 ($ million)
        • Data Table on Rest of World (ROW) - Market size and forecast 2024-2029 ($ million)
        • Chart on Rest of World (ROW) - Year-over-year growth 2024-2029 (%)
        • Data Table on Rest of World (ROW) - Year-over-year growth 2024-2029 (%)
      • 13.7 US - Market size and forecast 2024-2029
        • Chart on US - Market size and forecast 2024-2029 ($ million)
        • Data Table on US - Market size and forecast 2024-2029 ($ million)
        • Chart on US - Year-over-year growth 2024-2029 (%)
        • Data Table on US - Year-over-year growth 2024-2029 (%)
      • 13.8 Germany - Market size and forecast 2024-2029
        • Chart on Germany - Market size and forecast 2024-2029 ($ million)
        • Data Table on Germany - Market size and forecast 2024-2029 ($ million)
        • Chart on Germany - Year-over-year growth 2024-2029 (%)
        • Data Table on Germany - Year-over-year growth 2024-2029 (%)
      • 13.9 Canada - Market size and forecast 2024-2029
        • Chart on Canada - Market size and forecast 2024-2029 ($ million)
        • Data Table on Canada - Market size and forecast 2024-2029 ($ million)
        • Chart on Canada - Year-over-year growth 2024-2029 (%)
        • Data Table on Canada - Year-over-year growth 2024-2029 (%)
      • 13.10 China - Market size and forecast 2024-2029
        • Chart on China - Market size and forecast 2024-2029 ($ million)
        • Data Table on China - Market size and forecast 2024-2029 ($ million)
        • Chart on China - Year-over-year growth 2024-2029 (%)
        • Data Table on China - Year-over-year growth 2024-2029 (%)
      • 13.11 UK - Market size and forecast 2024-2029
        • Chart on UK - Market size and forecast 2024-2029 ($ million)
        • Data Table on UK - Market size and forecast 2024-2029 ($ million)
        • Chart on UK - Year-over-year growth 2024-2029 (%)
        • Data Table on UK - Year-over-year growth 2024-2029 (%)
      • 13.12 France - Market size and forecast 2024-2029
        • Chart on France - Market size and forecast 2024-2029 ($ million)
        • Data Table on France - Market size and forecast 2024-2029 ($ million)
        • Chart on France - Year-over-year growth 2024-2029 (%)
        • Data Table on France - Year-over-year growth 2024-2029 (%)
      • 13.13 Japan - Market size and forecast 2024-2029
        • Chart on Japan - Market size and forecast 2024-2029 ($ million)
        • Data Table on Japan - Market size and forecast 2024-2029 ($ million)
        • Chart on Japan - Year-over-year growth 2024-2029 (%)
        • Data Table on Japan - Year-over-year growth 2024-2029 (%)
      • 13.14 Italy - Market size and forecast 2024-2029
        • Chart on Italy - Market size and forecast 2024-2029 ($ million)
        • Data Table on Italy - Market size and forecast 2024-2029 ($ million)
        • Chart on Italy - Year-over-year growth 2024-2029 (%)
        • Data Table on Italy - Year-over-year growth 2024-2029 (%)
      • 13.15 Brazil - Market size and forecast 2024-2029
        • Chart on Brazil - Market size and forecast 2024-2029 ($ million)
        • Data Table on Brazil - Market size and forecast 2024-2029 ($ million)
        • Chart on Brazil - Year-over-year growth 2024-2029 (%)
        • Data Table on Brazil - Year-over-year growth 2024-2029 (%)
      • 13.16 India - Market size and forecast 2024-2029
        • Chart on India - Market size and forecast 2024-2029 ($ million)
        • Data Table on India - Market size and forecast 2024-2029 ($ million)
        • Chart on India - Year-over-year growth 2024-2029 (%)
        • Data Table on India - Year-over-year growth 2024-2029 (%)
      • 13.17 Market opportunity by geography
        • Market opportunity by geography ($ million)
        • Data Tables on Market opportunity by geography ($ million)

      14 Drivers, Challenges, and Opportunity/Restraints

      • 14.1 Market drivers
        • 14.2 Market challenges
          • 14.3 Impact of drivers and challenges
            • Impact of drivers and challenges in 2024 and 2029
          • 14.4 Market opportunities/restraints

            15 Competitive Landscape

            • 15.1 Overview
              • 15.2 Competitive Landscape
                • Overview on criticality of inputs and factors of differentiation
              • 15.3 Landscape disruption
                • Overview on factors of disruption
              • 15.4 Industry risks
                • Impact of key risks on business

              16 Competitive Analysis

              • 16.1 Companies profiled
                • Companies covered
              • 16.2 Company ranking index
                • Company ranking index
              • 16.3 Market positioning of companies
                • Matrix on companies position and classification
              • 2M Engineering Ltd.
                • 2M Engineering Ltd. - Overview
                • 2M Engineering Ltd. - Product / Service
                • 2M Engineering Ltd. - Key offerings
                • SWOT
              • 16.5 Abbott Laboratories
                • Abbott Laboratories - Overview
                • Abbott Laboratories - Business segments
                • Abbott Laboratories - Key news
                • Abbott Laboratories - Key offerings
                • Abbott Laboratories - Segment focus
                • SWOT
              • 16.6 Beneli AB
                • Beneli AB - Overview
                • Beneli AB - Product / Service
                • Beneli AB - Key offerings
                • SWOT
              • 16.7 Biofourmis Inc.
                • Biofourmis Inc. - Overview
                • Biofourmis Inc. - Product / Service
                • Biofourmis Inc. - Key offerings
                • SWOT
              • 16.8 DarioHealth Corp.
                • DarioHealth Corp. - Overview
                • DarioHealth Corp. - Product / Service
                • DarioHealth Corp. - Key offerings
                • SWOT
              • 16.9 Dassault Systemes SE
                • Dassault Systemes SE - Overview
                • Dassault Systemes SE - Business segments
                • Dassault Systemes SE - Key news
                • Dassault Systemes SE - Key offerings
                • Dassault Systemes SE - Segment focus
                • SWOT
              • 16.10 Eoflow Co. Ltd.
                • Eoflow Co. Ltd. - Overview
                • Eoflow Co. Ltd. - Product / Service
                • Eoflow Co. Ltd. - Key offerings
                • SWOT
              • 16.11 GENTAG Inc.
                • GENTAG Inc. - Overview
                • GENTAG Inc. - Product / Service
                • GENTAG Inc. - Key offerings
                • SWOT
              • 16.12 Kenzen Inc.
                • Kenzen Inc. - Overview
                • Kenzen Inc. - Product / Service
                • Kenzen Inc. - Key offerings
                • SWOT
              • 16.13 LifeSignals Group Inc.
                • LifeSignals Group Inc. - Overview
                • LifeSignals Group Inc. - Product / Service
                • LifeSignals Group Inc. - Key offerings
                • SWOT
              • 16.14 Nemaura Medical Inc.
                • Nemaura Medical Inc. - Overview
                • Nemaura Medical Inc. - Product / Service
                • Nemaura Medical Inc. - Key offerings
                • SWOT
              • 16.15 Prevent Biometrics
                • Prevent Biometrics - Overview
                • Prevent Biometrics - Product / Service
                • Prevent Biometrics - Key offerings
                • SWOT
              • 16.16 Qualcomm Inc.
                • Qualcomm Inc. - Overview
                • Qualcomm Inc. - Business segments
                • Qualcomm Inc. - Key news
                • Qualcomm Inc. - Key offerings
                • Qualcomm Inc. - Segment focus
                • SWOT
              • 16.17 The Surgical Co.
                • The Surgical Co. - Overview
                • The Surgical Co. - Product / Service
                • The Surgical Co. - Key offerings
                • SWOT
              • 16.18 VitalConnect Inc.
                • VitalConnect Inc. - Overview
                • VitalConnect Inc. - Product / Service
                • VitalConnect Inc. - Key offerings
                • SWOT

              17 Appendix

              • 17.1 Scope of the report
                • 17.2 Inclusions and exclusions checklist
                  • Inclusions checklist
                  • Exclusions checklist
                • 17.3 Currency conversion rates for US$
                  • Currency conversion rates for US$
                • 17.4 Research methodology
                  • Research methodology
                • 17.5 Data procurement
                  • Information sources
                • 17.6 Data validation
                  • Data validation
                • 17.7 Validation techniques employed for market sizing
                  • Validation techniques employed for market sizing
                • 17.8 Data synthesis
                  • Data synthesis
                • 17.9 360 degree market analysis
                  • 360 degree market analysis
                • 17.10 List of abbreviations
                  • List of abbreviations

                Research Methodology

                Technavio presents a detailed picture of the market by way of study, synthesis, and summation of data from multiple sources. The analysts have presented the various facets of the market with a particular focus on identifying the key industry influencers. The data thus presented is comprehensive, reliable, and the result of extensive research, both primary and secondary.

                INFORMATION SOURCES

                Primary sources

                • Manufacturers and suppliers
                • Channel partners
                • Industry experts
                • Strategic decision makers

                Secondary sources

                • Industry journals and periodicals
                • Government data
                • Financial reports of key industry players
                • Historical data
                • Press releases

                DATA ANALYSIS

                Data Synthesis

                • Collation of data
                • Estimation of key figures
                • Analysis of derived insights

                Data Validation

                • Triangulation with data models
                • Reference against proprietary databases
                • Corroboration with industry experts

                REPORT WRITING

                Qualitative

                • Market drivers
                • Market challenges
                • Market trends
                • Five forces analysis

                Quantitative

                • Market size and forecast
                • Market segmentation
                • Geographical insights
                • Competitive landscape

                Interested in this report?

                Get your sample now to see our research methodology and insights!

                Download Now

                Frequently Asked Questions

                Wearable Patch market growth will increase by $ 8589.2 mn during 2025-2029 .

                The Wearable Patch market is expected to grow at a CAGR of 14.1% during 2025-2029 .

                Wearable Patch market is segmented by Application( Clinical, Non-clinical) Technology( Regular, Connected, APAC, South America) End-user( Healthcare providers, Individual consumers, Fitness centers and sports organizations, Research institutions, North America)

                2M Engineering Ltd., Abbott Laboratories, Apple Inc., Beneli AB, Biofourmis Inc., DarioHealth Corp., Dassault Systemes SE, DuPont de Nemours Inc., Eoflow Co. Ltd., GENTAG Inc., greenTEG AG, Kenzen Inc., LifeSignals Group Inc., Nemaura Medical Inc., PKvitality S.A.S., Prevent Biometrics, Qualcomm Inc., Samsung Electronics Co. Ltd., The Surgical Co., VitalConnect Inc. are a few of the key vendors in the Wearable Patch market.

                North America will register the highest growth rate of 45% among the other regions. Therefore, the Wearable Patch market in North America is expected to garner significant business opportunities for the vendors during the forecast period.

                US, Germany, Canada, UK, China, France, Japan, Italy, India, Brazil

                • Growing prevalence of chronic diseasesThe growing prevalence of chronic diseases and generally incurable conditions is the driving factor this market.
                • such as cancer is the driving factor this market.
                • cardiovascular conditions is the driving factor this market.
                • diabetes is the driving factor this market.
                • and asthma is the driving factor this market.
                • is driving the demand for wearable patches. Wearable patches are gaining popularity as they are convenient for physicians and patients alike. A sedentary lifestyle negatively affects the homeostasis of the body is the driving factor this market.
                • making people susceptible to many disorders is the driving factor this market.
                • such as cardiovascular disease (CVDs) is the driving factor this market.
                • diabetes is the driving factor this market.
                • sleep apnea is the driving factor this market.
                • and other chronic illnesses. Treatment of all these diseases has become critical is the driving factor this market.
                • leading to hospitalization. Among chronic diseases is the driving factor this market.
                • CVD is the leading cause is the driving factor this market.
                • followed by chronic respiratory diseases and diabetes. In 2024 is the driving factor this market.
                • the global population aged 60 years or older is estimated to be 1.2 billion is the driving factor this market.
                • accounting for approximately 12% of the total world population. Furthermore is the driving factor this market.
                • according to the 2023 report of the National Center for Biotechnology Information (NCBI) is the driving factor this market.
                • it was recorded that sleep apnea affected over 936 million people worldwide. In addition is the driving factor this market.
                • the preterm births account for 3%-15% of overall childbirths. Every year is the driving factor this market.
                • around 15 million babies are born preterm is the driving factor this market.
                • of which more than one million infants die from premature birth complications. These diseases require wearable patches to monitor the severity of medical conditions of patients daily and maintain medical health records. Individuals are choosing wearable medical patches to monitor vital signs at regular intervals to avoid future complications related to various chronic conditions. Furthermore is the driving factor this market.
                • there has been an increase in the demand for wearable patches that could cut costs and avoid frequent consultations with physicians. Therefore is the driving factor this market.
                • the increasing population base with chronic conditions and an aging population will augment the demand for wearable patches and is the driving factor this market.
                • hence is the driving factor this market.
                • drive the growth of the market in focus during the forecast period. is the driving factor this market.

                The Wearable Patch market vendors should focus on grabbing business opportunities from the Clinical segment as it accounted for the largest market share in the base year.