
Whole Exome Sequencing Market Size 2025-2029
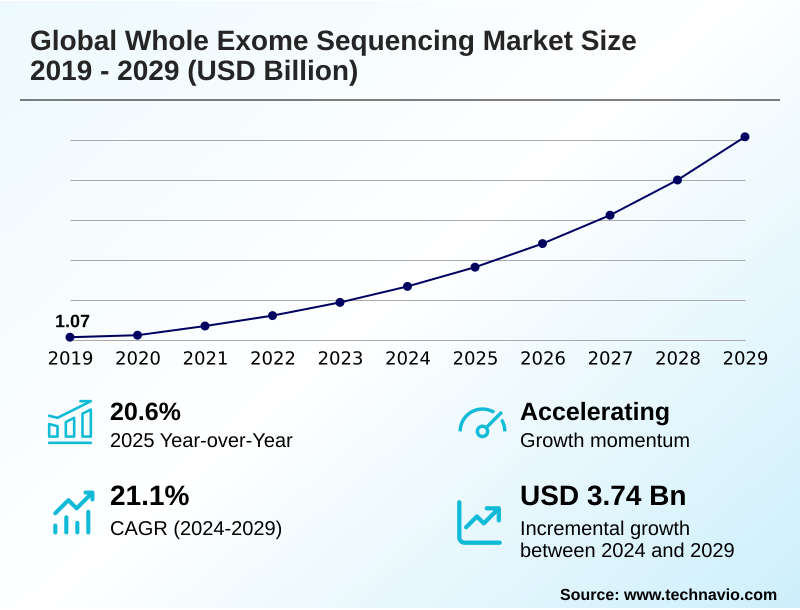
The whole exome sequencing market size is valued to increase by USD 3.74 billion, at a CAGR of 21.1% from 2024 to 2029. Technological advancements and precipitous decline in sequencing costs will drive the whole exome sequencing market.
Major Market Trends & Insights
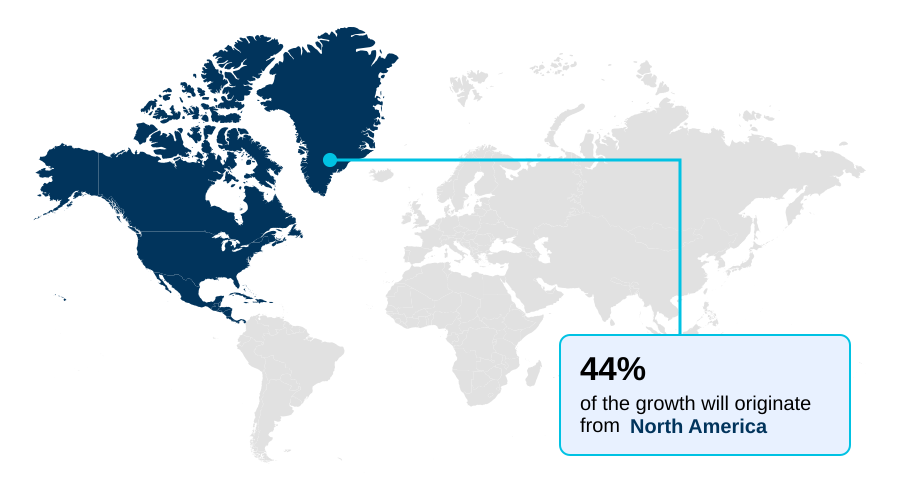
- North America dominated the market and accounted for a 44% growth during the forecast period.
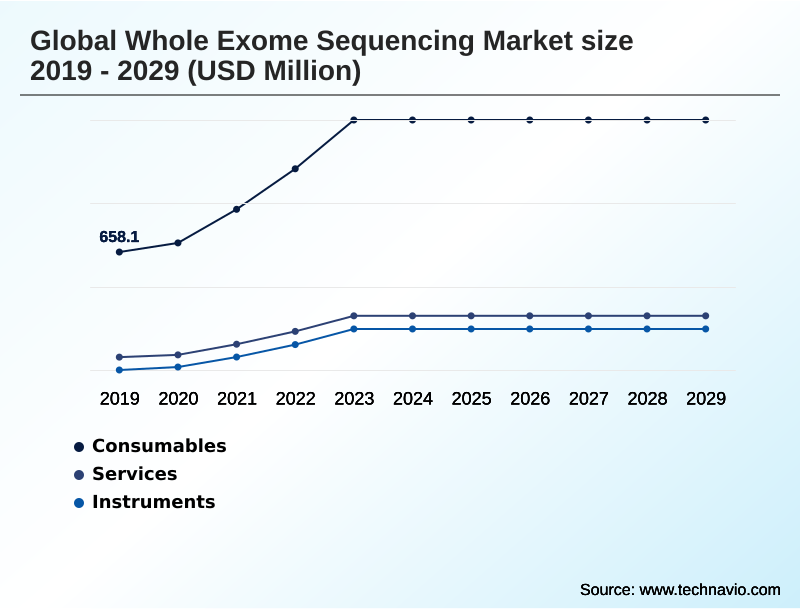
- By Product - Consumables segment was valued at USD 1.20 billion in 2023
- By Technology - Sequencing by synthesis segment accounted for the largest market revenue share in 2023
Market Size & Forecast
- Market Opportunities: USD 5.01 billion
- Market Future Opportunities: USD 3.74 billion
- CAGR from 2024 to 2029 : 21.1%
Market Summary
- The whole exome sequencing market is defined by its critical role in precision medicine, transitioning from a niche research tool to a cornerstone of clinical diagnostics. This shift is powered by technological progress that has dramatically reduced costs and improved the accuracy of next-generation sequencing platforms.
- Key applications in rare disease diagnosis and oncology are expanding, as the technique provides a cost-effective method for identifying disease-causing mutations within the exome. For instance, a clinical laboratory can now leverage a streamlined bioinformatics pipeline to analyze tens of thousands of variants from a patient, reducing the diagnostic odyssey for rare conditions from years to weeks.
- This operational efficiency is crucial. However, challenges in data interpretation, such as handling variants of uncertain significance, and navigating complex reimbursement landscapes continue to shape the industry's strategic direction.
- The development of robust clinico-genomic databases and the application of artificial intelligence are becoming essential for unlocking the full potential of exome data, driving further integration into standard healthcare pathways and fostering innovation in drug discovery and development, making it a pivotal area in the broader genomic medicine service landscape.
What will be the Size of the Whole Exome Sequencing Market during the forecast period?
Get Key Insights on Market Forecast (PDF) Get Free Sample
How is the Whole Exome Sequencing Market Segmented?
The whole exome sequencing industry research report provides comprehensive data (region-wise segment analysis), with forecasts and estimates in "USD million" for the period 2025-2029, as well as historical data from 2019-2023 for the following segments.
- Product
- Consumables
- Services
- Instruments
- Technology
- Sequencing by synthesis
- ION semiconductor sequencing
- Others
- Application
- Drug discovery and development
- Diagnostics
- Personalized medicine
- Prenatal and neonatal screening
- Others
- Geography
- North America
- US
- Canada
- Mexico
- Europe
- Germany
- UK
- France
- Asia
- Rest of World (ROW)
- North America
By Product Insights
The consumables segment is estimated to witness significant growth during the forecast period.
The consumables segment represents a vital and recurring revenue stream, encompassing all reagents and kits essential for the complete WES workflow. This includes materials for sample preparation and, critically, exome enrichment kits that utilize hybridization-based capture methods.
The quality of these components is paramount, as they directly influence performance metrics such as exome coverage uniformity and the ability to detect copy number variations. Demand is fueled by increasing WES procedure volumes for personalized medicine applications.
Advanced kits have demonstrated an ability to improve pathogenic variants classification in over 10% of cases unresolved by previous methods, highlighting the segment's focus on enhancing high-throughput sequencing workflows in a targeted gene panels comparison.
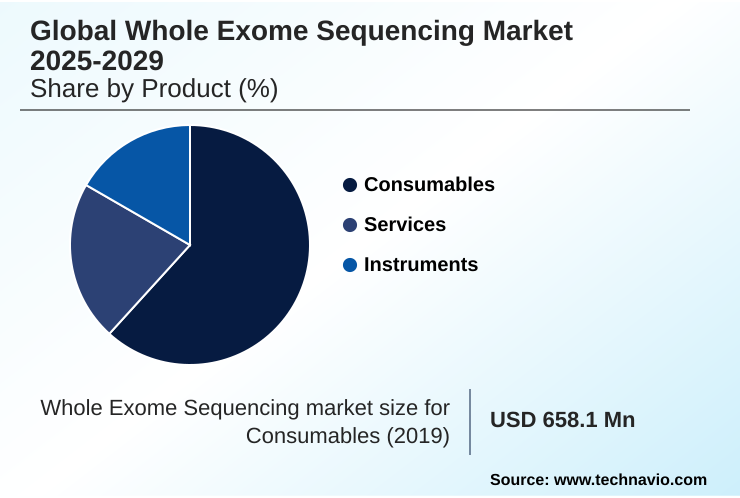
The Consumables segment was valued at USD 1.20 billion in 2023 and showed a gradual increase during the forecast period.
Regional Analysis
North America is estimated to contribute 44% to the growth of the global market during the forecast period.Technavio’s analysts have elaborately explained the regional trends and drivers that shape the market during the forecast period.
See How Whole Exome Sequencing Market Demand is Rising in North America Get Free Sample
North America leads the market, contributing over 44% of the incremental growth, driven by robust funding and advanced healthcare systems that extensively use WES for neonatal intensive care unit screening.
Europe is defined by national programs, with a focus on creating genomic data sharing frameworks. The Asia region, however, is the fastest-growing, with a CAGR of 22.5%, powered by ambitious government-led population health initiatives.
Technologies like ion semiconductor sequencing and nanopore sequencing are gaining traction globally, enabling broader applications.
The market is also seeing a demand for comprehensive sample-to-report solutions that address both technical and regulatory hurdles, a key factor in regions with developing infrastructure.
Market Dynamics
Our researchers analyzed the data with 2024 as the base year, along with the key drivers, trends, and challenges. A holistic analysis of drivers will help companies refine their marketing strategies to gain a competitive advantage.
- The strategic decision-making process for laboratories in the whole exome sequencing market is increasingly nuanced, weighing the trade-offs between different technological and analytical approaches.
- The debate over long-read versus short-read exome analysis is central, as long-read methods have demonstrated the ability to resolve complex cases and improve structural variant detection with wes, boosting the whole exome sequencing diagnostic yield by up to 15% in cohorts previously unresolved by short-read technologies. This capability is particularly critical for the wes for neonatal diagnostic odyssey.
- Concurrently, the industry is grappling with the challenge of interpreting variants of unknown significance, a task where ai for pathogenic variant classification is becoming indispensable. The choice of a bioinformatics pipeline for exome data directly impacts a lab's ability to offer competitive turnaround times.
- The application of wes in personalized cancer therapy and its role in pharmacogenomics depend heavily on accurate data analysis and interpretation. Furthermore, navigating reimbursement challenges for wes tests and ensuring ivdr compliance for genomic assays are significant operational hurdles.
- As wes application in drug discovery expands, so do concerns around data privacy in genomic databases, especially in population-scale exome sequencing initiatives. The push toward improving wes coverage uniformity remains a constant technical goal.
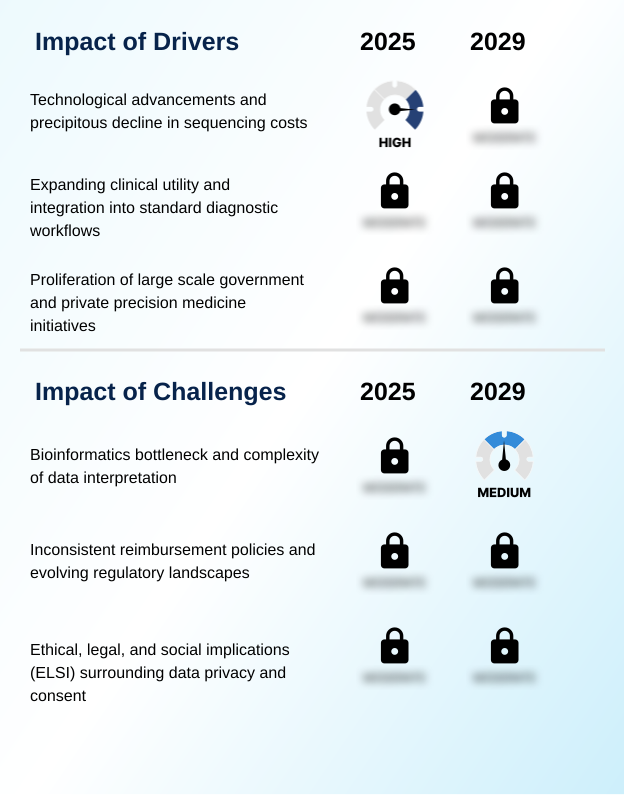
What are the key market drivers leading to the rise in the adoption of Whole Exome Sequencing Industry?
- Technological advancements in sequencing, coupled with a significant and continuous decline in associated costs, serve as the primary drivers fueling the market's global expansion and adoption.
- Market expansion is fundamentally driven by cost-effectiveness and expanding clinical validation, particularly for rare disease diagnostics. The success of large-scale sequencing projects, supported by a growing genomic data infrastructure, creates sustained demand for consumables and services.
- These initiatives, which often rely on sequencing by synthesis technology, are building extensive clinico-genomic databases that are vital for drug discovery and development.
- The validation of WES utility in areas like cancer genomics profiling is compelling healthcare systems to integrate it into standard care, spurred by clear acmg clinical guidelines.
- This integration is accelerating turnaround time optimization and making the technology a cornerstone of modern genomic medicine, especially for mendelian disorders analysis.
What are the market trends shaping the Whole Exome Sequencing Industry?
- The integration of artificial intelligence and machine learning is a pivotal market trend, poised to accelerate the complex process of genetic variant interpretation. This advancement directly addresses critical data analysis bottlenecks, thereby enhancing diagnostic speed and accuracy.
- A pivotal trend is the proliferation of long-read sequencing, which is proving superior for structural variants detection, an area where short-read sequencing has limitations. This has led to a diagnostic yield improvement of nearly 15% in complex neurological cases. Concurrently, the integration of ai in variant classification is revolutionizing the workflow, automating the analysis of data from next-generation sequencing platforms.
- This move is crucial for personalized medicine applications and is helping to resolve a greater number of variants of uncertain significance. These advancements are solidifying WES's role in population health initiatives and pharmacogenomics testing, shifting it from a specialized tool to a mainstream clinical powerhouse that is increasingly seen as a viable whole genome sequencing alternative for many applications.
What challenges does the Whole Exome Sequencing Industry face during its growth?
- A primary challenge constraining market growth is the bioinformatics bottleneck, characterized by the inherent complexity of interpreting vast genomic datasets and a shortage of specialized expertise.
- A formidable challenge remains the bioinformatics pipeline needed for complex variant interpretation and variant calling and annotation. The sheer volume of data, containing tens of thousands of single nucleotide variants per individual, creates a significant bottleneck.
- This is compounded by inconsistent policies for reimbursement for genomic testing and the stringent requirements of the in vitro diagnostic regulation in Europe, which adds significant compliance overhead. Furthermore, managing ethical legal social implications, particularly around data privacy and consent for germline and somatic mutations, is a critical hurdle.
- Laboratories must also adhere to standards like the clinical laboratory improvement amendments, adding another layer of operational complexity.
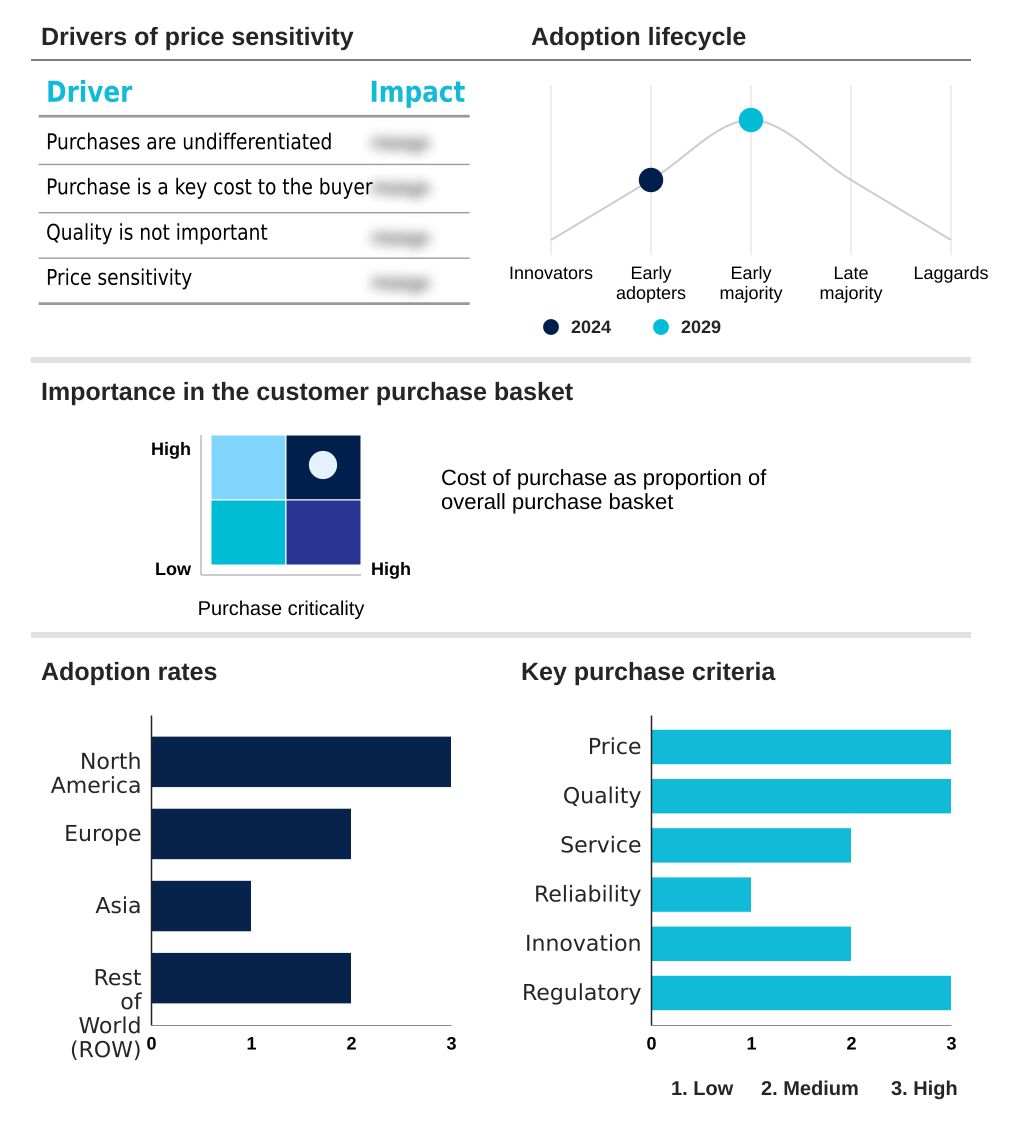
Exclusive Technavio Analysis on Customer Landscape
The whole exome sequencing market forecasting report includes the adoption lifecycle of the market, covering from the innovator’s stage to the laggard’s stage. It focuses on adoption rates in different regions based on penetration. Furthermore, the whole exome sequencing market report also includes key purchase criteria and drivers of price sensitivity to help companies evaluate and develop their market growth analysis strategies.
Customer Landscape of Whole Exome Sequencing Industry
Competitive Landscape
Companies are implementing various strategies, such as strategic alliances, whole exome sequencing market forecast, partnerships, mergers and acquisitions, geographical expansion, and product/service launches, to enhance their presence in the industry.
Agilent Technologies Inc. - Provides advanced target enrichment solutions, pivotal for pre-sequencing exome capture, enhancing data accuracy and research outcomes.
The industry research and growth report includes detailed analyses of the competitive landscape of the market and information about key companies, including:
- Agilent Technologies Inc.
- Ambry Genetics
- Azenta US Inc.
- BGI Genomics Co. Ltd.
- Bio Rad Laboratories Inc.
- CD Genomics
- Eurofins Scientific SE
- F. Hoffmann La Roche Ltd.
- GeneDx LLC
- Illumina Inc.
- Laboratory Corp.
- Macrogen Inc.
- Novogene Co. Ltd.
- Oxford Nanopore Technologies plc
- Pacific Biosciences of California Inc.
- PerkinElmer US LLC
- ProPhase Labs, Inc.
- Psomagen Inc.
- QIAGEN N.V.
- Thermo Fisher Scientific Inc.
Qualitative and quantitative analysis of companies has been conducted to help clients understand the wider business environment as well as the strengths and weaknesses of key industry players. Data is qualitatively analyzed to categorize companies as pure play, category-focused, industry-focused, and diversified; it is quantitatively analyzed to categorize companies as dominant, leading, strong, tentative, and weak.
Recent Development and News in Whole exome sequencing market
- In August, 2024, a leading long-read technology company launched a new kit optimized for high-throughput targeted sequencing, including exomes, significantly lowering the per-sample cost and making the technology more accessible.
- In November, 2024, the 1+ Million Genomes initiative officially launched the Genomic Data Infrastructure project, aiming to create a federated network for secure, cross-border access to genomic data across Europe.
- In February, 2025, the US National Institutes of Health All of Us Research Program announced a massive data release that included nearly 250,000 whole genome sequences, enhancing reference databases for clinical exome interpretation.
- In April, 2025, Rady Childrens Institute for Genomic Medicine announced a strategic partnership to significantly broaden access to its rapid genomic sequencing services for critically ill newborns in neonatal intensive care units.
Dive into Technavio’s robust research methodology, blending expert interviews, extensive data synthesis, and validated models for unparalleled Whole Exome Sequencing Market insights. See full methodology.
| Market Scope | |
|---|---|
| Page number | 297 |
| Base year | 2024 |
| Historic period | 2019-2023 |
| Forecast period | 2025-2029 |
| Growth momentum & CAGR | Accelerate at a CAGR of 21.1% |
| Market growth 2025-2029 | USD 3742.8 million |
| Market structure | Fragmented |
| YoY growth 2024-2025(%) | 20.6% |
| Key countries | US, Canada, Mexico, Germany, UK, France, Italy, The Netherlands, Spain, Russia, China, Japan, India, South Korea, Indonesia, Thailand, Singapore, Australia, Brazil, UAE, South Africa, Saudi Arabia and Turkey |
| Competitive landscape | Leading Companies, Market Positioning of Companies, Competitive Strategies, and Industry Risks |
Research Analyst Overview
- The whole exome sequencing market is undergoing a significant strategic evolution, moving beyond raw sequencing speed to focus on the speed and accuracy of variant interpretation. This shift is forcing boardroom-level decisions on investment in advanced bioinformatics pipelines and AI-driven analytical tools.
- The integration of long-read sequencing technologies, such as single-molecule real-time sequencing and nanopore sequencing, alongside dominant short-read sequencing platforms, is creating a more stratified service offering. These platforms, supported by sophisticated exome enrichment kits using hybridization-based capture, are crucial for both germline and somatic mutations analysis.
- Achieving turnaround time optimization, reducing it from weeks to days, has become a key competitive differentiator. The ability to manage and interpret data, including single nucleotide variants and complex copy number variations, is paramount.
- Success now hinges on navigating complex regulations like the in vitro diagnostic regulation and the clinical laboratory improvement amendments, while also improving diagnostic yield improvement for both pathogenic variants classification and variants of uncertain significance. This necessitates building robust clinico-genomic databases and a supporting genomic data infrastructure.
What are the Key Data Covered in this Whole Exome Sequencing Market Research and Growth Report?
-
What is the expected growth of the Whole Exome Sequencing Market between 2025 and 2029?
-
USD 3.74 billion, at a CAGR of 21.1%
-
-
What segmentation does the market report cover?
-
The report is segmented by Product (Consumables, Services, and Instruments), Technology (Sequencing by synthesis, ION semiconductor sequencing, and Others), Application (Drug discovery and development, Diagnostics, Personalized medicine, Prenatal and neonatal screening, and Others) and Geography (North America, Europe, Asia, Rest of World (ROW))
-
-
Which regions are analyzed in the report?
-
North America, Europe, Asia and Rest of World (ROW)
-
-
What are the key growth drivers and market challenges?
-
Technological advancements and precipitous decline in sequencing costs, Bioinformatics bottleneck and complexity of data interpretation
-
-
Who are the major players in the Whole Exome Sequencing Market?
-
Agilent Technologies Inc., Ambry Genetics, Azenta US Inc., BGI Genomics Co. Ltd., Bio Rad Laboratories Inc., CD Genomics, Eurofins Scientific SE, F. Hoffmann La Roche Ltd., GeneDx LLC, Illumina Inc., Laboratory Corp., Macrogen Inc., Novogene Co. Ltd., Oxford Nanopore Technologies plc, Pacific Biosciences of California Inc., PerkinElmer US LLC, ProPhase Labs, Inc., Psomagen Inc., QIAGEN N.V. and Thermo Fisher Scientific Inc.
-
Market Research Insights
- The market's momentum is shaped by the expanding clinical utility of whole exome sequencing, which now delivers a diagnostic yield up to 30% higher than traditional methods for certain rare diseases. This increased efficacy drives adoption in neonatal intensive care unit screening and cancer genomics profiling.
- The push for sample-to-report solutions is a direct response to the need for streamlined high-throughput sequencing workflows, reducing turnaround times by over 50% in some acute care settings. While the technology's cost-effectiveness remains a key factor, navigating reimbursement for genomic testing and evolving regulatory compliance under frameworks like IVDR are critical operational considerations.
- These dynamics are accelerating the move toward precision medicine applications, making exome analysis a foundational tool.
We can help! Our analysts can customize this whole exome sequencing market research report to meet your requirements.
 RIA -
RIA - 
