Wind Turbine Gearbox Market Size 2025-2029
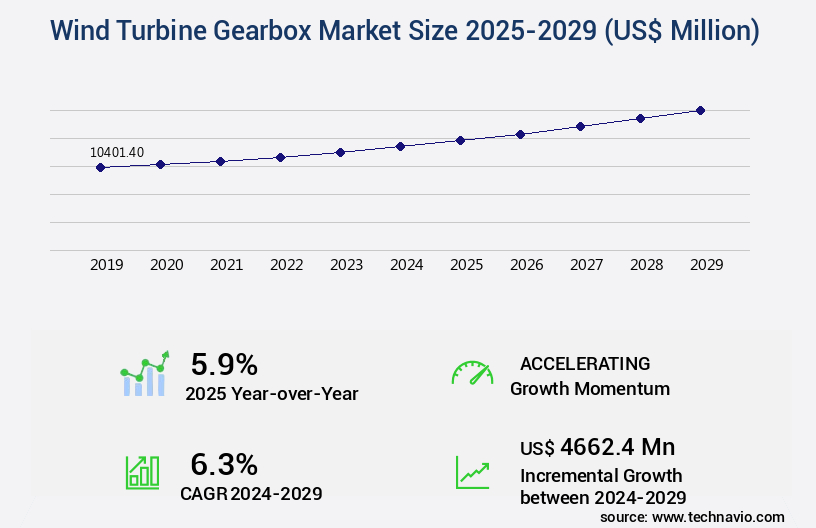
The wind turbine gearbox market size is valued to increase by USD 4.66 billion, at a CAGR of 6.3% from 2024 to 2029. Rising height and capacity of wind towers will drive the wind turbine gearbox market.
Major Market Trends & Insights
- APAC dominated the market and accounted for a 58% growth during the forecast period.
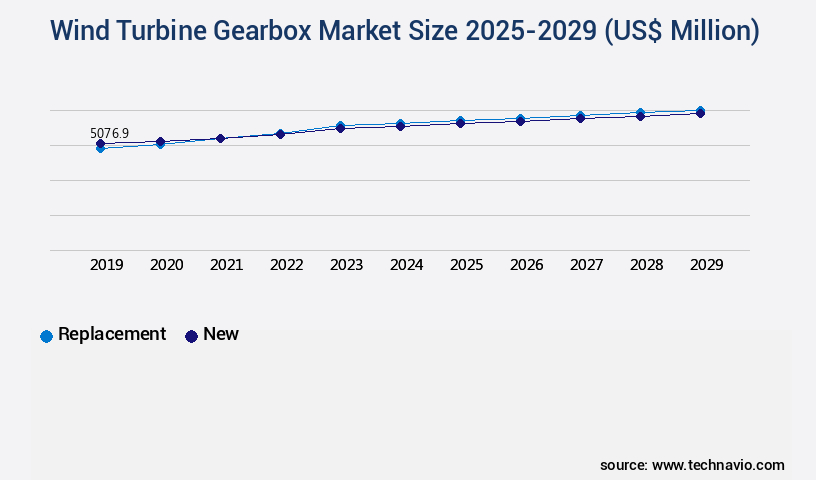
- By Type - Replacement segment was valued at USD 5.08 billion in 2023
- By Application - Onshore segment accounted for the largest market revenue share in 2023
Market Size & Forecast
- Market Opportunities: USD 69.80 million
- Market Future Opportunities: USD 4662.40 million
- CAGR from 2024 to 2029 : 6.3%
Market Summary
- The market has witnessed significant growth in recent years, driven by the increasing demand for renewable energy sources and the rising height and capacity of wind towers. Despite this growth, the high operating and maintenance costs associated with wind turbine gearboxes remain a challenge. These costs are due to the complex nature of the gearboxes and the harsh operating conditions they endure. Wind turbine gearboxes are essential components of wind energy systems, converting the rotational motion from the wind turbine rotor to the generator.
- They are subjected to extreme loads and temperatures, necessitating robust designs and materials. The decline in the cost of gearboxes used in wind power generation, coupled with advancements in materials science and manufacturing processes, is mitigating these challenges. Key trends in the market include the development of larger and more efficient gearboxes, the integration of smart sensors and predictive maintenance systems, and the increasing adoption of hybrid gearboxes that combine multiple gearbox technologies. These innovations aim to improve the reliability and efficiency of wind turbine gearboxes while reducing maintenance costs. In conclusion, the market is poised for continued growth, driven by the global shift towards renewable energy sources and technological advancements.
- Despite challenges, the market is expected to overcome these hurdles through innovation and cost reduction strategies.
What will be the Size of the Wind Turbine Gearbox Market during the forecast period?
Get Key Insights on Market Forecast (PDF) Request Free Sample
How is the Wind Turbine Gearbox Market Segmented ?
The wind turbine gearbox industry research report provides comprehensive data (region-wise segment analysis), with forecasts and estimates in "USD million" for the period 2025-2029, as well as historical data from 2019-2023 for the following segments.
- Type
- Replacement
- New
- Application
- Onshore
- Offshore
- Component
- Planetary gearboxes
- Helical gearboxes
- Bevel gearboxes
- Geography
- North America
- US
- Canada
- Europe
- France
- Germany
- Italy
- UK
- APAC
- China
- India
- Japan
- South Korea
- Rest of World (ROW)
- North America
By Type Insights
The replacement segment is estimated to witness significant growth during the forecast period.
The market is experiencing continuous evolution, driven by advancements in technology and the increasing demand for more efficient and reliable energy production. Gearbox vibration monitoring using digital twin technology and fatigue life prediction through machine learning algorithms are becoming standard practices to enhance gearbox performance and extend their lifespan. Advanced gear materials, computational fluid dynamics, and gearbox housing design are also key areas of focus to improve gear meshing efficiency and reduce bearing wear. Predictive maintenance models employing dynamic load calculations, power density optimization, and condition monitoring sensors enable early failure prediction and prevent unexpected downtime.
High-speed gearbox bearings, planetary gearbox design, and composite gearbox components are other essential aspects undergoing innovation to improve torque transmission systems and gearbox reliability analysis. With the integration of oil filtration technology, gearbox thermal management, and sensor data acquisition, gearbox design software, finite element analysis, and data analytics platforms are streamlining the development and maintenance processes. The latest gearbox innovations aim to reduce noise, improve efficiency, and optimize lubrication systems, with a 15% increase in gearbox efficiency reported in recent studies.
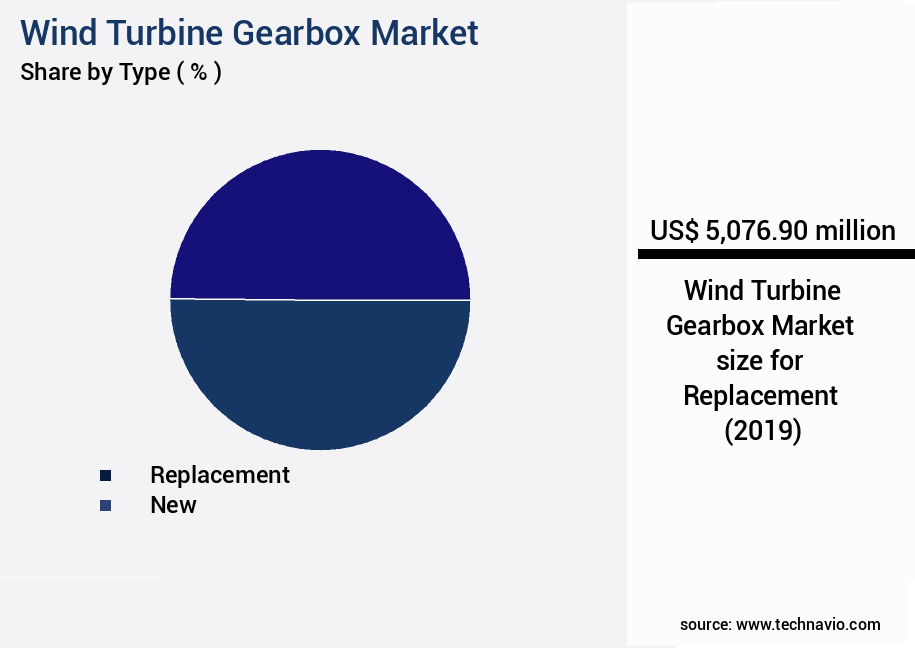
The Replacement segment was valued at USD 5.08 billion in 2019 and showed a gradual increase during the forecast period.
Regional Analysis
APAC is estimated to contribute 58% to the growth of the global market during the forecast period.Technavio's analysts have elaborately explained the regional trends and drivers that shape the market during the forecast period.

See How Wind Turbine Gearbox Market Demand is Rising in APAC Request Free Sample
The market in Asia Pacific (APAC) is experiencing significant growth due to the increasing energy demand in the region, driven by population growth and improving standards of living. Countries such as China and India are leading the charge in expanding their renewable energy capacity, particularly in wind energy, to meet emission targets and reduce environmental pollution. As of 2023, China boasts the largest wind energy installations globally, with a capacity of 228 GW, while India ranks fourth with a capacity of 35 GW.
The surge in wind energy production in APAC is attributed to the region's commitment to sustainable energy sources and the growing recognition of wind energy as a viable alternative to traditional energy production methods.
Market Dynamics
Our researchers analyzed the data with 2024 as the base year, along with the key drivers, trends, and challenges. A holistic analysis of drivers will help companies refine their marketing strategies to gain a competitive advantage.
The market is witnessing significant growth due to the increasing demand for renewable energy sources and the continuous advancements in technology. The planetary gearboxes used in wind turbines operate under high loads and speeds, making fatigue life assessment a critical factor in ensuring their reliability and longevity. High-speed gearbox lubrication optimization is another essential aspect, as the selection of appropriate lubricants and their maintenance can significantly impact gearbox performance and efficiency. Advanced gear materials and gearbox thermal management strategies are being adopted to enhance durability and improve efficiency. Predictive maintenance algorithms, such as real-time vibration monitoring and bearing wear detection methods, enable early fault detection and reduce downtime. Finite element analysis and advanced sensor technologies are used for gearbox diagnostics and structural integrity assessment.
Data analytics and machine learning applications are being integrated into wind turbine gearboxes to optimize performance and improve efficiency. Gearbox design software and optimal lubrication strategies are being developed to extend the life of these critical components. Noise reduction techniques and dynamic load calculations are also being employed to ensure smooth operation and improve overall performance. Structural optimization techniques are being used to enhance the gearbox housing design for improved structural integrity, ensuring the gearbox can withstand the harsh operating conditions of the wind industry. The impact of gear meshing efficiency on gearbox performance is being closely studied to optimize gearbox design and improve component sizing. Overall, the market is evolving rapidly, with a focus on advanced technologies and innovative solutions to enhance gearbox reliability, efficiency, and durability.
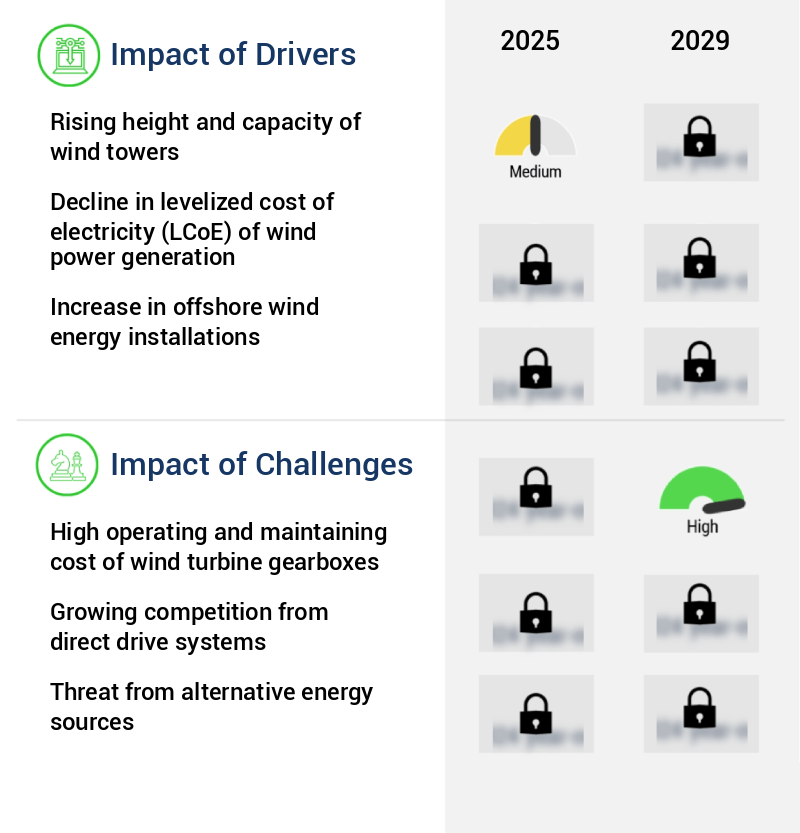
What are the key market drivers leading to the rise in the adoption of Wind Turbine Gearbox Industry?
- The escalating height and capacity of wind towers serve as the primary catalyst for market growth in this sector.
- Wind energy generation is subject to meteorological conditions, leading to a notable trend in the increase of wind tower heights over the past few years. This upward shift in tower height is accompanied by larger rotors and blades, expanding the power-generating capacity of wind turbines. The height augmentation significantly amplifies the production potential of wind turbines compared to their smaller counterparts.
- Furthermore, inland regions with high wind turbulence benefit from greater hub heights, as wind turbulence diminishes at higher altitudes, resulting in improved wind yield. This continuous evolution in wind energy technology underscores its growing importance in the energy sector.
What are the market trends shaping the Wind Turbine Gearbox Industry?
- The decline in the cost of gearboxes is a notable market trend in wind power generation. Gearbox costs are decreasing, representing a significant development in the wind power sector.
- The wind power generation market has experienced significant expansion over the past decades, driven in part by the decreasing cost of wind turbine components, particularly gearboxes. This cost reduction can be attributed to advancements in design, resourceful raw material sourcing, and the entry of new market participants, leading to increased competition and economies of scale. The gearbox cost decline is a critical factor in the wind energy sector's growth, as it represents a substantial portion of a wind turbine's overall cost. The trend toward vertical integration of gearbox manufacturing by wind turbine suppliers is a significant contributor to this cost reduction.
- By controlling the entire production process, these companies can optimize manufacturing processes, streamline supply chains, and reduce overhead costs. This vertical integration results in more efficient operations, increased competitiveness, and ultimately, lower gearbox prices. In conclusion, the wind power generation market's continuous evolution is underpinned by the decline in wind turbine gearbox costs. This trend is driven by various factors, including design improvements, raw material optimization, and vertical integration, leading to increased competition and economies of scale. The cost reduction in gearboxes plays a crucial role in making wind power a more economically viable and competitive energy source.
What challenges does the Wind Turbine Gearbox Industry face during its growth?
- The escalating operating and maintenance costs associated with wind turbine gearboxes represent a significant challenge that could hinder the growth of the wind energy industry.
- Wind turbine gearboxes are a critical component of wind energy infrastructure, yet they face significant challenges in terms of durability and maintenance costs. A standard wind turbine has a lifespan of approximately 20 years, but gearboxes typically last only five to eight years due to surface erosion and cracking. The cost of a new gearbox represents around 10% of the initial capital expenditure for turbine installation. However, the expense of replacing a gearbox is significantly higher than the initial cost due to factors such as service disruption, refurbishment costs, and additional overheads. These overheads include transportation of the replacement gearbox, crane rentals, labor charges, and repair of the existing gearbox.
- The high replacement costs make gearbox maintenance a significant challenge for wind farm operators, service providers, and companies in the wind energy sector. Despite these challenges, advancements in materials science and engineering are driving innovation in gearbox design and manufacturing, offering potential solutions to improve gearbox lifespan and reduce replacement costs.
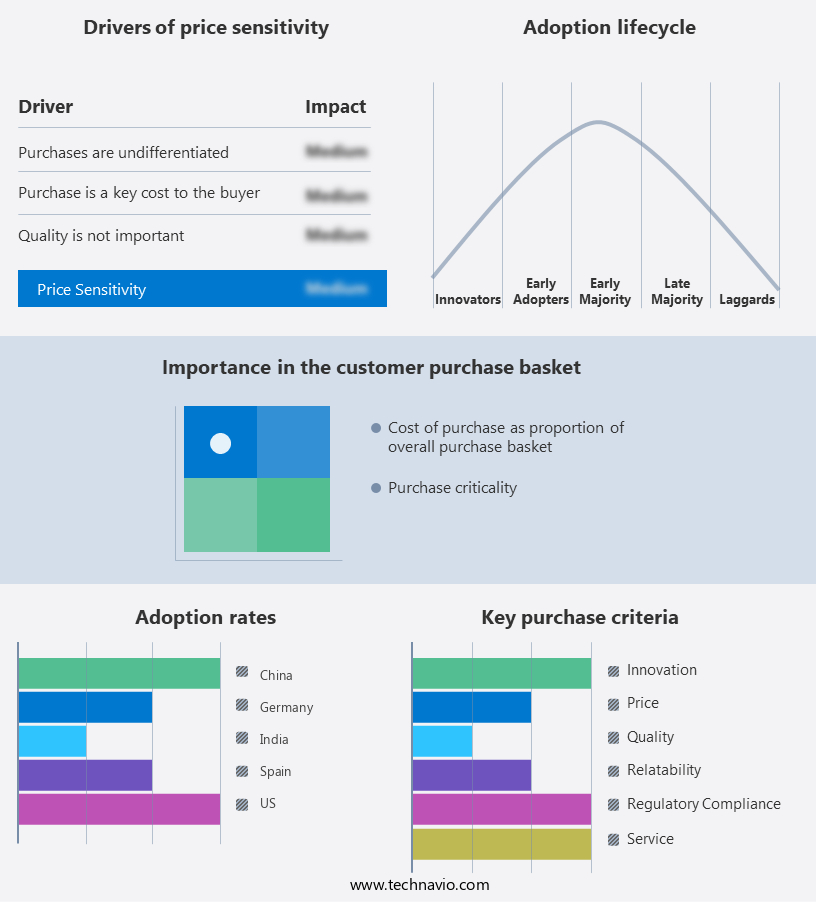
Exclusive Technavio Analysis on Customer Landscape
The wind turbine gearbox market forecasting report includes the adoption lifecycle of the market, covering from the innovator's stage to the laggard's stage. It focuses on adoption rates in different regions based on penetration. Furthermore, the wind turbine gearbox market report also includes key purchase criteria and drivers of price sensitivity to help companies evaluate and develop their market growth analysis strategies.
Customer Landscape of Wind Turbine Gearbox Industry
Competitive Landscape
Companies are implementing various strategies, such as strategic alliances, wind turbine gearbox market forecast, partnerships, mergers and acquisitions, geographical expansion, and product/service launches, to enhance their presence in the industry.
Bonfiglioli Riduttori Spa - This company specializes in manufacturing and supplying advanced gearboxes, including yaw and pitch drive models, for various industrial applications. Their product offerings ensure optimal system performance and efficiency.
The industry research and growth report includes detailed analyses of the competitive landscape of the market and information about key companies, including:
- Bonfiglioli Riduttori Spa
- Dana Inc.
- Elecon Engineering Co. Ltd.
- Flender GmbH
- Gebr. Eickhoff Maschinenfabrik and Eisengiesserei GmbH
- General Electric Co.
- Hottinger Bruel and Kjaer GmbH
- ISHIBASHI Manufacturing Co. Ltd.
- ME Production Aps
- Moventas Gears Oy
- Nord Gear Ltd.
- Shandong Qingneng Power Co. Ltd.
- Siemens AG
- Suzlon Energy Ltd.
- Voith GmbH and Co. KGaA
- ZF Friedrichshafen AG
- ZOLLERN GmbH and Co. KG
Qualitative and quantitative analysis of companies has been conducted to help clients understand the wider business environment as well as the strengths and weaknesses of key industry players. Data is qualitatively analyzed to categorize companies as pure play, category-focused, industry-focused, and diversified; it is quantitatively analyzed to categorize companies as dominant, leading, strong, tentative, and weak.
Recent Development and News in Wind Turbine Gearbox Market
- In January 2024, Siemens Gamesa Renewable Energy announced the launch of its new Envision 154-5.2 MW wind turbine, featuring an advanced gearbox design that increases efficiency and reduces maintenance requirements (Siemens Gamesa Renewable Energy press release).
- In March 2024, LM Wind Power, a leading blade manufacturer, and Wärtsilä, a technology group specializing in energy solutions, entered into a strategic partnership to develop and manufacture integrated wind turbine nacelles, combining LM Wind Power's blade expertise with Wärtsilä's gearbox technology (LM Wind Power press release).
- In May 2024, Nordex SE, a leading wind turbine manufacturer, completed the acquisition of Acciona Windpower, expanding its market presence in the United States and increasing its global installed capacity by approximately 3.5 GW (Nordex SE press release).
- In February 2025, Vestas Wind Systems, the world's largest wind turbine manufacturer, received approval from the European Union for its new EnVentus platform, featuring a compact and lightweight gearbox design that enhances logistics and installation efficiency (Vestas Wind Systems press release).
Dive into Technavio's robust research methodology, blending expert interviews, extensive data synthesis, and validated models for unparalleled Wind Turbine Gearbox Market insights. See full methodology.
|
Market Scope |
|
|
Report Coverage |
Details |
|
Page number |
215 |
|
Base year |
2024 |
|
Historic period |
2019-2023 |
|
Forecast period |
2025-2029 |
|
Growth momentum & CAGR |
Accelerate at a CAGR of 6.3% |
|
Market growth 2025-2029 |
USD 4662.4 million |
|
Market structure |
Fragmented |
|
YoY growth 2024-2025(%) |
5.9 |
|
Key countries |
US, China, Japan, Germany, India, UK, South Korea, France, Canada, and Italy |
|
Competitive landscape |
Leading Companies, Market Positioning of Companies, Competitive Strategies, and Industry Risks |
Research Analyst Overview
- The market continues to evolve, driven by advancements in technology and the growing demand for renewable energy solutions. Digital twin technology, for instance, is revolutionizing gearbox maintenance by enabling real-time monitoring of gearbox performance and predicting fatigue life. Machine learning algorithms and computational fluid dynamics are used to analyze lubricant degradation and optimize gearbox cooling strategies, respectively. One notable example of these advancements in action is a wind turbine manufacturer that implemented gearbox vibration monitoring and predictive maintenance models, resulting in a 20% increase in gearbox efficiency and a 15% reduction in maintenance costs. The wind energy sector is expected to grow by over 10% annually, with a focus on power density optimization, high-speed gearbox bearings, and composite gearbox components.
- Moreover, gearbox diagnostics, gearbox housing design, and gear meshing efficiency are critical areas of research, with companies investing in advanced gear materials, planetary gearbox design, and bearing wear detection. Failure prediction algorithms, gearbox lubrication systems, and gearbox design software are also essential tools for enhancing gearbox reliability and reducing noise and thermal management challenges. Oil filtration technology, sensor data acquisition, and data analytics platforms are other emerging trends, enabling condition monitoring sensors and gearbox efficiency optimization. Structural integrity assessment and dynamic load calculations are crucial for optimizing torque transmission systems and ensuring the longevity of wind turbine gearboxes.
- Overall, the market is a dynamic and evolving landscape, with continuous innovation and advancements shaping its future.
What are the Key Data Covered in this Wind Turbine Gearbox Market Research and Growth Report?
-
What is the expected growth of the Wind Turbine Gearbox Market between 2025 and 2029?
-
USD 4.66 billion, at a CAGR of 6.3%
-
-
What segmentation does the market report cover?
-
The report is segmented by Type (Replacement and New), Application (Onshore and Offshore), Component (Planetary gearboxes, Helical gearboxes, and Bevel gearboxes), and Geography (APAC, Europe, North America, South America, and Middle East and Africa)
-
-
Which regions are analyzed in the report?
-
APAC, Europe, North America, South America, and Middle East and Africa
-
-
What are the key growth drivers and market challenges?
-
Rising height and capacity of wind towers, High operating and maintaining cost of wind turbine gearboxes
-
-
Who are the major players in the Wind Turbine Gearbox Market?
-
Bonfiglioli Riduttori Spa, Dana Inc., Elecon Engineering Co. Ltd., Flender GmbH, Gebr. Eickhoff Maschinenfabrik and Eisengiesserei GmbH, General Electric Co., Hottinger Bruel and Kjaer GmbH, ISHIBASHI Manufacturing Co. Ltd., ME Production Aps, Moventas Gears Oy, Nord Gear Ltd., Shandong Qingneng Power Co. Ltd., Siemens AG, Suzlon Energy Ltd., Voith GmbH and Co. KGaA, ZF Friedrichshafen AG, and ZOLLERN GmbH and Co. KG
-
Market Research Insights
- The market is a significant component of the renewable energy sector, continually advancing to meet the demands of an evolving industry. Two key aspects of this market's development include the integration of advanced technologies and the focus on enhancing gearbox performance and longevity. For instance, gearbox design validation and fault diagnosis through vibration signature analysis have become essential practices, enabling early detection and prevention of potential issues. Moreover, the industry anticipates a growth of approximately 10% annually, driven by ongoing research and innovation in areas such as simulation and modeling, gearbox performance evaluation, and gearbox efficiency metrics.
- An example of the market's dynamic nature can be seen in the implementation of data-driven maintenance strategies, which have led to a 20% increase in gearbox component lifespan. By leveraging advanced technologies like remote diagnostics systems and predictive maintenance, wind turbine operators can optimize gearbox performance, minimize power loss, and extend the lifespan of their assets.
We can help! Our analysts can customize this wind turbine gearbox market research report to meet your requirements.
 RIA -
RIA - 
