
Workforce Upskilling Analytics Market Size and Growth Forecast 2026-2030
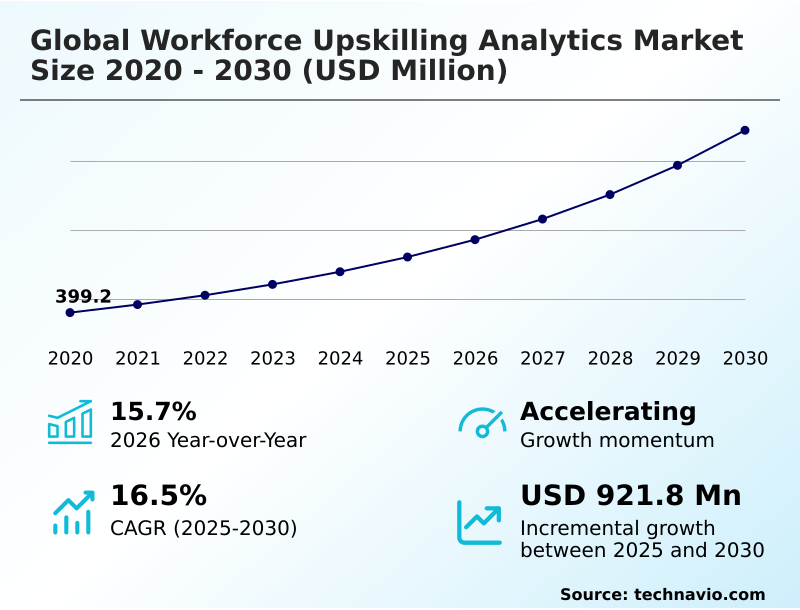
The Workforce Upskilling Analytics Market size was valued at USD 803.4 million in 2025 growing at a CAGR of 16.5% during the forecast period 2026-2030.
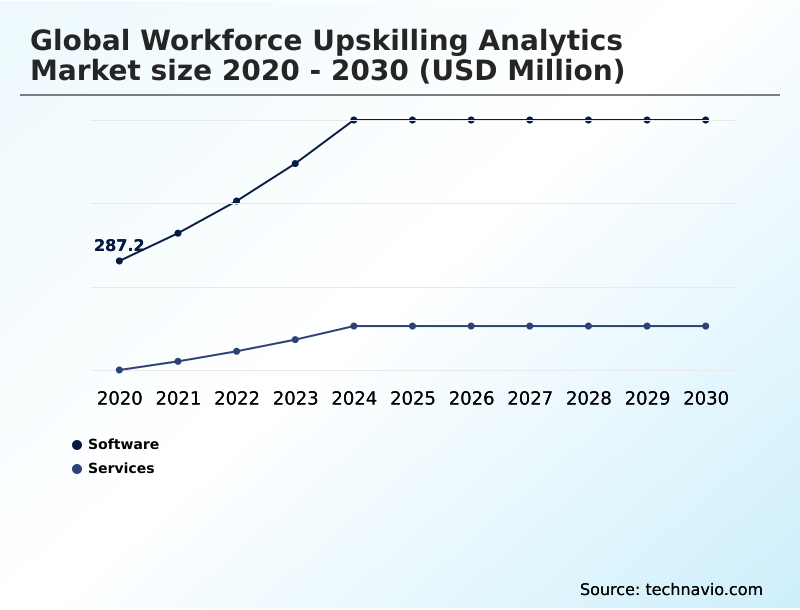
North America accounts for 44.2% of incremental growth during the forecast period. The Software segment by Component was valued at USD 513.7 million in 2024, while the Cloud based segment holds the largest revenue share by Deployment.
The market is projected to grow by USD 1.33 billion from 2020 to 2030, with USD 921.8 million of the growth expected during the forecast period of 2025 to 2030.
Get Key Insights on Market Forecast (PDF) Request Free Sample
Workforce Upskilling Analytics Market Overview
The workforce upskilling analytics market is defined by a strategic shift toward data-driven talent management, with North America contributing over 44% of incremental growth. Organizations are leveraging these platforms for comprehensive competency management framework development, moving beyond traditional reviews. This involves the application of predictive modeling to forecast future talent needs and the use of skills graph technology to map existing capabilities. For instance, a large financial services firm, facing disruption from fintech, might deploy a platform for skills-based organizational architecture. This system would use talent mobility analytics to identify employees in legacy roles with adjacent skills suitable for retraining in areas like blockchain or data science. By implementing personalized learning paths, the firm can achieve a verifiable increase in digital transformation readiness, supporting its long-term strategic workforce planning and improving talent retention metrics. The focus remains on building workforce agility and ensuring continuous professional development.
Drivers, Trends, and Challenges in the Workforce Upskilling Analytics Market
Strategic adoption of workforce upskilling analytics is increasingly central to navigating complex industrial transformations. One of the primary use cases involves using generative AI for dynamic learning paths, allowing organizations to move away from static training modules. However, the success of such initiatives hinges on integrating skills data with legacy HRIS, a persistent technical challenge.
As firms aim for a skills-based internal talent marketplace, the ability to accurately measure the ROI of upskilling programs analytics becomes a critical justification for investment. This is where predictive analytics for future skill requirements provides significant value, enabling proactive talent development.
For example, a major aerospace manufacturer, in compliance with stringent FAA and EASA training mandates, could use analytics to model the skills needed for maintaining next-generation composite airframes five years out, initiating reskilling programs for its current mechanics long before a skills deficit impacts production.
This proactive stance contrasts sharply with historical approaches, where training often lagged operational needs, a difference that is now quantifiable. The data-driven approach allows for a more than 30% improvement in matching internal talent to critical projects compared to traditional methods.
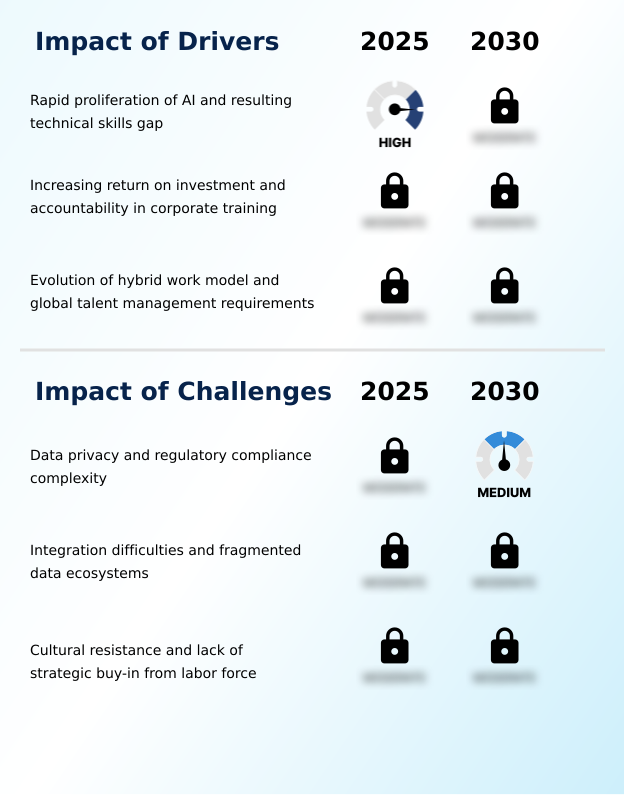
Primary Growth Driver: The rapid proliferation of AI, which creates a significant technical skills gap, is a key driver for the market's growth.
The market's expansion is heavily driven by the urgent need to address the technical skills gap created by rapid technological advancements, particularly in AI.
Organizations are under pressure to demonstrate a clear return on investment (ROI) measurement for training expenditures, compelling them to adopt platforms that offer robust learning impact analytics and automated skills mapping.
The rise of remote and hybrid work further necessitates digital tools for decentralized team management, making human capital management integration a critical factor.
Platforms that provide cross-platform data integration enable leaders to monitor employee progress regardless of location, supporting a cohesive talent retention strategy.
This focus on measurable outcomes and workforce agility ensures that training investments directly contribute to business performance and digital transformation readiness.
Emerging Market Trend: The proliferation of generative AI represents a notable trend, enabling the creation of hyper-personalized educational pathways for workforce development.
Key trends are reshaping how organizations manage human capital, with a significant shift toward a skills-based organizational architecture. This approach utilizes a detailed skills taxonomy and a sophisticated learning recommendations engine to create internal talent marketplaces. Fueling this evolution is the integration of generative AI assistants, which deliver hyper-personalized learning paths tailored to individual employee needs.
With a year-over-year market growth rate of over 15%, companies are investing in these platforms for detailed talent mobility analytics and strategic workforce planning. This data-centric model enables a more agile and responsive approach to talent development, ensuring that the workforce is continuously aligned with strategic business objectives and can adapt to rapid technological changes through effective competency management framework.
Key Industry Challenge: The complexity of data privacy and regulatory compliance presents a key challenge affecting the industry's growth.
Significant challenges persist, primarily concerning data privacy and regulatory complexity, with frameworks like the General Data Protection Regulation (GDPR) setting a high bar for compliance. The requirement for algorithmic fairness in HR and human-in-the-loop verification processes adds layers of difficulty to system design.
Many organizations also struggle with the technical hurdles of integrating modern analytics tools with fragmented legacy systems, which can compromise the effectiveness of any data-driven talent management strategy. Furthermore, cultural resistance from employees who may perceive these tools as surveillance rather than developmental aids can undermine adoption.
Overcoming these obstacles requires a transparent implementation strategy and a focus on evidence-based talent strategy that clearly communicates the benefits of continuous professional development.
Explore Full Market Dynamics Analysis Request Free Sample
Workforce Upskilling Analytics Market Segmentation
The workforce upskilling analytics industry research report provides comprehensive data including region-wise segment analysis, with forecasts and analysis for the period 2026-2030, as well as historical data from 2020-2024 for the following segments.
Component Segment Analysis
The software segment is estimated to witness significant growth during the forecast period.
The software component, which includes specialized tools like skills ontology and gap analysis dashboards, is the primary engine for data collection and insight generation in the workforce upskilling analytics market.
This segment, which accounted for more than 70% of the market in 2025, utilizes predictive modeling and learning recommendations engines to create personalized learning paths.
By establishing a unified skills taxonomy, organizations can accurately inventory existing talent and identify areas for development.
Innovations in automated skills mapping utilize large language models to analyze internal communications and build a dynamic competency management framework, reducing administrative burden and increasing the accuracy of talent assessments.
This shift toward a data-driven talent management strategy allows for a more agile response to market changes, fostering an efficient environment for professional advancement through reskilling simulations.
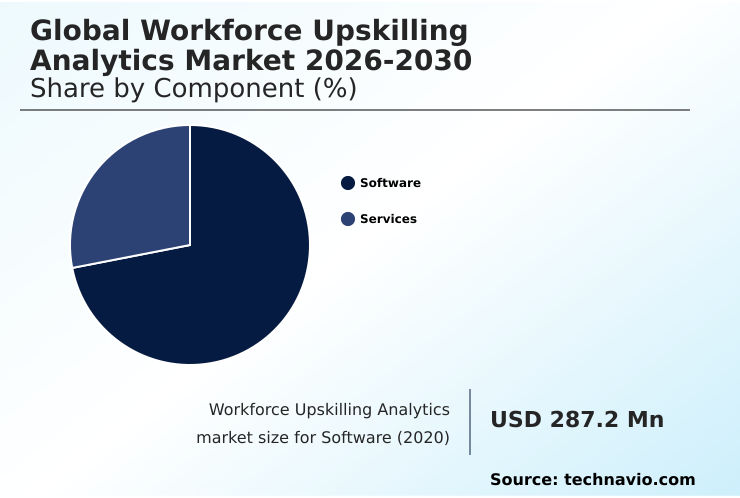
The Software segment was valued at USD 513.7 million in 2024 and showed a gradual increase during the forecast period.
Workforce Upskilling Analytics Market by Region: North America Leads with 44.2% Growth Share
North America is estimated to contribute 44.2% to the growth of the global market during the forecast period.
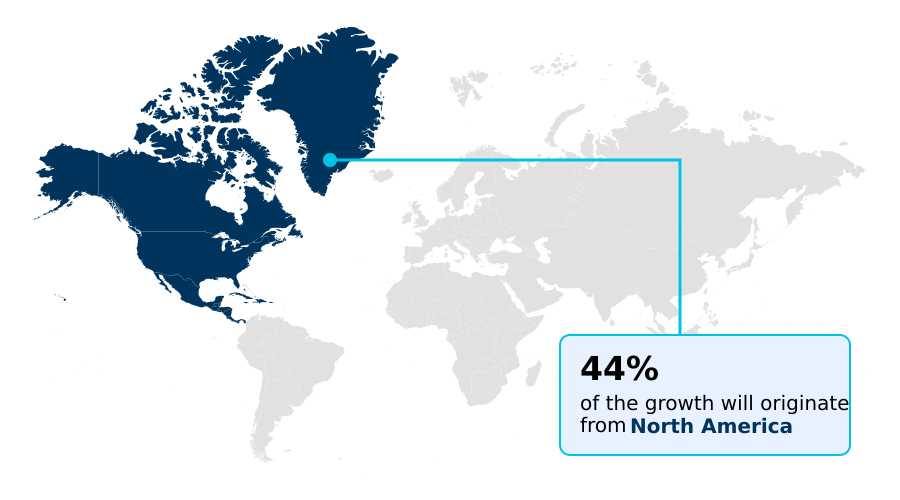
The geographic landscape is led by North America, which accounts for over 44% of the market's incremental growth, driven by early adoption in the US and Canada.
Europe follows, with its market shaped by stringent data privacy compliance (GDPR) and a focus on ethical AI.
Meanwhile, APAC is the fastest-growing region, with countries like India and China leveraging these platforms for large-scale employee competency data management to support their expanding digital economies.
In a typical use case, a multinational corporation with operations in APAC might use a unified platform for proficiency tracking across different countries, ensuring consistent skill standards.
This involves deploying a robust skills taxonomy and utilizing a learning recommendations engine to cater to diverse linguistic and cultural needs, ultimately fostering a cohesive and competitive global workforce.
Customer Landscape Analysis for the Workforce Upskilling Analytics Market
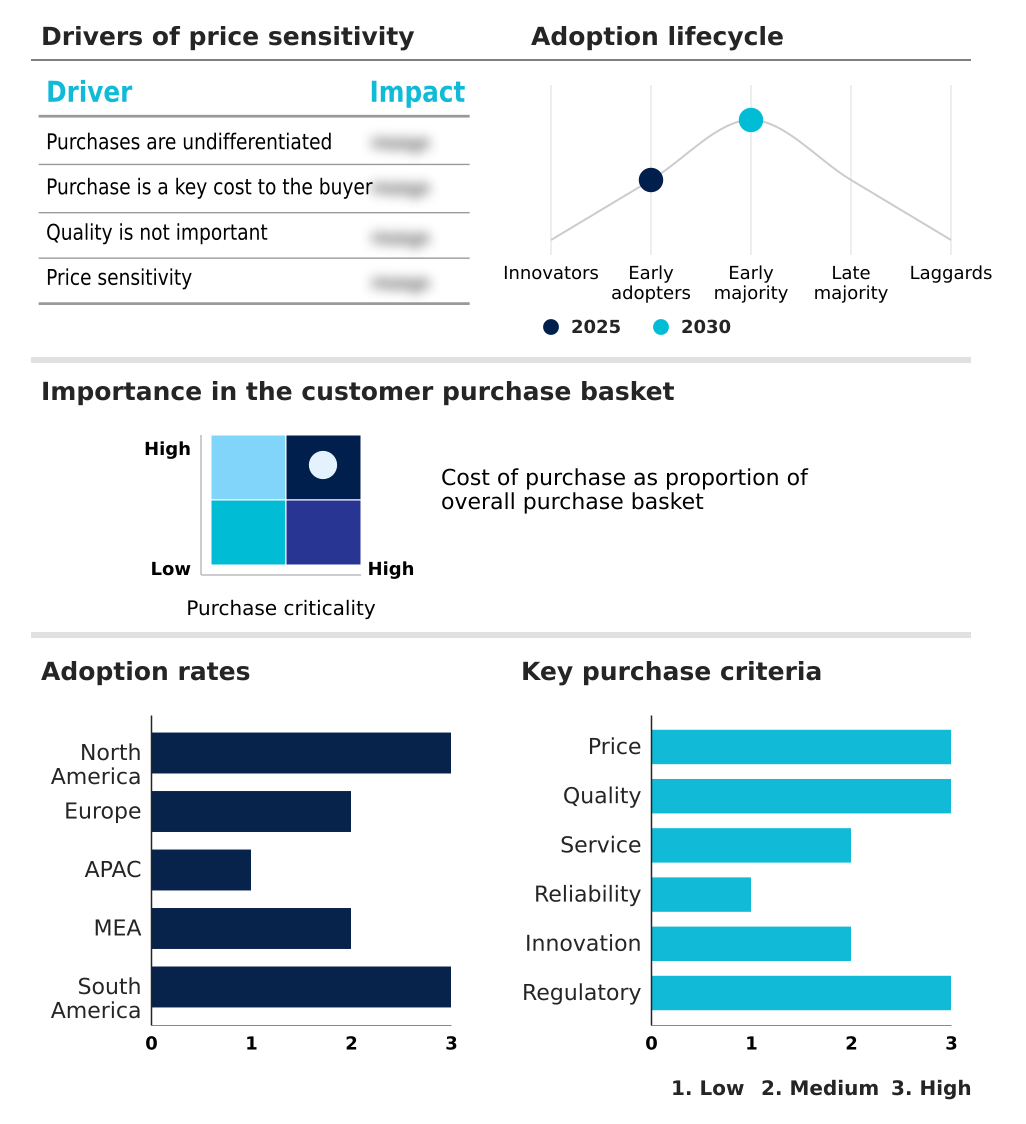
The workforce upskilling analytics market forecasting report includes the adoption lifecycle of the market, covering from the innovator’s stage to the laggard’s stage. It focuses on adoption rates in different regions based on penetration. Furthermore, the workforce upskilling analytics market report also includes key purchase criteria and drivers of price sensitivity to help companies evaluate and develop their market growth analysis strategies.
Competitive Landscape of the Workforce Upskilling Analytics Market
Companies are implementing various strategies, such as strategic alliances, partnerships, mergers and acquisitions, geographical expansion, and product/service launches, to enhance their presence in the workforce upskilling analytics market industry.
360Learning SA - Analytics solutions provide peer feedback tracking, skill progression dashboards, and ROI measurement for internal upskilling programs.
The industry research and growth report includes detailed analyses of the competitive landscape of the market and information about key companies, including:
- 360Learning SA
- Beamery Inc.
- Cornerstone OnDemand Inc.
- Coursera Inc.
- Degreed Inc.
- Docebo Inc.
- Gloat Inc.
- Guild Education Inc.
- LinkedIn Corp.
- Microsoft Corp.
- Monster Inc.
- MuchSkills AB
- Oracle Corp.
- Phenom People Inc.
- Pluralsight LLC
- SAP SE
- Skillsoft Corp.
- Udemy Inc.
- Valamis Group
- Workday Inc.
Qualitative and quantitative analysis of companies has been conducted to help clients understand the wider business environment as well as the strengths and weaknesses of key industry players. Data is qualitatively analyzed to categorize companies as pure play, category-focused, industry-focused, and diversified; it is quantitatively analyzed to categorize companies as dominant, leading, strong, tentative, and weak.
Recent Developments in the Workforce Upskilling Analytics Market
- In March, 2025, Udemy Business introduced an advanced generative AI assistant designed to create dynamic learning paths for enterprise users by analyzing project metadata and task descriptions from integrated project management tools.
- In April, 2025, Google Cloud launched its AI Skills Navigator, a platform providing enterprise leaders with granular analytics on their workforce's readiness for artificial intelligence implementation, including automated suggestions for bridge training.
- In May, 2025, Microsoft announced a significant update to its Viva suite that included an automated skills mapping engine, which uses large language models to build a dynamic skills ontology from internal communications.
- In May, 2025, Gloat released an Agile Resource Management module that utilizes real-time skill data to recommend project teams based on task requirements and the developmental needs of the staff, enhancing workforce agility.
Research Analyst Overview: Workforce Upskilling Analytics Market
Boardroom decisions regarding talent acquisition and retention are now directly influenced by insights from the workforce upskilling analytics market. The software segment, which represents the largest portion of the market, is a key enabler, providing the tools for deep skill verification and gap analysis dashboards.
Executive leadership is leveraging these platforms to build a verifiable skills-based organizational architecture, moving beyond traditional hiring criteria. This involves the use of a comprehensive skills ontology and AI-driven insights to inform strategic workforce planning. For instance, compliance with evolving data privacy laws, such as GDPR, requires a system that can manage employee competency data transparently.
Organizations are using proficiency tracking and digital credentialing to create a clear record of qualifications. The ability to deploy reskilling simulations and gamified proficiency assessments helps in identifying high-potential individuals for leadership roles, ensuring the firm's long-term competitive advantage through superior human capital management and career pathing analytics.
Dive into Technavio’s robust research methodology, blending expert interviews, extensive data synthesis, and validated models for unparalleled Workforce Upskilling Analytics Market insights. See full methodology.
| Market Scope | |
|---|---|
| Page number | 298 |
| Base year | 2025 |
| Historic period | 2020-2024 |
| Forecast period | 2026-2030 |
| Growth momentum & CAGR | Accelerate at a CAGR of 16.5% |
| Market growth 2026-2030 | USD 921.8 million |
| Market structure | Fragmented |
| YoY growth 2025-2026(%) | 15.7% |
| Key countries | US, Canada, Mexico, Germany, France, UK, Italy, Spain, The Netherlands, China, India, Japan, Australia, South Korea, Indonesia, Saudi Arabia, UAE, South Africa, Egypt, Nigeria, Brazil, Argentina and Colombia |
| Competitive landscape | Leading Companies, Market Positioning of Companies, Competitive Strategies, and Industry Risks |
Workforce Upskilling Analytics Market: Key Questions Answered in This Report
-
What is the expected growth of the Workforce Upskilling Analytics Market between 2026 and 2030?
-
The Workforce Upskilling Analytics Market is expected to grow by USD 921.8 million during 2026-2030, registering a CAGR of 16.5%. Year-over-year growth in 2026 is estimated at 15.7%%. This acceleration is shaped by rapid proliferation of ai and resulting technical skills gap, which is intensifying demand across multiple end-use verticals covered in the report.
-
-
What segmentation does the market report cover?
-
The report is segmented by Component (Software, and Services), Deployment (Cloud based, and On premises), Application (Skills gap analysis and forecasting, Personalized learning recommendations, Upskilling ROI and progress tracking, Talent mobility and internal marketplace analytics, and Others) and Geography (North America, Europe, APAC, Middle East and Africa, South America). Among these, the Software segment is estimated to witness significant growth during the forecast period, driven by rising adoption across key application areas. Each segment includes detailed qualitative and quantitative analysis, along with historical data from 2020-2024 and forecasts through 2030 with year-over-year growth rates.
-
-
Which regions are analyzed in the report?
-
The report covers North America, Europe, APAC, Middle East and Africa and South America. North America is estimated to contribute 44.2% to market growth during the forecast period. Country-level analysis includes US, Canada, Mexico, Germany, France, UK, Italy, Spain, The Netherlands, China, India, Japan, Australia, South Korea, Indonesia, Saudi Arabia, UAE, South Africa, Egypt, Nigeria, Brazil, Argentina and Colombia, with dedicated market size tables and year-over-year growth for each.
-
-
What are the key growth drivers and market challenges?
-
The primary driver is rapid proliferation of ai and resulting technical skills gap, which is accelerating investment and industry demand. The main challenge is data privacy and regulatory compliance complexity, creating operational barriers for key market participants. The report quantifies the impact of each driver and challenge across 2026 and 2030 with comparative analysis.
-
-
Who are the major players in the Workforce Upskilling Analytics Market?
-
Key vendors include 360Learning SA, Beamery Inc., Cornerstone OnDemand Inc., Coursera Inc., Degreed Inc., Docebo Inc., Gloat Inc., Guild Education Inc., LinkedIn Corp., Microsoft Corp., Monster Inc., MuchSkills AB, Oracle Corp., Phenom People Inc., Pluralsight LLC, SAP SE, Skillsoft Corp., Udemy Inc., Valamis Group and Workday Inc.. The report provides qualitative and quantitative analysis categorizing companies as dominant, leading, strong, tentative, and weak based on their market positioning. Company profiles include business segment analysis, SWOT assessment, key offerings, and recent strategic developments.
-
Workforce Upskilling Analytics Market Research Insights
Market dynamics are shaped by the operational need to integrate workforce analytics with legacy systems, a process complicated by regulations like the General Data Protection Regulation (GDPR). The cloud based deployment model dominates, holding a substantially larger share than on-premises solutions due to its scalability for managing a decentralized team.
Procurement decisions are influenced by a platform's capacity for human capital management integration and its ability to provide evidence-based talent strategy through metrics like reduced time-to-competency. A key application involves using real-time labor market intelligence to inform curriculum development, ensuring that training investments directly address the most critical technical skills gaps.
This strategic alignment of learning with business objectives is fundamental to demonstrating value and securing ongoing budgetary support for talent development initiatives.
We can help! Our analysts can customize this workforce upskilling analytics market research report to meet your requirements.
 RIA -
RIA - 
