Workspace Management Software Market Analysis, Size, and Forecast 2026-2030: North America (US, Canada, and Mexico), APAC (China, Japan, and India), Europe (Germany, UK, and France), South America (Brazil, Argentina, and Colombia), Middle East and Africa (South Africa, Saudi Arabia, and UAE), and Rest of World (ROW)

Workspace Management Software Market Analysis, Size, and Forecast 2026-2030:
North America (US, Canada, and Mexico), APAC (China, Japan, and India), Europe (Germany, UK, and France), South America (Brazil, Argentina, and Colombia), Middle East and Africa (South Africa, Saudi Arabia, and UAE), and Rest of World (ROW)

Published: Dec 2025 295 Pages SKU: IRTNTR44679

Market Overview at a Glance

$5.32 B
Market Opportunity
22.6%
CAGR 2025 - 2030
39.3%
North America Growth
$2.03 B
Cloud-based segment 2024

Workspace Management Software Market Size 2026-2030

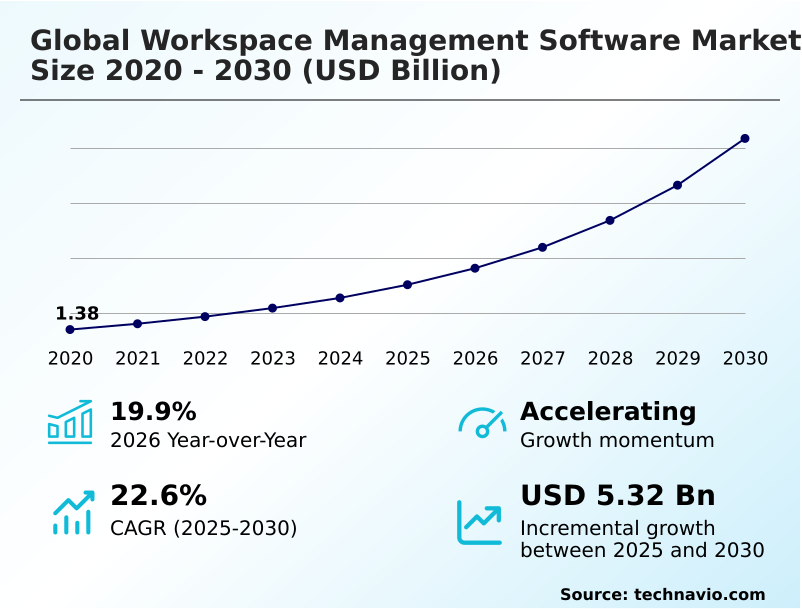
The workspace management software market size is valued to increase by USD 5.32 billion, at a CAGR of 22.6% from 2025 to 2030. Strategic convergence of sustainability and workspace optimization will drive the workspace management software market.

Major Market Trends & Insights

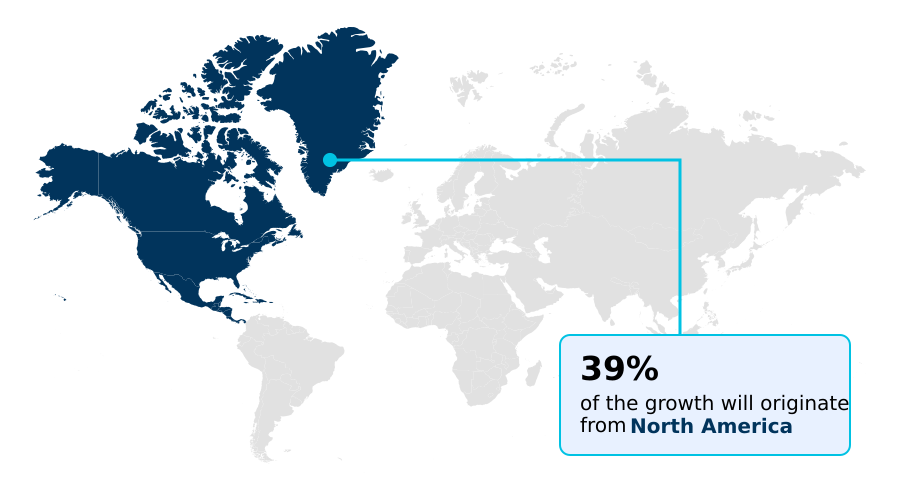
  • North America dominated the market and accounted for a 39.3% growth during the forecast period.
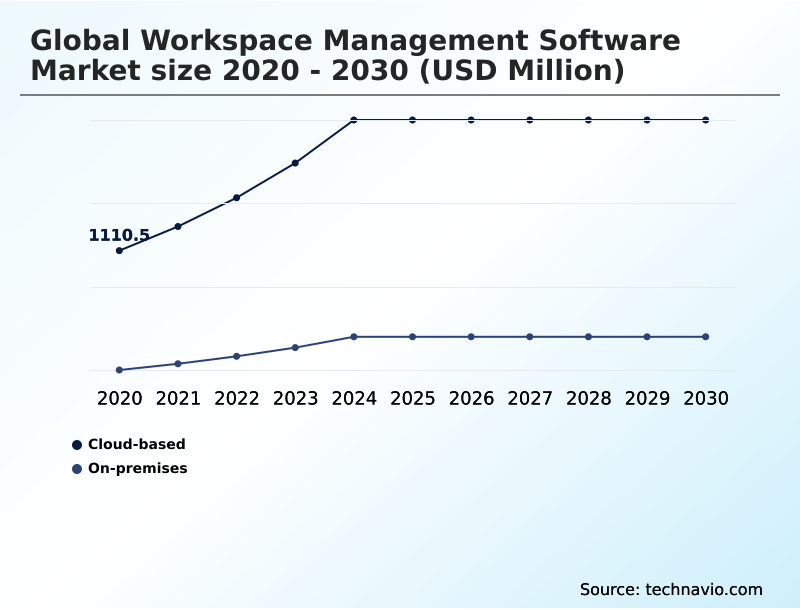
  • By Deployment - Cloud-based segment was valued at USD 2.03 billion in 2024
  • By Application - IT and telecom segment accounted for the largest market revenue share in 2024

Market Size & Forecast

  • Market Opportunities: USD 6.95 billion
  • Market Future Opportunities: USD 5.32 billion
  • CAGR from 2025 to 2030 : 22.6%

Market Summary

  • The workspace management software market is undergoing a fundamental transformation, moving far beyond simple administrative tools to become a strategic asset for corporate real estate. This evolution is propelled by the widespread adoption of hybrid work models, which demand intelligent, data-driven solutions for effective portfolio optimization.
  • A key trend is the integration of agentic AI and predictive analytics, allowing for the automation of facility maintenance and dynamic scheduling. Concurrently, sustainability has become a major driver, compelling organizations to implement platforms capable of carbon footprint tracking through integration with building management systems (BMS) to monitor energy consumption metrics.
  • For instance, a global enterprise can use a digital twin and scenario planning features to model the consolidation of three office floors into two. By analyzing historical utilization metrics and predicted attendance, the software enables a decision that reduces lease expenditures and energy use by over 20%, all without disrupting team workflows.
  • However, challenges persist, particularly around the secure integration of these platforms with legacy systems and ensuring data privacy, which remain critical hurdles to seamless adoption.

What will be the Size of the Workspace Management Software Market during the forecast period?

Get Key Insights on Market Forecast (PDF) Request Free Sample

How is the Workspace Management Software Market Segmented?

The workspace management software industry research report provides comprehensive data (region-wise segment analysis), with forecasts and estimates in "USD million" for the period 2026-2030, as well as historical data from 2020-2024 for the following segments.

  • Deployment
    • Cloud-based
    • On-premises
  • Application
    • IT and telecom
    • Retail and e-commerce
    • Healthcare
    • Others
  • Product
    • Desktop software
    • Web-based software
    • Mobile applications
  • Geography
    • North America
      • US
      • Canada
      • Mexico
    • APAC
      • China
      • Japan
      • India
    • Europe
      • Germany
      • UK
      • France
    • South America
      • Brazil
      • Argentina
      • Colombia
    • Middle East and Africa
      • South Africa
      • Saudi Arabia
      • UAE
    • Rest of World (ROW)

By Deployment Insights

The cloud-based segment is estimated to witness significant growth during the forecast period.

The global workspace management software market is predominantly driven by cloud-based deployments, which have become the operational backbone for modern hybrid work models.

This segment's dominance is rooted in the inherent need for agility, scalability, and ubiquitous access provided by cloud-native architecture. Organizations leverage these platforms for everything from dynamic scheduling and resource booking to real-time analytics.

The ability to integrate seamlessly with a broader digital workplace ecosystem, including HRIS integration and calendar platforms, is a critical advantage. Such connectivity supports mobile-first interface strategies, allowing employees to manage their work life from anywhere.

Reflecting this market preference, cloud solutions now represent approximately 80% of new deployments, underscoring the shift away from rigid, on-premises systems toward more flexible, data-driven workplace optimization software.

Request Free Sample

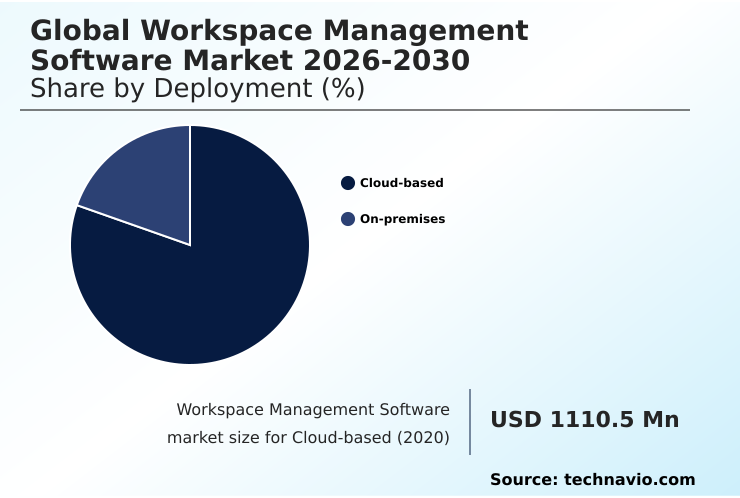
The Cloud-based segment was valued at USD 2.03 billion in 2024 and showed a gradual increase during the forecast period.

Request Free Sample

Regional Analysis

North America is estimated to contribute 39.3% to the growth of the global market during the forecast period.Technavio’s analysts have elaborately explained the regional trends and drivers that shape the market during the forecast period.

See How Workspace Management Software Market Demand is Rising in North America Request Free Sample

The geographic landscape of the workspace management software market is led by North America, which accounts for approximately 39.3% of the incremental growth, driven by a mature focus on portfolio optimization and compliance.

In contrast, the European market prioritizes sustainability, where integrated workplace management systems (IWMS) are essential for regulatory reporting, helping firms document carbon footprint reductions of up to 12%.

Organizations in North America are leveraging space utilization analytics for data-driven real estate consolidation, achieving savings of over 20%.

The APAC region, representing 25.18% of the market opportunity, is distinguished by its rapid adoption of mobile-first interface technologies and flexible office solutions, often bypassing legacy on-premises deployment models entirely.

This diverse regional focus shapes the development of workplace resource management and employee-centric workplace apps globally.

Market Dynamics

Our researchers analyzed the data with 2025 as the base year, along with the key drivers, trends, and challenges. A holistic analysis of drivers will help companies refine their marketing strategies to gain a competitive advantage.

  • In today's corporate environment, understanding how to measure space utilization is fundamental for strategic decision-making. Executives are exploring the benefits of IWMS for enterprises, recognizing that software for corporate real estate is no longer optional. A key driver is the push toward ESG compliance, making workspace software for sustainability goals a boardroom priority.
  • However, the challenges of integrating legacy systems remain a significant hurdle. A primary concern is data privacy in smart offices, especially given the role of software in RTO mandates. To address this, organizations evaluate options by asking how to best achieve integrating BMS with workspace software and leveraging AI for optimizing office space.
  • The adoption of using IoT for occupancy tracking provides the granular data needed for predictive analytics for office usage, which is essential for automating facility management tasks. When selecting a platform, decision-makers weigh cloud vs on-premises workspace software, the necessity of seamless visitor management system integration, and protocols for secure desk booking for finance.
  • This data-centric approach, which includes features like mobile wayfinding in a corporate campus and robust workspace software API integrations, yields analytics for portfolio optimization that are over 30% more accurate than previous manual methods. This improved accuracy in managing hybrid work is critical for success.

What are the key market drivers leading to the rise in the adoption of Workspace Management Software Industry?

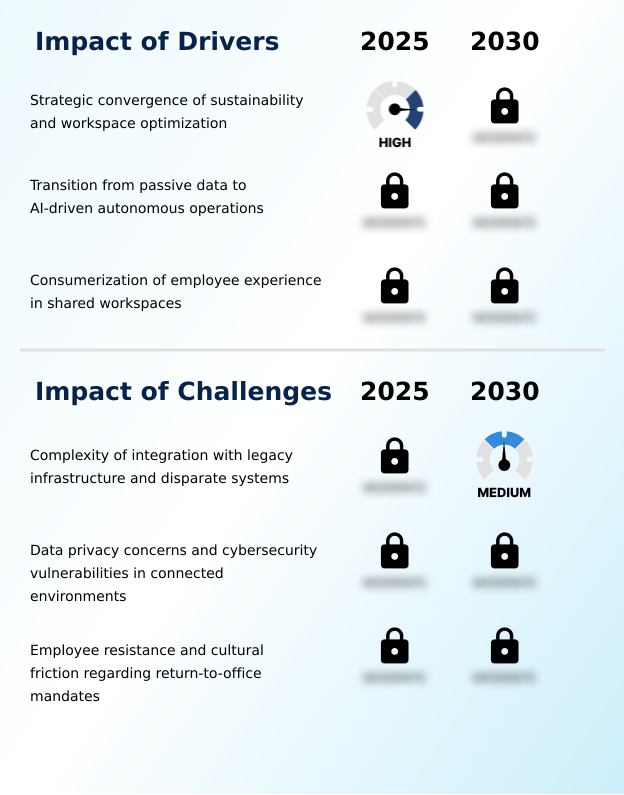
  • A key market driver is the strategic convergence of corporate sustainability goals with the optimization of workspace utilization and energy consumption.

  • The market's growth is fueled by three primary drivers.
  • First, stringent sustainability mandates are compelling organizations to adopt sustainability reporting tools, with integrations between workspace software and building management systems (BMS) demonstrating the capacity to reduce energy waste by over 20% through dynamic scheduling.
  • Second, the demand for operational efficiency is accelerating the adoption of predictive analytics and AI-driven facility management. Systems that automate cleaning and maintenance schedules based on real-time occupancy tracking data can lower associated labor costs by 10%.
  • The third driver is the consumerization of the employee experience.
  • Creating a frictionless, hospitality-like environment requires intuitive, mobile-first interface designs and robust workplace analytics platforms, with companies prioritizing this user-centric approach reporting a 50% higher adoption rate of their hybrid work models and associated hot-desking policies.

What are the market trends shaping the Workspace Management Software Industry?

  • A significant market trend involves the shift away from static workplace management tools. This evolution favors intelligent systems that provide real-time optimization of spaces and resources.

  • Key market trends are redefining workspace management beyond simple desk hoteling software. The foremost trend is the pivot to intelligent automation, where agentic AI moves beyond predictive analytics to autonomously manage facility services, improving operational response times by up to 30%. Secondly, platform consolidation is creating unified employee experience platforms.
  • Integrated applications that combine room booking and visitor management with internal communication channels see 40% higher employee engagement compared to disparate, siloed tools. Finally, sustainability has become an inextricable trend, with integrated workplace management systems (IWMS) providing essential energy consumption metrics.
  • These platforms enable organizations to achieve and document a 15% reduction in their building's carbon footprint, satisfying both corporate goals and regulatory demands for sustainability reporting through effective carbon footprint tracking and analysis of utilization metrics.

What challenges does the Workspace Management Software Industry face during its growth?

  • A primary challenge affecting industry growth is the complexity of integrating modern workspace management software with legacy infrastructure and disparate enterprise systems.

  • Significant challenges constrain the seamless adoption of workspace management software. The technical complexity of achieving deep HRIS integration with legacy building management systems (BMS) can severely delay projects, with deployment timelines often exceeding initial estimates by 40%.
  • Cybersecurity and data privacy present another major hurdle, as the vast data collected for occupancy data analysis creates new vulnerabilities; security audits frequently reveal critical gaps in over 25% of initial setups. Lastly, cultural resistance to return-to-office tools perceived as surveillance undermines platform value.
  • Employee engagement with such systems can plummet by as much as 60%, corrupting the quality of real-time analytics and rendering portfolio optimization efforts based on that data ineffective. This highlights the difficulty in balancing facility management automation with employee trust.

Exclusive Technavio Analysis on Customer Landscape

The workspace management software market forecasting report includes the adoption lifecycle of the market, covering from the innovator’s stage to the laggard’s stage. It focuses on adoption rates in different regions based on penetration. Furthermore, the workspace management software market report also includes key purchase criteria and drivers of price sensitivity to help companies evaluate and develop their market growth analysis strategies.

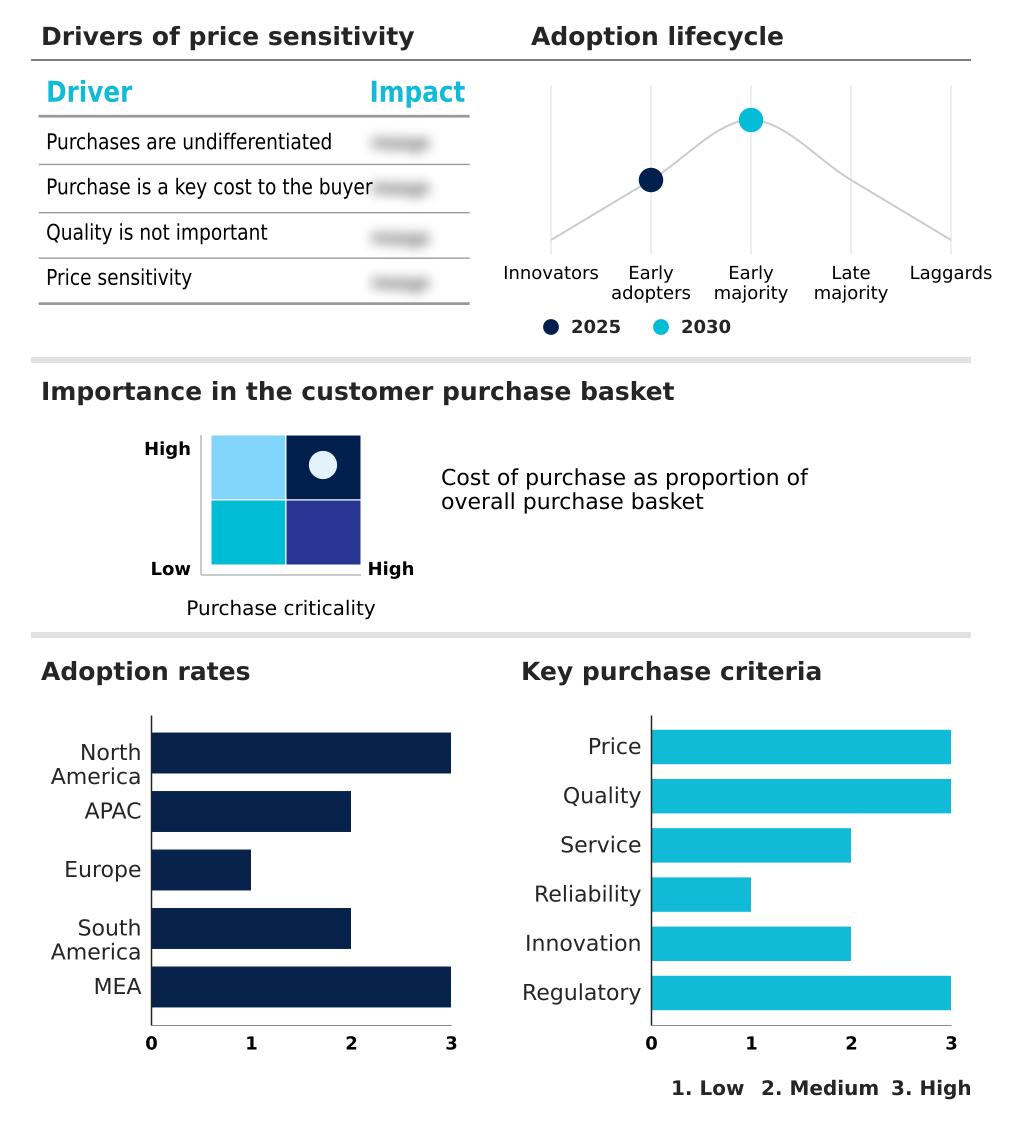
Customer Landscape of Workspace Management Software Industry

Competitive Landscape

Companies are implementing various strategies, such as strategic alliances, workspace management software market forecast, partnerships, mergers and acquisitions, geographical expansion, and product/service launches, to enhance their presence in the industry.

AgilQuest Corp. - Specializes in cloud-based desk, meeting room, and resource booking software, providing analytics to optimize flexible workplace utilization.

The industry research and growth report includes detailed analyses of the competitive landscape of the market and information about key companies, including:

  • AgilQuest Corp.
  • AppiXoft
  • Asure Software Inc.
  • Citrix Systems Inc.
  • Condeco Group Ltd.
  • FM Systems Group LLC
  • IBM Corp.
  • iOFFICE LP
  • Ivanti Software Inc.
  • Matrix42 GmbH
  • MRI Software LLC
  • Nemetschek SE
  • NFS Technology Group
  • OfficeSpace Software, Inc.
  • Planon Group
  • Ricoh Co. Ltd.
  • Vega Technology Ltd.
  • Yardi Systems Inc.

Qualitative and quantitative analysis of companies has been conducted to help clients understand the wider business environment as well as the strengths and weaknesses of key industry players. Data is qualitatively analyzed to categorize companies as pure play, category-focused, industry-focused, and diversified; it is quantitatively analyzed to categorize companies as dominant, leading, strong, tentative, and weak.

Recent Development and News in Workspace management software market

  • In August 2024, ServiceNow enhanced its Workplace Service Delivery suite with the introduction of the Workplace Services Kiosk and Multi-building Scenario Planning tools to streamline visitor management and improve complex space planning.
  • In October 2024, Eptura launched its unified work-tech platform, combining workplace experience and asset management with embedded AI and cross-platform data analytics to provide a single, holistic operational view.
  • In January 2025, Spacebring rolled out a major platform update featuring advanced role-based digital interfaces engineered to deliver a tailored, hospitality-driven experience for both coworking space members and community managers.
  • In September 2025, Appspace acquired Igloo Software, a provider of modern intranet solutions, to create a comprehensive platform that merges physical workplace management with digital employee communication and engagement channels.

Dive into Technavio’s robust research methodology, blending expert interviews, extensive data synthesis, and validated models for unparalleled Workspace Management Software Market insights. See full methodology.

Market Scope
Page number 295
Base year 2025
Historic period 2020-2024
Forecast period 2026-2030
Growth momentum & CAGR Accelerate at a CAGR of 22.6%
Market growth 2026-2030 USD 5316.6 million
Market structure Fragmented
YoY growth 2025-2026(%) 19.9%
Key countries US, Canada, Mexico, China, Japan, India, South Korea, Australia, Indonesia, Germany, UK, France, Italy, Spain, The Netherlands, Brazil, Argentina, Colombia, South Africa, Saudi Arabia, UAE, Egypt and Turkey
Competitive landscape Leading Companies, Market Positioning of Companies, Competitive Strategies, and Industry Risks

Request Free Sample

Research Analyst Overview

  • The workspace management software market has matured from basic desk booking and room booking tools into sophisticated, intelligence-driven ecosystems. Modern platforms offer comprehensive visitor management, detailed occupancy tracking, and dynamic space planning capabilities. This shift is powered by the integration of agentic AI and predictive analytics, which transform static utilization metrics into actionable strategies for portfolio optimization.
  • A core component of this evolution is the digital twin, which provides a virtual replica of the physical environment for advanced scenario planning. For boardroom-level consideration, the strategic value lies in connecting facility operations to financial and sustainability goals. Integrated workplace management systems (IWMS) now deliver crucial sustainability reporting, enabling carbon footprint tracking and analysis of energy consumption metrics.
  • The convergence of these systems with building management systems (BMS) and physical access control is paramount. Furthermore, deep HRIS integration ensures that resource scheduling and facility maintenance are aligned with personnel data.
  • Platforms that effectively unify these functions, including asset management and a mobile-first interface with wayfinding technology, have demonstrated a 40% reduction in unauthorized access incidents, underscoring their critical role in both security and operational efficiency for organizations embracing hybrid work models and activity-based working.

What are the Key Data Covered in this Workspace Management Software Market Research and Growth Report?

  • What is the expected growth of the Workspace Management Software Market between 2026 and 2030?

    • USD 5.32 billion, at a CAGR of 22.6%

  • What segmentation does the market report cover?

    • The report is segmented by Deployment (Cloud-based, and On-premises), Application (IT and telecom, Retail and e-commerce, Healthcare, and Others), Product (Desktop software, Web-based software, and Mobile applications) and Geography (North America, APAC, Europe, South America, Middle East and Africa)

  • Which regions are analyzed in the report?

    • North America, APAC, Europe, South America and Middle East and Africa

  • What are the key growth drivers and market challenges?

    • Strategic convergence of sustainability and workspace optimization, Complexity of integration with legacy infrastructure and disparate systems

  • Who are the major players in the Workspace Management Software Market?

    • AgilQuest Corp., AppiXoft, Asure Software Inc., Citrix Systems Inc., Condeco Group Ltd., FM Systems Group LLC, IBM Corp., iOFFICE LP, Ivanti Software Inc., Matrix42 GmbH, MRI Software LLC, Nemetschek SE, NFS Technology Group, OfficeSpace Software, Inc., Planon Group, Ricoh Co. Ltd., Vega Technology Ltd. and Yardi Systems Inc.

Market Research Insights

  • The market is shifting from standalone applications to a comprehensive digital workplace ecosystem, where workspace optimization software acts as a central hub. The implementation of AI-driven facility management has proven to reduce energy expenses by up to 18% by dynamically adjusting building systems based on real-time occupancy data analysis.
  • Furthermore, organizations deploying return-to-office tools integrated with employee engagement tools report a 25% higher adoption rate of hybrid work policies compared to those using basic scheduling systems. The emphasis is evolving from simple desk hoteling software to sophisticated platforms that enhance the employee-centric workplace experience.
  • This focus on user experience and automation is demonstrated by a 15% reduction in facility service requests, achieved through advanced facility management automation, showcasing a tangible return on investment beyond just space utilization.

We can help! Our analysts can customize this workspace management software market research report to meet your requirements.

Get in touch

1. Executive Summary

1.1 Market overview

Executive Summary - Chart on Market Overview
Executive Summary - Data Table on Market Overview
Executive Summary - Chart on Global Market Characteristics
Executive Summary - Chart on Market by Geography
Executive Summary - Chart on Market Segmentation by Deployment
Executive Summary - Chart on Market Segmentation by Application
Executive Summary - Chart on Market Segmentation by Product
Executive Summary - Chart on Incremental Growth
Executive Summary - Data Table on Incremental Growth
Executive Summary - Chart on Company Market Positioning

2. Technavio Analysis

2.1 Analysis of price sensitivity, lifecycle, customer purchase basket, adoption rates, and purchase criteria

2.2 Criticality of inputs and Factors of differentiation

Chart on Overview on criticality of inputs and factors of differentiation

2.3 Factors of disruption

Chart on Overview on factors of disruption

2.4 Impact of drivers and challenges

Chart on Impact of drivers and challenges in 2025 and 2030

3. Market Landscape

3.1 Market ecosystem

Chart on Parent Market
Data Table on - Parent Market

3.2 Market characteristics

Chart on Market characteristics analysis

3.3 Value chain analysis

Chart on Value chain analysis

4. Market Sizing

4.1 Market definition

Data Table on Offerings of companies included in the market definition

4.2 Market segment analysis

Market segments

4.3 Market size 2025

4.4 Market outlook: Forecast for 2025-2030

Chart on Global - Market size and forecast 2025-2030 ($ million)
Data Table on Global - Market size and forecast 2025-2030 ($ million)
Chart on Global Market: Year-over-year growth 2025-2030 (%)
Data Table on Global Market: Year-over-year growth 2025-2030 (%)

5. Historic Market Size

5.1 Global Workspace Management Software Market 2020 - 2024

Historic Market Size - Data Table on Global Workspace Management Software Market 2020 - 2024 ($ million)

5.2 Deployment segment analysis 2020 - 2024

Historic Market Size - Deployment Segment 2020 - 2024 ($ million)

5.3 Application segment analysis 2020 - 2024

Historic Market Size - Application Segment 2020 - 2024 ($ million)

5.4 Product segment analysis 2020 - 2024

Historic Market Size - Product Segment 2020 - 2024 ($ million)

5.5 Geography segment analysis 2020 - 2024

Historic Market Size - Geography Segment 2020 - 2024 ($ million)

5.6 Country segment analysis 2020 - 2024

Historic Market Size - Country Segment 2020 - 2024 ($ million)

6. Qualitative Analysis

6.1 Impact of AI in the Global Workspace Management Software Market

7. Five Forces Analysis

7.1 Five forces summary

Five forces analysis - Comparison between 2025 and 2030

7.2 Bargaining power of buyers

Bargaining power of buyers - Impact of key factors 2025 and 2030

7.3 Bargaining power of suppliers

Bargaining power of suppliers - Impact of key factors in 2025 and 2030

7.4 Threat of new entrants

Threat of new entrants - Impact of key factors in 2025 and 2030

7.5 Threat of substitutes

Threat of substitutes - Impact of key factors in 2025 and 2030

7.6 Threat of rivalry

Threat of rivalry - Impact of key factors in 2025 and 2030

7.7 Market condition

Chart on Market condition - Five forces 2025 and 2030

8. Market Segmentation by Deployment

8.1 Market segments

Chart on Deployment - Market share 2025-2030 (%)
Data Table on Deployment - Market share 2025-2030 (%)

8.2 Comparison by Deployment

Chart on Comparison by Deployment
Data Table on Comparison by Deployment

8.3 Cloud-based - Market size and forecast 2025-2030

Chart on Cloud-based - Market size and forecast 2025-2030 ($ million)
Data Table on Cloud-based - Market size and forecast 2025-2030 ($ million)
Chart on Cloud-based - Year-over-year growth 2025-2030 (%)
Data Table on Cloud-based - Year-over-year growth 2025-2030 (%)

8.4 On-premises - Market size and forecast 2025-2030

Chart on On-premises - Market size and forecast 2025-2030 ($ million)
Data Table on On-premises - Market size and forecast 2025-2030 ($ million)
Chart on On-premises - Year-over-year growth 2025-2030 (%)
Data Table on On-premises - Year-over-year growth 2025-2030 (%)

8.5 Market opportunity by Deployment

Market opportunity by Deployment ($ million)
Data Table on Market opportunity by Deployment ($ million)

9. Market Segmentation by Application

9.1 Market segments

Chart on Application - Market share 2025-2030 (%)
Data Table on Application - Market share 2025-2030 (%)

9.2 Comparison by Application

Chart on Comparison by Application
Data Table on Comparison by Application

9.3 IT and telecom - Market size and forecast 2025-2030

Chart on IT and telecom - Market size and forecast 2025-2030 ($ million)
Data Table on IT and telecom - Market size and forecast 2025-2030 ($ million)
Chart on IT and telecom - Year-over-year growth 2025-2030 (%)
Data Table on IT and telecom - Year-over-year growth 2025-2030 (%)

9.4 Retail and e-commerce - Market size and forecast 2025-2030

Chart on Retail and e-commerce - Market size and forecast 2025-2030 ($ million)
Data Table on Retail and e-commerce - Market size and forecast 2025-2030 ($ million)
Chart on Retail and e-commerce - Year-over-year growth 2025-2030 (%)
Data Table on Retail and e-commerce - Year-over-year growth 2025-2030 (%)

9.5 Healthcare - Market size and forecast 2025-2030

Chart on Healthcare - Market size and forecast 2025-2030 ($ million)
Data Table on Healthcare - Market size and forecast 2025-2030 ($ million)
Chart on Healthcare - Year-over-year growth 2025-2030 (%)
Data Table on Healthcare - Year-over-year growth 2025-2030 (%)

9.6 Others - Market size and forecast 2025-2030

Chart on Others - Market size and forecast 2025-2030 ($ million)
Data Table on Others - Market size and forecast 2025-2030 ($ million)
Chart on Others - Year-over-year growth 2025-2030 (%)
Data Table on Others - Year-over-year growth 2025-2030 (%)

9.7 Market opportunity by Application

Market opportunity by Application ($ million)
Data Table on Market opportunity by Application ($ million)

10. Market Segmentation by Product

10.1 Market segments

Chart on Product - Market share 2025-2030 (%)
Data Table on Product - Market share 2025-2030 (%)

10.2 Comparison by Product

Chart on Comparison by Product
Data Table on Comparison by Product

10.3 Desktop software - Market size and forecast 2025-2030

Chart on Desktop software - Market size and forecast 2025-2030 ($ million)
Data Table on Desktop software - Market size and forecast 2025-2030 ($ million)
Chart on Desktop software - Year-over-year growth 2025-2030 (%)
Data Table on Desktop software - Year-over-year growth 2025-2030 (%)

10.4 Web-based software - Market size and forecast 2025-2030

Chart on Web-based software - Market size and forecast 2025-2030 ($ million)
Data Table on Web-based software - Market size and forecast 2025-2030 ($ million)
Chart on Web-based software - Year-over-year growth 2025-2030 (%)
Data Table on Web-based software - Year-over-year growth 2025-2030 (%)

10.5 Mobile applications - Market size and forecast 2025-2030

Chart on Mobile applications - Market size and forecast 2025-2030 ($ million)
Data Table on Mobile applications - Market size and forecast 2025-2030 ($ million)
Chart on Mobile applications - Year-over-year growth 2025-2030 (%)
Data Table on Mobile applications - Year-over-year growth 2025-2030 (%)

10.6 Market opportunity by Product

Market opportunity by Product ($ million)
Data Table on Market opportunity by Product ($ million)

11. Customer Landscape

11.1 Customer landscape overview

Analysis of price sensitivity, lifecycle, customer purchase basket, adoption rates, and purchase criteria

12. Geographic Landscape

12.1 Geographic segmentation

Chart on Market share by geography 2025-2030 (%)
Data Table on Market share by geography 2025-2030 (%)

12.2 Geographic comparison

Chart on Geographic comparison
Data Table on Geographic comparison

12.3 North America - Market size and forecast 2025-2030

Chart on North America - Market size and forecast 2025-2030 ($ million)
Data Table on North America - Market size and forecast 2025-2030 ($ million)
Chart on North America - Year-over-year growth 2025-2030 (%)
Data Table on North America - Year-over-year growth 2025-2030 (%)
Chart on Regional Comparison - North America
Data Table on Regional Comparison - North America

12.3.1 US - Market size and forecast 2025-2030

Chart on US - Market size and forecast 2025-2030 ($ million)
Data Table on US - Market size and forecast 2025-2030 ($ million)
Chart on US - Year-over-year growth 2025-2030 (%)
Data Table on US - Year-over-year growth 2025-2030 (%)

12.3.2 Canada - Market size and forecast 2025-2030

Chart on Canada - Market size and forecast 2025-2030 ($ million)
Data Table on Canada - Market size and forecast 2025-2030 ($ million)
Chart on Canada - Year-over-year growth 2025-2030 (%)
Data Table on Canada - Year-over-year growth 2025-2030 (%)

12.3.3 Mexico - Market size and forecast 2025-2030

Chart on Mexico - Market size and forecast 2025-2030 ($ million)
Data Table on Mexico - Market size and forecast 2025-2030 ($ million)
Chart on Mexico - Year-over-year growth 2025-2030 (%)
Data Table on Mexico - Year-over-year growth 2025-2030 (%)

12.4 APAC - Market size and forecast 2025-2030

Chart on APAC - Market size and forecast 2025-2030 ($ million)
Data Table on APAC - Market size and forecast 2025-2030 ($ million)
Chart on APAC - Year-over-year growth 2025-2030 (%)
Data Table on APAC - Year-over-year growth 2025-2030 (%)
Chart on Regional Comparison - APAC
Data Table on Regional Comparison - APAC

12.4.1 China - Market size and forecast 2025-2030

Chart on China - Market size and forecast 2025-2030 ($ million)
Data Table on China - Market size and forecast 2025-2030 ($ million)
Chart on China - Year-over-year growth 2025-2030 (%)
Data Table on China - Year-over-year growth 2025-2030 (%)

12.4.2 Japan - Market size and forecast 2025-2030

Chart on Japan - Market size and forecast 2025-2030 ($ million)
Data Table on Japan - Market size and forecast 2025-2030 ($ million)
Chart on Japan - Year-over-year growth 2025-2030 (%)
Data Table on Japan - Year-over-year growth 2025-2030 (%)

12.4.3 India - Market size and forecast 2025-2030

Chart on India - Market size and forecast 2025-2030 ($ million)
Data Table on India - Market size and forecast 2025-2030 ($ million)
Chart on India - Year-over-year growth 2025-2030 (%)
Data Table on India - Year-over-year growth 2025-2030 (%)

12.4.4 South Korea - Market size and forecast 2025-2030

Chart on South Korea - Market size and forecast 2025-2030 ($ million)
Data Table on South Korea - Market size and forecast 2025-2030 ($ million)
Chart on South Korea - Year-over-year growth 2025-2030 (%)
Data Table on South Korea - Year-over-year growth 2025-2030 (%)

12.4.5 Australia - Market size and forecast 2025-2030

Chart on Australia - Market size and forecast 2025-2030 ($ million)
Data Table on Australia - Market size and forecast 2025-2030 ($ million)
Chart on Australia - Year-over-year growth 2025-2030 (%)
Data Table on Australia - Year-over-year growth 2025-2030 (%)

12.4.6 Indonesia - Market size and forecast 2025-2030

Chart on Indonesia - Market size and forecast 2025-2030 ($ million)
Data Table on Indonesia - Market size and forecast 2025-2030 ($ million)
Chart on Indonesia - Year-over-year growth 2025-2030 (%)
Data Table on Indonesia - Year-over-year growth 2025-2030 (%)

12.5 Europe - Market size and forecast 2025-2030

Chart on Europe - Market size and forecast 2025-2030 ($ million)
Data Table on Europe - Market size and forecast 2025-2030 ($ million)
Chart on Europe - Year-over-year growth 2025-2030 (%)
Data Table on Europe - Year-over-year growth 2025-2030 (%)
Chart on Regional Comparison - Europe
Data Table on Regional Comparison - Europe

12.5.1 Germany - Market size and forecast 2025-2030

Chart on Germany - Market size and forecast 2025-2030 ($ million)
Data Table on Germany - Market size and forecast 2025-2030 ($ million)
Chart on Germany - Year-over-year growth 2025-2030 (%)
Data Table on Germany - Year-over-year growth 2025-2030 (%)

12.5.2 UK - Market size and forecast 2025-2030

Chart on UK - Market size and forecast 2025-2030 ($ million)
Data Table on UK - Market size and forecast 2025-2030 ($ million)
Chart on UK - Year-over-year growth 2025-2030 (%)
Data Table on UK - Year-over-year growth 2025-2030 (%)

12.5.3 France - Market size and forecast 2025-2030

Chart on France - Market size and forecast 2025-2030 ($ million)
Data Table on France - Market size and forecast 2025-2030 ($ million)
Chart on France - Year-over-year growth 2025-2030 (%)
Data Table on France - Year-over-year growth 2025-2030 (%)

12.5.4 Italy - Market size and forecast 2025-2030

Chart on Italy - Market size and forecast 2025-2030 ($ million)
Data Table on Italy - Market size and forecast 2025-2030 ($ million)
Chart on Italy - Year-over-year growth 2025-2030 (%)
Data Table on Italy - Year-over-year growth 2025-2030 (%)

12.5.5 Spain - Market size and forecast 2025-2030

Chart on Spain - Market size and forecast 2025-2030 ($ million)
Data Table on Spain - Market size and forecast 2025-2030 ($ million)
Chart on Spain - Year-over-year growth 2025-2030 (%)
Data Table on Spain - Year-over-year growth 2025-2030 (%)

12.5.6 The Netherlands - Market size and forecast 2025-2030

Chart on The Netherlands - Market size and forecast 2025-2030 ($ million)
Data Table on The Netherlands - Market size and forecast 2025-2030 ($ million)
Chart on The Netherlands - Year-over-year growth 2025-2030 (%)
Data Table on The Netherlands - Year-over-year growth 2025-2030 (%)

12.6 South America - Market size and forecast 2025-2030

Chart on South America - Market size and forecast 2025-2030 ($ million)
Data Table on South America - Market size and forecast 2025-2030 ($ million)
Chart on South America - Year-over-year growth 2025-2030 (%)
Data Table on South America - Year-over-year growth 2025-2030 (%)
Chart on Regional Comparison - South America
Data Table on Regional Comparison - South America

12.6.1 Brazil - Market size and forecast 2025-2030

Chart on Brazil - Market size and forecast 2025-2030 ($ million)
Data Table on Brazil - Market size and forecast 2025-2030 ($ million)
Chart on Brazil - Year-over-year growth 2025-2030 (%)
Data Table on Brazil - Year-over-year growth 2025-2030 (%)

12.6.2 Argentina - Market size and forecast 2025-2030

Chart on Argentina - Market size and forecast 2025-2030 ($ million)
Data Table on Argentina - Market size and forecast 2025-2030 ($ million)
Chart on Argentina - Year-over-year growth 2025-2030 (%)
Data Table on Argentina - Year-over-year growth 2025-2030 (%)

12.6.3 Colombia - Market size and forecast 2025-2030

Chart on Colombia - Market size and forecast 2025-2030 ($ million)
Data Table on Colombia - Market size and forecast 2025-2030 ($ million)
Chart on Colombia - Year-over-year growth 2025-2030 (%)
Data Table on Colombia - Year-over-year growth 2025-2030 (%)

12.7 Middle East and Africa - Market size and forecast 2025-2030

Chart on Middle East and Africa - Market size and forecast 2025-2030 ($ million)
Data Table on Middle East and Africa - Market size and forecast 2025-2030 ($ million)
Chart on Middle East and Africa - Year-over-year growth 2025-2030 (%)
Data Table on Middle East and Africa - Year-over-year growth 2025-2030 (%)
Chart on Regional Comparison - Middle East and Africa
Data Table on Regional Comparison - Middle East and Africa

12.7.1 South Africa - Market size and forecast 2025-2030

Chart on South Africa - Market size and forecast 2025-2030 ($ million)
Data Table on South Africa - Market size and forecast 2025-2030 ($ million)
Chart on South Africa - Year-over-year growth 2025-2030 (%)
Data Table on South Africa - Year-over-year growth 2025-2030 (%)

12.7.2 Saudi Arabia - Market size and forecast 2025-2030

Chart on Saudi Arabia - Market size and forecast 2025-2030 ($ million)
Data Table on Saudi Arabia - Market size and forecast 2025-2030 ($ million)
Chart on Saudi Arabia - Year-over-year growth 2025-2030 (%)
Data Table on Saudi Arabia - Year-over-year growth 2025-2030 (%)

12.7.3 UAE - Market size and forecast 2025-2030

Chart on UAE - Market size and forecast 2025-2030 ($ million)
Data Table on UAE - Market size and forecast 2025-2030 ($ million)
Chart on UAE - Year-over-year growth 2025-2030 (%)
Data Table on UAE - Year-over-year growth 2025-2030 (%)

12.7.4 Egypt - Market size and forecast 2025-2030

Chart on Egypt - Market size and forecast 2025-2030 ($ million)
Data Table on Egypt - Market size and forecast 2025-2030 ($ million)
Chart on Egypt - Year-over-year growth 2025-2030 (%)
Data Table on Egypt - Year-over-year growth 2025-2030 (%)

12.7.5 Turkey - Market size and forecast 2025-2030

Chart on Turkey - Market size and forecast 2025-2030 ($ million)
Data Table on Turkey - Market size and forecast 2025-2030 ($ million)
Chart on Turkey - Year-over-year growth 2025-2030 (%)
Data Table on Turkey - Year-over-year growth 2025-2030 (%)

12.8 Market opportunity by geography

Market opportunity by geography ($ million)
Data Tables on Market opportunity by geography ($ million)

13. Drivers, Challenges, and Opportunity

13.1 Market drivers

Strategic convergence of sustainability and workspace optimization
Transition from passive data to AI-driven autonomous operations
Consumerization of employee experience in shared workspaces

13.2 Market challenges

Complexity of integration with legacy infrastructure and disparate systems
Data privacy concerns and cybersecurity vulnerabilities in connected environments
Employee resistance and cultural friction regarding return-to-office mandates

13.3 Impact of drivers and challenges

Impact of drivers and challenges in 2025 and 2030

13.4 Market opportunities

Shift from static workplace tools to intelligent, real-time optimization
Consolidation of physical and digital workplaces into unified experience platforms
Convergence of workspace optimization and sustainability reporting

14. Competitive Landscape

14.1 Overview

14.2

Overview on criticality of inputs and factors of differentiation

14.3 Landscape disruption

Overview on factors of disruption

14.4 Industry risks

Impact of key risks on business

15. Competitive Analysis

15.1 Companies profiled

Companies covered

15.2 Company ranking index

15.3 Market positioning of companies

Matrix on companies position and classification

15.4 AgilQuest Corp.

AgilQuest Corp. - Overview
AgilQuest Corp. - Product / Service
AgilQuest Corp. - Key offerings
SWOT

15.5 AppiXoft

AppiXoft - Overview
AppiXoft - Product / Service
AppiXoft - Key offerings
SWOT

15.6 Asure Software Inc.

Asure Software Inc. - Overview
Asure Software Inc. - Product / Service
Asure Software Inc. - Key offerings
SWOT

15.7 Citrix Systems Inc.

Citrix Systems Inc. - Overview
Citrix Systems Inc. - Product / Service
Citrix Systems Inc. - Key news
Citrix Systems Inc. - Key offerings
SWOT

15.8 Condeco Group Ltd.

Condeco Group Ltd. - Overview
Condeco Group Ltd. - Product / Service
Condeco Group Ltd. - Key offerings
SWOT

15.9 FM Systems Group LLC

FM Systems Group LLC - Overview
FM Systems Group LLC - Product / Service
FM Systems Group LLC - Key offerings
SWOT

15.10 IBM Corp.

IBM Corp. - Overview
IBM Corp. - Business segments
IBM Corp. - Key news
IBM Corp. - Key offerings
IBM Corp. - Segment focus
SWOT

15.11 iOFFICE LP

iOFFICE LP - Overview
iOFFICE LP - Product / Service
iOFFICE LP - Key offerings
SWOT

15.12 Ivanti Software Inc.

Ivanti Software Inc. - Overview
Ivanti Software Inc. - Product / Service
Ivanti Software Inc. - Key news
Ivanti Software Inc. - Key offerings
SWOT

15.13 Matrix42 GmbH

Matrix42 GmbH - Overview
Matrix42 GmbH - Product / Service
Matrix42 GmbH - Key news
Matrix42 GmbH - Key offerings
SWOT

15.14 MRI Software LLC

MRI Software LLC - Overview
MRI Software LLC - Product / Service
MRI Software LLC - Key offerings
SWOT

15.15 Nemetschek SE

Nemetschek SE - Overview
Nemetschek SE - Business segments
Nemetschek SE - Key news
Nemetschek SE - Key offerings
Nemetschek SE - Segment focus
SWOT

15.16 Planon Group

Planon Group - Overview
Planon Group - Product / Service
Planon Group - Key offerings
SWOT

15.17 Ricoh Co. Ltd.

Ricoh Co. Ltd. - Overview
Ricoh Co. Ltd. - Business segments
Ricoh Co. Ltd. - Key news
Ricoh Co. Ltd. - Key offerings
Ricoh Co. Ltd. - Segment focus
SWOT

15.18 Yardi Systems Inc.

Yardi Systems Inc. - Overview
Yardi Systems Inc. - Product / Service
Yardi Systems Inc. - Key offerings
SWOT

16. Appendix

16.1 Scope of the report

Market definition
Objectives
Notes and caveats

16.2 Inclusions and exclusions checklist

Inclusions checklist
Exclusions checklist

16.3 Currency conversion rates for US$

16.4 Research methodology

16.5 Data procurement

Information sources

16.6 Data validation

16.7 Validation techniques employed for market sizing

16.8 Data synthesis

16.9 360 degree market analysis

16.10 List of abbreviations

Research Methodology

Technavio presents a detailed picture of the market by way of study, synthesis, and summation of data from multiple sources. The analysts have presented the various facets of the market with a particular focus on identifying the key industry influencers. The data thus presented is comprehensive, reliable, and the result of extensive research, both primary and secondary.

INFORMATION SOURCES

Primary sources

  • Manufacturers and suppliers
  • Channel partners
  • Industry experts
  • Strategic decision makers

Secondary sources

  • Industry journals and periodicals
  • Government data
  • Financial reports of key industry players
  • Historical data
  • Press releases

DATA ANALYSIS

Data Synthesis

  • Collation of data
  • Estimation of key figures
  • Analysis of derived insights

Data Validation

  • Triangulation with data models
  • Reference against proprietary databases
  • Corroboration with industry experts

REPORT WRITING

Qualitative

  • Market drivers
  • Market challenges
  • Market trends
  • Five forces analysis

Quantitative

  • Market size and forecast
  • Market segmentation
  • Geographical insights
  • Competitive landscape

Interested in this report?

Get your sample now to see our research methodology and insights!

Download Now

Frequently Asked Questions

Workspace Management Software market growth will increase by USD 5316.6 million during 2026-2030.

The Workspace Management Software market is expected to grow at a CAGR of 22.6% during 2026-2030.

Workspace Management Software market is segmented by Deployment (Cloud-based, On-premises) Application (IT and telecom, Retail and e-commerce, Healthcare, Others) Product (Desktop software, Web-based software, Mobile applications)

AgilQuest Corp., AppiXoft, Asure Software Inc., Citrix Systems Inc., Condeco Group Ltd., FM Systems Group LLC, IBM Corp., iOFFICE LP, Ivanti Software Inc., Matrix42 GmbH, MRI Software LLC, Nemetschek SE, NFS Technology Group, OfficeSpace Software, Inc., Planon Group, Ricoh Co. Ltd., Vega Technology Ltd., Yardi Systems Inc. are a few of the key vendors in the Workspace Management Software market.

North America will register the highest growth rate of 39.3% among the other regions. Therefore, the Workspace Management Software market in North America is expected to garner significant business opportunities for the vendors during the forecast period.

US, Canada, Mexico, China, Japan, India, South Korea, Australia, Indonesia, Germany, UK, France, Italy, Spain, The Netherlands, Brazil, Argentina, Colombia, South Africa, Saudi Arabia, UAE, Egypt, Turkey

  • Strategic convergence of sustainability and workspace optimization is the driving factor this market.

The Workspace Management Software market vendors should focus on grabbing business opportunities from the Deployment segment as it accounted for the largest market share in the base year.