
Zero-Defect Manufacturing Systems Market Size and Growth Forecast 2026-2030
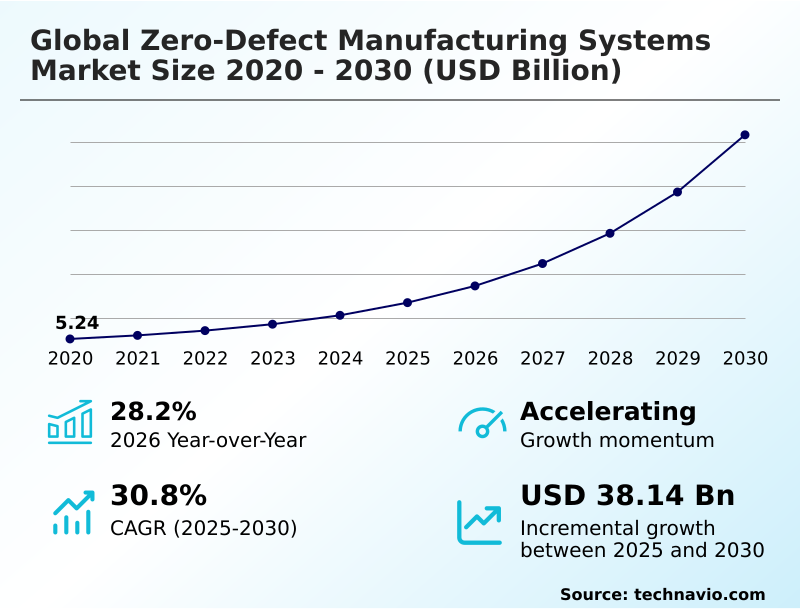
The Zero-Defect Manufacturing Systems Market size was valued at USD 13.49 billion in 2025 growing at a CAGR of 30.8% during the forecast period 2026-2030.
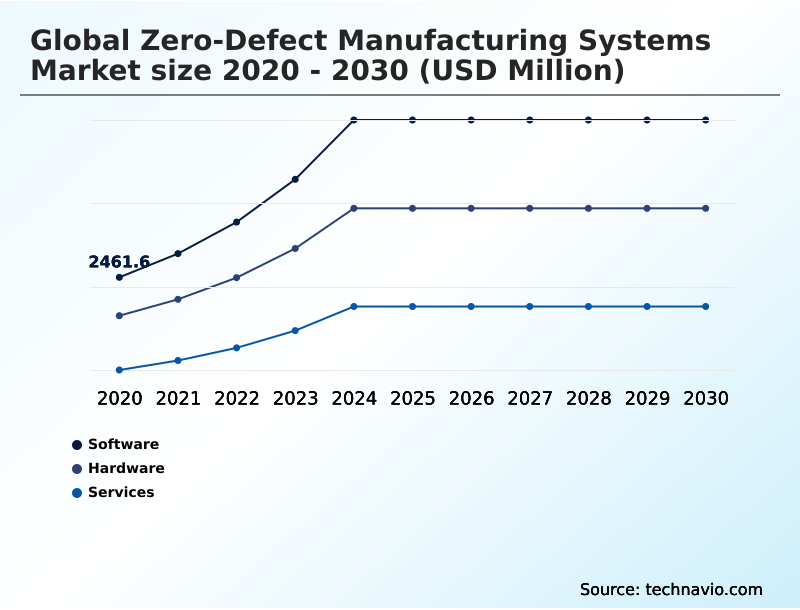
APAC accounts for 39.5% of incremental growth during the forecast period. The Software segment by Component was valued at USD 5.04 billion in 2024, while the Discrete industries segment holds the largest revenue share by End-user.
The market is projected to grow by USD 46.40 billion from 2020 to 2030, with USD 38.14 billion of the growth expected during the forecast period of 2025 to 2030.
Get Key Insights on Market Forecast (PDF) Request Free Sample
Zero-Defect Manufacturing Systems Market Overview
The Zero-defect Manufacturing Systems Market is driven by the industrial necessity for absolute precision, with a notable year-over-year growth of 28.2%. This expansion is not merely about production speed but about embedding quality assurance directly into manufacturing workflows through real-time monitoring and data analytics. The convergence of AI and machine learning algorithms with the industrial internet of things (IIoT) allows for predictive maintenance and autonomous quality management. For instance, in a high-volume automotive powertrain facility, deploying computer vision systems integrated with tactile robotics for inline inspection can reduce micro-fracture defects in cast components, a critical factor for drivetrain reliability. This use of advanced metrology and automated feedback loops, governed by standards like ISO 9001, is essential. The APAC region is a significant contributor to this growth, accounting for nearly 39.5% of the incremental expansion, fueled by its vast electronics and automotive sectors. This shift towards data-driven decision-making and smart factory solutions highlights a move away from traditional statistical process control toward self-optimizing environments where quality is an inherent output, not a post-production check.
Drivers, Trends, and Challenges in the Zero-Defect Manufacturing Systems Market
The strategic implementation of zero-defect systems is reshaping industrial competition, moving beyond simple error detection to holistic process optimization. A key driver is the sustainability impact of zero-defect manufacturing, as reducing scrap rates with real-time analytics directly lowers energy consumption and material waste, aligning with frameworks like ISO 14001.
The role of computer vision in semiconductor quality control illustrates this, where automated optical inspection identifies nanometer-scale defects on wafers, a task impossible for human inspectors. This application of AI for predictive quality in discrete manufacturing depends on overcoming data scarcity with synthetic data, often achieved through generative AI for rare defect mode simulation.
For process industries, the focus is on the digital twin for process industry optimization, maintaining ideal parameters for chemical reactions or pharmaceutical batches. A significant challenge remains in integrating legacy systems with IIoT platforms, a problem partially addressed by standards like OPC UA for interoperability in smart factories.
Decision-makers conducting a cost-benefit analysis of automated inspection systems find that while initial CAPEX is high, the ROI of zero-defect systems in automotive assembly or aerospace, where the cost of failure is catastrophic, is compelling.
Achieving closed-loop control for dimensional accuracy in aerospace or real-time monitoring for pharmaceutical process control requires a workforce that closes the skills gap in data science for manufacturing, a crucial factor for achieving total quality management through automation.
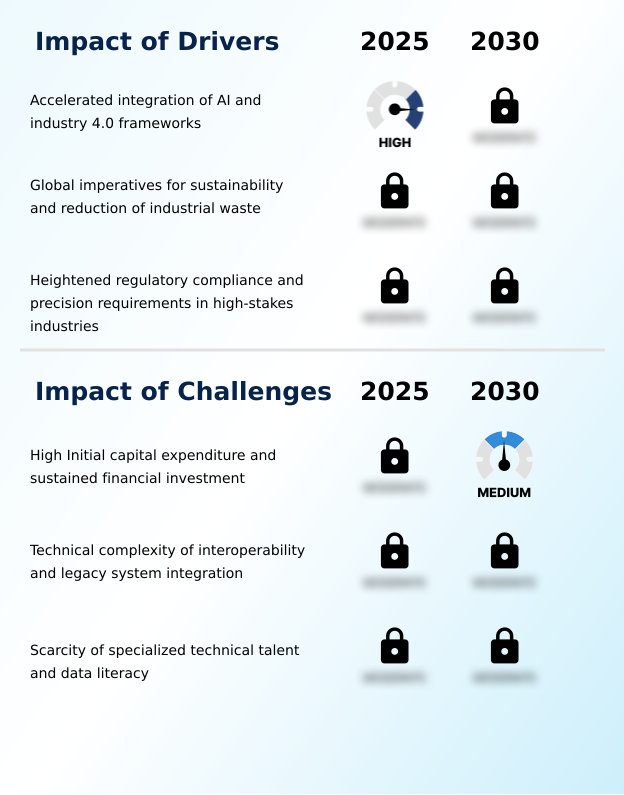
Primary Growth Driver: The accelerated integration of AI and Industry 4.0 frameworks is the primary driver propelling the market, enabling a shift from descriptive analytics to predictive and prescriptive quality control capabilities.
The accelerated integration of AI and machine learning algorithms within Industry 4.0 frameworks is the central driver.
This enables a move from reactive inspection to predictive and prescriptive quality assurance, which is essential for high-precision manufacturing in aerospace and medical devices.
The global imperative for sustainability also acts as a powerful catalyst, as eliminating defects at the source directly reduces material waste and energy consumption.
Furthermore, heightened regulatory requirements for traceability and compliance, such as those mandated by the FDA, necessitate the digital thread integration and real-time process control that these systems provide.
The push for operational excellence frameworks is particularly evident in APAC, which accounts for 39.5% of the market's incremental growth, as manufacturers in the region seek to solidify their competitive advantage through superior quality.
Emerging Market Trend: The integration of generative AI for creating synthetic defect data is a significant trend, addressing the challenge of training machine learning models in high-quality production environments with scarce failure data.
A primary trend is the shift toward edge intelligence, where high-performance computing is deployed at the data source, enabling sub-millisecond decisions essential for high-speed production lines in sectors like semiconductor fabrication.
This trend is complemented by the use of generative AI for synthetic data generation, which allows machine learning models to be trained on realistic but simulated defect patterns, overcoming the paradox of learning to identify rare failures. Another key development is the proliferation of bidirectional, closed-loop digital twins.
These go beyond mere monitoring to actively control physical operations, using real-time sensor fusion to predict deviations and autonomously adjust machine parameters. This is particularly vital for maintaining absolute dimensional accuracy in the discrete industries segment, which sees higher adoption rates for such advanced control systems.
Key Industry Challenge: High initial capital expenditure and the need for sustained financial investment for hardware, software, and data infrastructure represent a key challenge, particularly for small and medium-sized enterprises.
A significant challenge is the high initial capital expenditure required for implementation, which acts as a barrier for many small and medium-sized enterprises. Technical complexity, particularly in brownfield system integration, presents another hurdle.
Manufacturers often face protocol fragmentation, with legacy machinery using proprietary standards incompatible with modern IIoT protocols like OPC UA, which impedes the seamless data flow required for effective data analytics. This creates data silos and prevents a holistic view of the production process. Compounding these issues is a critical scarcity of specialized technical talent.
A recent study found that the lack of qualified data analysts has delayed autonomous quality system deployment in over 40% of surveyed North American facilities, highlighting a significant human capital constraint that limits the effectiveness of these advanced systems.
Explore Full Market Dynamics Analysis Request Free Sample
Zero-Defect Manufacturing Systems Market Segmentation
The zero-defect manufacturing systems industry research report provides comprehensive data including region-wise segment analysis, with forecasts and analysis for the period 2026-2030, as well as historical data from 2020-2024 for the following segments.
Component Segment Analysis
The software segment is estimated to witness significant growth during the forecast period.
The software segment provides the cognitive core for the Zero-defect Manufacturing Systems Market, enabling a shift from reactive to predictive quality assurance.
These platforms leverage AI and machine learning algorithms for advanced data analytics, processing vast streams of industrial data to anticipate process drifts before they cause non-conforming products.
The integration of digital twin technology is critical, allowing engineers to simulate and optimize production in a risk-free virtual environment, a process essential for validating changes without physical implementation.
This capability is enhanced by generative artificial intelligence, which can suggest corrective actions autonomously. These systems also bridge manufacturing execution systems with enterprise resource planning, ensuring quality standards are maintained across the hierarchy.
Accounting for approximately 47% of the market, this segment's growth underscores the industry's reliance on intelligent software for total quality management.
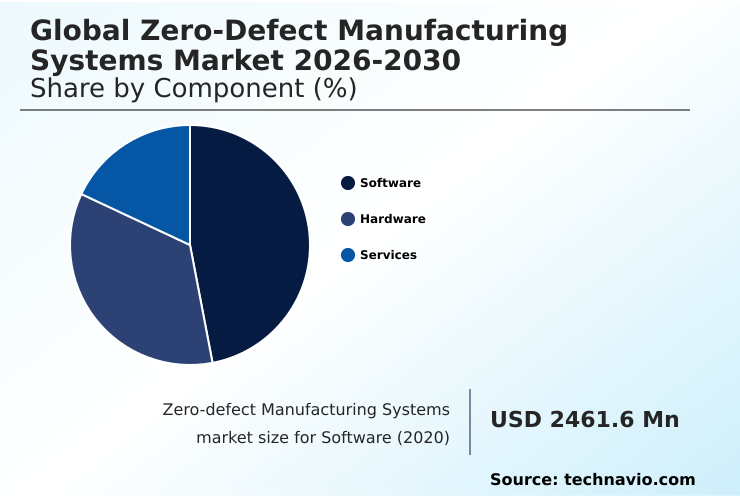
The Software segment was valued at USD 5.04 billion in 2024 and showed a gradual increase during the forecast period.
Zero-Defect Manufacturing Systems Market by Region: APAC Leads with 39.5% Growth Share
APAC is estimated to contribute 39.5% to the growth of the global market during the forecast period.
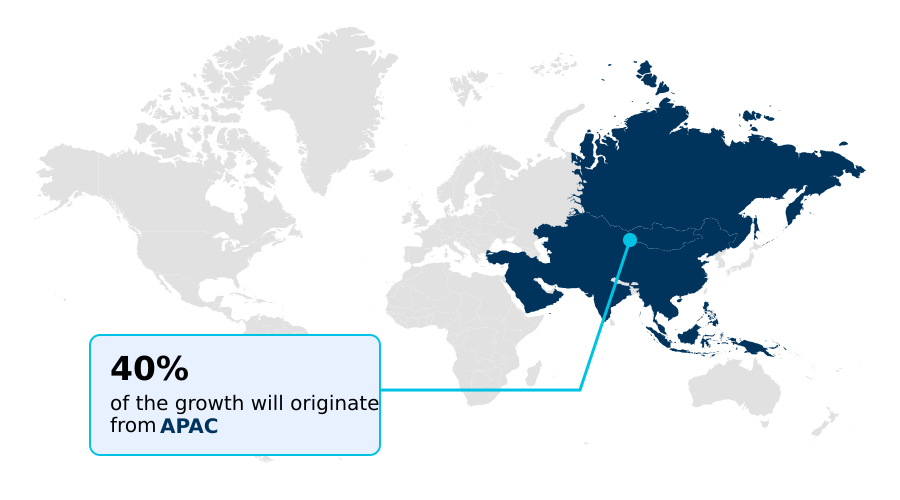
APAC is the primary locus of growth, contributing 39.5% of the market's incremental expansion and exhibiting the fastest regional growth rate.
This is driven by massive industrial scale in China and Japan, where high-precision manufacturing for electronics and automotive sectors demands robust quality management systems.
In this region, large-scale investments in 5G and industrial internet of things (IIoT) infrastructure support the deployment of sensor fusion networks essential for real-time process control.
North America follows, with its market characterized by high technological maturity and a focus on aerospace and medical device applications where traceability and compliance with FDA or FAA regulations are non-negotiable.
Europe, particularly Germany, leverages its Industry 4.0 leadership, integrating cyber-physical systems and advanced metrology to maintain its reputation for engineering excellence. These regional dynamics highlight a global push toward operational excellence frameworks.
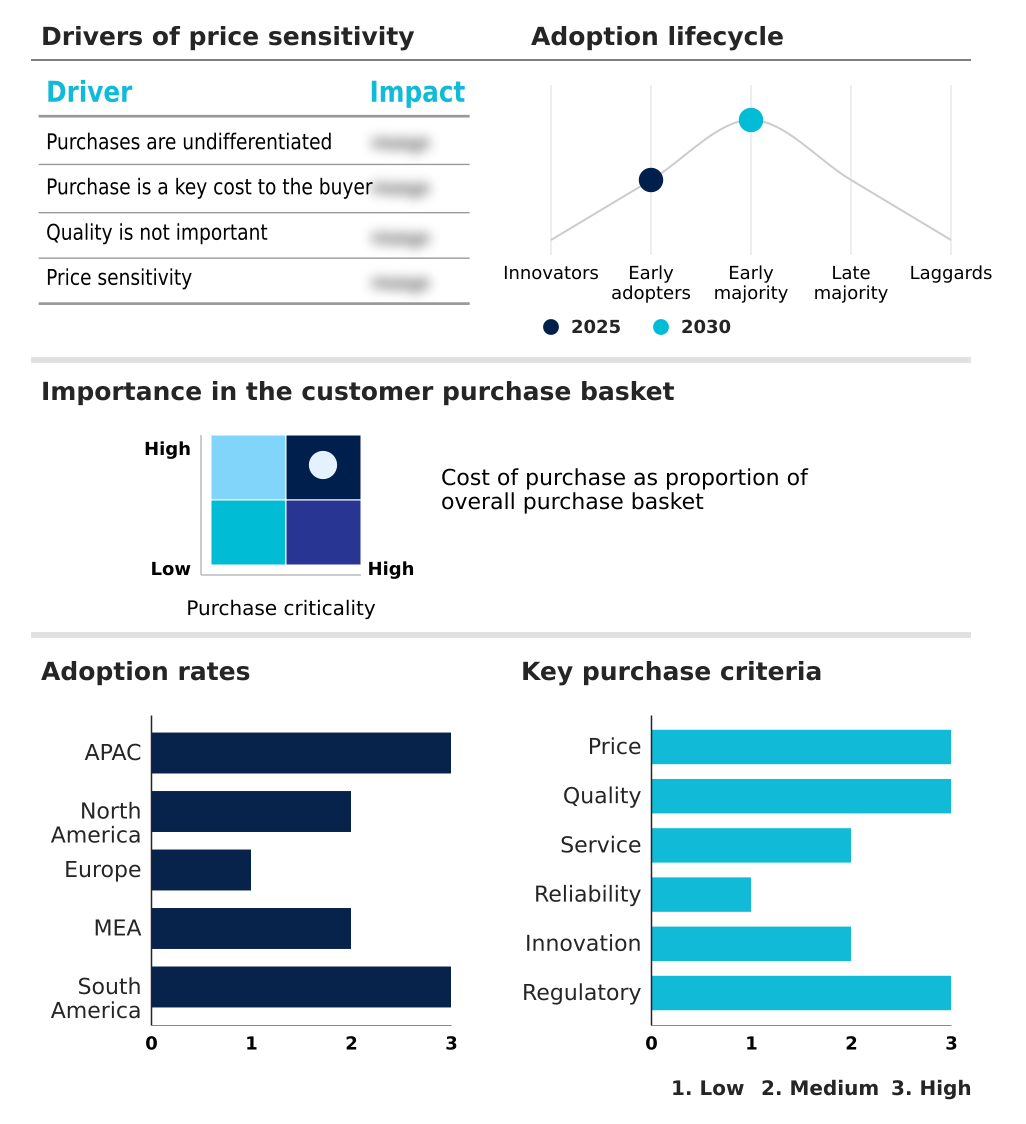
Customer Landscape Analysis for the Zero-Defect Manufacturing Systems Market
The zero-defect manufacturing systems market forecasting report includes the adoption lifecycle of the market, covering from the innovator’s stage to the laggard’s stage. It focuses on adoption rates in different regions based on penetration. Furthermore, the zero-defect manufacturing systems market report also includes key purchase criteria and drivers of price sensitivity to help companies evaluate and develop their market growth analysis strategies.
Competitive Landscape of the Zero-Defect Manufacturing Systems Market
Companies are implementing various strategies, such as strategic alliances, partnerships, mergers and acquisitions, geographical expansion, and product/service launches, to enhance their presence in the zero-defect manufacturing systems market industry.
ABB Ltd. - Offers integrated robotics, automation controls, and smart platforms to enable high-precision, zero-defect operations, enhancing industrial productivity and quality assurance.
The industry research and growth report includes detailed analyses of the competitive landscape of the market and information about key companies, including:
- ABB Ltd.
- Advantech Co. Ltd.
- ATS Automation Tooling Systems Inc.
- Carl Zeiss AG
- Dassault Systemes SE
- Emerson Electric Co.
- Hexagon AB
- Honeywell International Inc.
- ISRA VISION GmbH
- Keyence Corp.
- KUKA AG
- Marposs Spa
- Mitsubishi Electric Corp.
- National Instruments Corp.
- PTC Inc.
- Rockwell Automation Inc.
- SAP SE
- Schneider Electric SE
- Siemens AG
- Teradyne Inc.
Qualitative and quantitative analysis of companies has been conducted to help clients understand the wider business environment as well as the strengths and weaknesses of key industry players. Data is qualitatively analyzed to categorize companies as pure play, category-focused, industry-focused, and diversified; it is quantitatively analyzed to categorize companies as dominant, leading, strong, tentative, and weak.
Recent Developments in the Zero-Defect Manufacturing Systems Market
- In April, 2025, Siemens Digital Industries Software launched an updated generative artificial intelligence toolset within its industrial operations portfolio that allows manufacturers to simulate millions of process variables for defect-free output.
- In August, 2025, Rockwell Automation introduced a modular sustainability dashboard integrated into its production control hardware, providing real-time tracking of the carbon cost associated with manufacturing defects.
- In September, 2025, Advantech introduced a new series of ultra-low-latency edge servers designed to process high-resolution inspection data for high-speed robotic assembly lines.
- In November, 2025, Boeing announced the full integration of a real-time digital thread across its primary assembly lines, using advanced sensors to verify composite material integrity during the curing process.
Research Analyst Overview: Zero-Defect Manufacturing Systems Market
The market's 28.2% year-over-year growth signals a fundamental shift in manufacturing strategy, where real-time monitoring and data analytics are no longer optional but core to competitive survival. Boardroom decisions increasingly center on justifying CAPEX for technologies like a closed-loop digital twin, weighing the investment against the high cost of recalls and non-compliance with standards such as ISO 9001.
Implementation involves a sophisticated interplay of hardware and software: robotic actuators and high-resolution imaging systems provide raw data, while AI and machine learning algorithms, supported by high-speed connectivity, enable predictive maintenance. The adoption of computer vision and advanced metrology for sub-micron inspection is critical.
This entire ecosystem, from manufacturing execution systems to programmable logic controllers, is orchestrated to achieve proactive quality control. The move toward generative artificial intelligence for synthetic data generation further enhances these systems, allowing them to learn from simulated defects, a crucial capability in high-yield environments where real-world failures are rare.
Dive into Technavio’s robust research methodology, blending expert interviews, extensive data synthesis, and validated models for unparalleled Zero-Defect Manufacturing Systems Market insights. See full methodology.
| Market Scope | |
|---|---|
| Page number | 311 |
| Base year | 2025 |
| Historic period | 2020-2024 |
| Forecast period | 2026-2030 |
| Growth momentum & CAGR | Accelerate at a CAGR of 30.8% |
| Market growth 2026-2030 | USD 38144.4 million |
| Market structure | Fragmented |
| YoY growth 2025-2026(%) | 28.2% |
| Key countries | China, Japan, India, South Korea, Australia, Indonesia, US, Canada, Mexico, Germany, UK, France, Italy, Spain, The Netherlands, Saudi Arabia, UAE, South Africa, Israel, Turkey, Brazil, Argentina and Colombia |
| Competitive landscape | Leading Companies, Market Positioning of Companies, Competitive Strategies, and Industry Risks |
Zero-Defect Manufacturing Systems Market: Key Questions Answered in This Report
-
What is the expected growth of the Zero-Defect Manufacturing Systems Market between 2026 and 2030?
-
The Zero-Defect Manufacturing Systems Market is expected to grow by USD 38.14 billion during 2026-2030, registering a CAGR of 30.8%. Year-over-year growth in 2026 is estimated at 28.2%%. This acceleration is shaped by accelerated integration of ai and industry 4.0 frameworks, which is intensifying demand across multiple end-use verticals covered in the report.
-
-
What segmentation does the market report cover?
-
The report is segmented by Component (Software, Hardware, and Services), End-user (Discrete industries, and Process industries), Technology (AI and ML, Computer vision, Internet of things (IoT), and Digital twins) and Geography (APAC, North America, Europe, Middle East and Africa, South America). Among these, the Software segment is estimated to witness significant growth during the forecast period, driven by rising adoption across key application areas. Each segment includes detailed qualitative and quantitative analysis, along with historical data from 2020-2024 and forecasts through 2030 with year-over-year growth rates.
-
-
Which regions are analyzed in the report?
-
The report covers APAC, North America, Europe, Middle East and Africa and South America. APAC is estimated to contribute 39.5% to market growth during the forecast period. Country-level analysis includes China, Japan, India, South Korea, Australia, Indonesia, US, Canada, Mexico, Germany, UK, France, Italy, Spain, The Netherlands, Saudi Arabia, UAE, South Africa, Israel, Turkey, Brazil, Argentina and Colombia, with dedicated market size tables and year-over-year growth for each.
-
-
What are the key growth drivers and market challenges?
-
The primary driver is accelerated integration of ai and industry 4.0 frameworks, which is accelerating investment and industry demand. The main challenge is high initial capital expenditure and sustained financial investment, creating operational barriers for key market participants. The report quantifies the impact of each driver and challenge across 2026 and 2030 with comparative analysis.
-
-
Who are the major players in the Zero-Defect Manufacturing Systems Market?
-
Key vendors include ABB Ltd., Advantech Co. Ltd., ATS Automation Tooling Systems Inc., Carl Zeiss AG, Dassault Systemes SE, Emerson Electric Co., Hexagon AB, Honeywell International Inc., ISRA VISION GmbH, Keyence Corp., KUKA AG, Marposs Spa, Mitsubishi Electric Corp., National Instruments Corp., PTC Inc., Rockwell Automation Inc., SAP SE, Schneider Electric SE, Siemens AG and Teradyne Inc.. The report provides qualitative and quantitative analysis categorizing companies as dominant, leading, strong, tentative, and weak based on their market positioning. Company profiles include business segment analysis, SWOT assessment, key offerings, and recent strategic developments.
-
Zero-Defect Manufacturing Systems Market Research Insights
Market dynamics are shaped by the drive for operational excellence frameworks, compelling manufacturers to adopt predictive quality assurance over traditional statistical process control. The discrete industries segment outpaces the process industries segment in adoption, driven by complex assembly in automotive and aerospace.
A key challenge is brownfield system integration, where protocol fragmentation between legacy equipment and modern IIoT platforms hinders data-driven decision-making. Standards like OPC UA are crucial for creating interoperable smart factory solutions. For instance, a facility upgrading to autonomous quality management must ensure its new sensor networks can communicate with older programmable logic controllers.
This emphasis on connectivity is reflected in spending, where software investments for analytics and control are growing faster than hardware investments, underscoring the shift toward intelligent, self-optimizing environments for first-pass yield improvement.
We can help! Our analysts can customize this zero-defect manufacturing systems market research report to meet your requirements.
 RIA -
RIA - 
