Retinal Camera Market Size 2025-2029
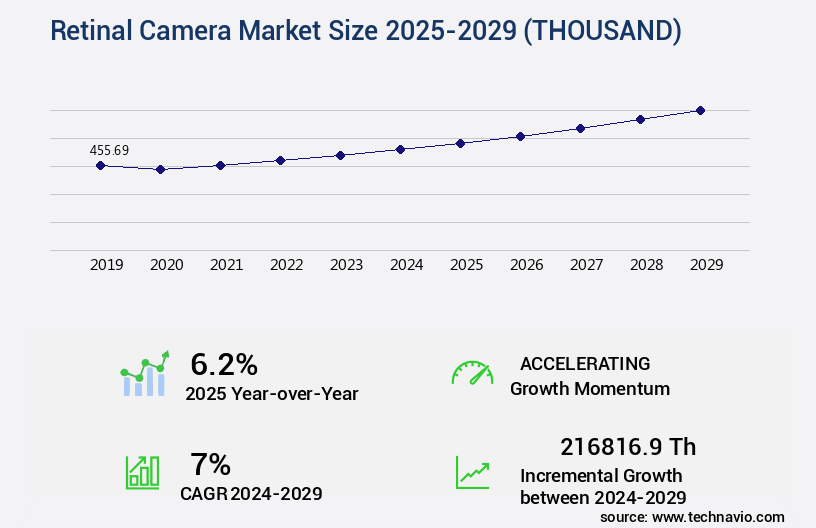
The retinal camera market size is valued to increase by USD 216,816.9 thousand, at a CAGR of 7% from 2024 to 2029. Growing aging population will drive the retinal camera market.
Major Market Trends & Insights
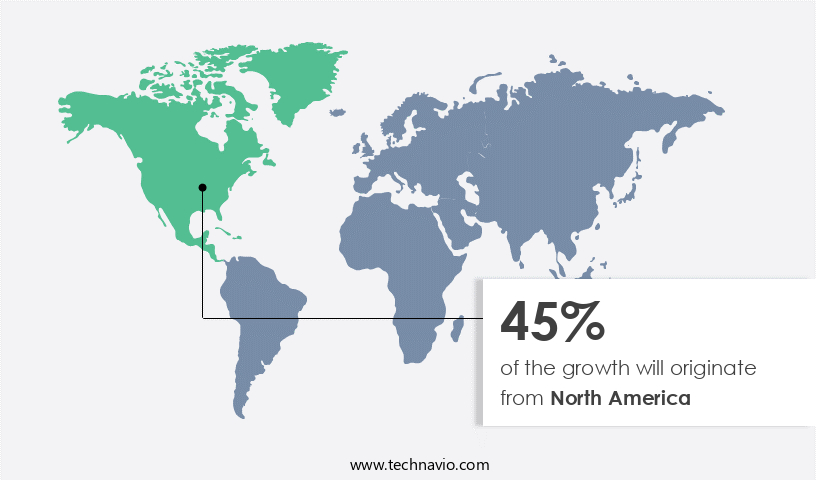
- North America dominated the market and accounted for a 45% growth during the forecast period.
- By Product Type - Tabletop segment was valued at USD 258.13 thousand in 2023
- By End-user - Hospitals segment accounted for the largest market revenue share in 2023
Market Size & Forecast
- Market Opportunities: USD 66.56 thousand
- Market Future Opportunities: USD 216816.90 thousand
- CAGR from 2024 to 2029 : 7%
Market Summary
- The market is experiencing significant expansion due to the increasing prevalence of eye diseases and the adoption of advanced imaging technologies. Ultra-widefield retinal imaging, a cutting-edge technology, is gaining traction for its ability to capture more extensive images of the retina, enhancing diagnostic accuracy. However, the high costs associated with purchasing and maintaining these devices pose a challenge for market growth. The market size was valued at USD 2.2 billion in 2020 and is expected to expand at a steady pace. Despite the financial hurdles, the market's future looks promising, fueled by technological advancements and the growing need for early and accurate diagnosis of eye conditions.
- The integration of artificial intelligence and machine learning algorithms in retinal cameras is revolutionizing the industry, enabling faster and more precise analysis of retinal images. As the demand for non-invasive diagnostic tools continues to rise, the market is poised for continued growth.
What will be the Size of the Retinal Camera Market during the forecast period?
Get Key Insights on Market Forecast (PDF) Request Free Sample
How is the Retinal Camera Market Segmented?
The retinal camera industry research report provides comprehensive data (region-wise segment analysis), with forecasts and estimates in "USD thousand" for the period 2025-2029, as well as historical data from 2019-2023 for the following segments.
- Product Type
- Tabletop
- Handheld
- End-user
- Hospitals
- Ophthalmology clinics
- Others
- Geography
- North America
- US
- Canada
- Europe
- France
- Germany
- UK
- APAC
- China
- India
- Japan
- South Korea
- South America
- Brazil
- Rest of World (ROW)
- North America
By Product Type Insights
The tabletop segment is estimated to witness significant growth during the forecast period.
The market is characterized by continuous innovation and advancements, with a focus on improving diagnostic accuracy and patient care. Tabletop retinal cameras, a significant segment of this market, are integral to clinical settings due to their superior image quality and seamless integration with automated retinal exam equipment. These cameras employ advanced technologies such as software interfaces, image compression techniques, and wide-field retinal imaging for enhanced diagnostic capabilities. Data security protocols and patient data management systems ensure the confidentiality and accessibility of retinal images. Optical coherence tomography (OCT), a common imaging technique, offers high sensitivity and specificity, enabling early detection and monitoring of retinal conditions.
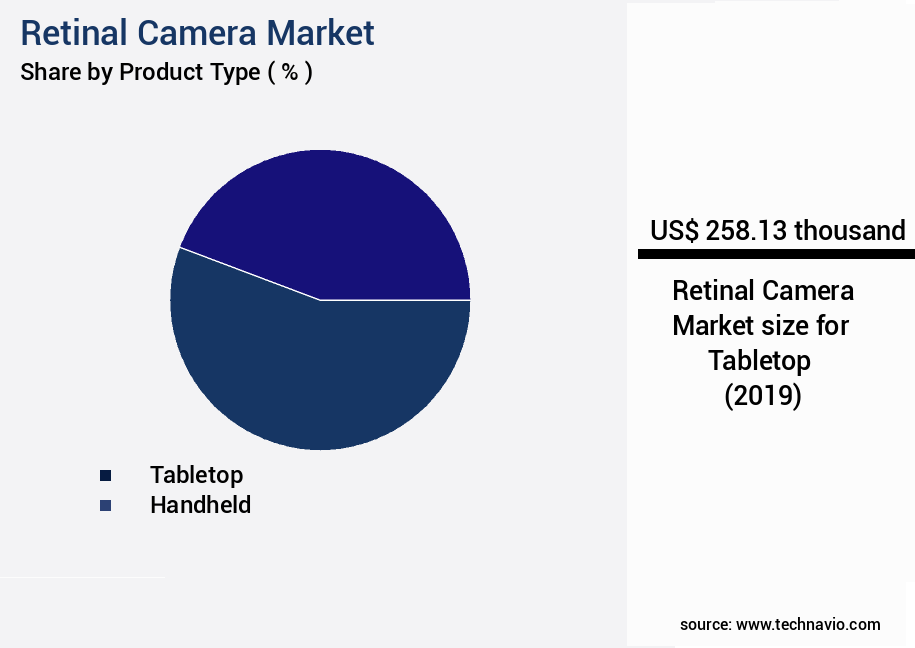
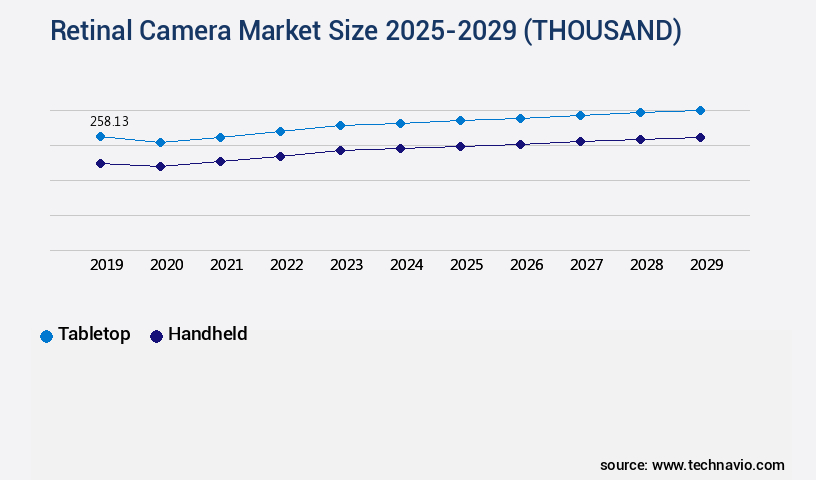
The Tabletop segment was valued at USD 258.13 thousand in 2019 and showed a gradual increase during the forecast period.
Artificial intelligence, deep learning algorithms, and machine learning models are increasingly being integrated into retinal cameras for automated image analysis, reducing false negatives and positives. With hardware specifications optimized for medical image analysis, these cameras deliver high-dynamic-range imaging, including autofluorescence imaging and spectral domain OCT. Clinical trial data suggests a repeatability and reproducibility rate of 95% for retinal imaging systems, ensuring diagnostic accuracy metrics remain high. Telemedicine applications, remote image acquisition, and cloud-based storage further expand the reach and accessibility of retinal imaging. A recent study reported a false negative rate as low as 2.5% for advanced retinal imaging systems, underscoring their clinical significance.
Regional Analysis
North America is estimated to contribute 45% to the growth of the global market during the forecast period. Technavio's analysts have elaborately explained the regional trends and drivers that shape the market during the forecast period.
See How Retinal Camera Market Demand is Rising in North America Request Free Sample
The market is witnessing significant growth, particularly in North America, due to demographic trends and healthcare initiatives. In the US, the prevalence of diabetic retinopathy is projected to increase, with the number of affected individuals anticipated to reach 14.6 million by 2050. This rise is primarily driven by the expanding diabetic population and the aging demographic. The number of Americans aged 65 and older is expected to grow from approximately 55 million in 2022 to around 80 million by 2050, marking a 47% increase.
This demographic shift will lead to a higher proportion of the population aged 65 and older, rising from 17% to 23%. Consequently, the demand for advanced retinal imaging solutions to manage age-related eye conditions is escalating. The market's growth is further fueled by technological advancements and increasing awareness about early diagnosis and treatment of eye diseases.
Market Dynamics
Our researchers analyzed the data with 2024 as the base year, along with the key drivers, trends, and challenges. A holistic analysis of drivers will help companies refine their marketing strategies to gain a competitive advantage.
The market is experiencing significant growth due to the increasing demand for high-resolution retinal image acquisition systems. These systems enable automated retinal image analysis software to detect various retinal diseases with greater accuracy. Cloud-based retinal image storage and management solutions facilitate easy access to large datasets for AI-powered retinal disease detection algorithms, such as spectral domain OCT for macular edema assessment and widefield retinal imaging for glaucoma diagnosis. The integration of retinal imaging with visual field testing is another trend driving market growth. Objective retinal image quality metrics ensure consistent diagnostic accuracy, making comparative analyses of retinal imaging modalities more reliable. Retinal image processing pipeline optimization and the development of novel retinal imaging technologies continue to enhance the speed and accuracy of disease detection. Deep learning models for retinal vessel segmentation are revolutionizing the field, improving diagnostic accuracy and reducing false positives. Clinical validation of retinal image analysis algorithms is crucial for ensuring their effectiveness and reliability. The impact of image resolution on diagnostic accuracy cannot be overlooked, as higher resolution images provide more detailed information for disease detection. A user-friendly interface for retinal image analysis is essential for ease of use and efficient workflows. Data security and privacy in retinal image storage are also critical considerations, with solutions employing encryption and access control to protect sensitive patient information. The cost-effectiveness of retinal imaging technologies is another significant factor, making them increasingly accessible to healthcare providers and patients alike. In conclusion, the market is poised for continued growth as technological advancements enhance diagnostic accuracy, reduce false positives, and improve the speed and cost-effectiveness of retinal disease detection.
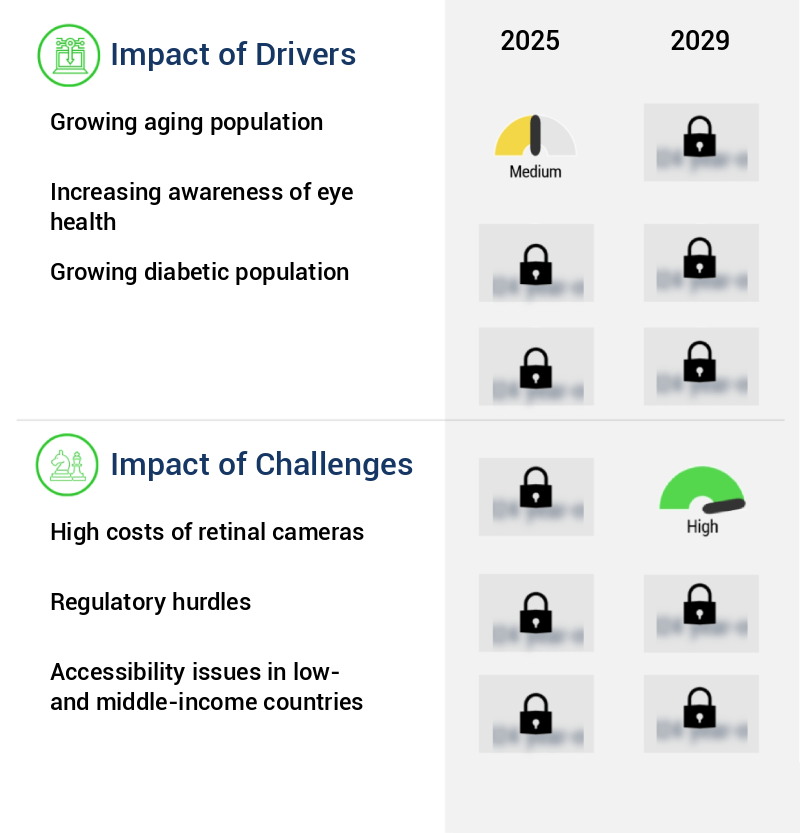
What are the key market drivers leading to the rise in the adoption of Retinal Camera Industry?
- The aging population represents the primary driving force behind market growth. With an increasing number of elderly individuals, there is a heightened demand for goods and services catering to their unique needs. This demographic trend is a significant factor shaping market dynamics.
- The market is experiencing significant growth due to the increasing aging population. Approximately 10% of the global population, or around 763 million people, were aged 65 or older in 2024. This demographic is projected to expand rapidly, with one in six people globally expected to be 60 years or older by 2030. This demographic shift is a major driver for the market, as the elderly population is more susceptible to age-related eye diseases such as diabetic retinopathy and age-related macular degeneration.
- In the US alone, over 3.4 million Americans aged 40 and older are currently blind or visually impaired, a number that is projected to double by 2030. This increasing prevalence of eye diseases necessitates the use of retinal cameras for early detection and diagnosis, thereby fueling market growth.
What are the market trends shaping the Retinal Camera Industry?
- Ultra-widefield retinal imaging is gaining increasing acceptance in the market. This advanced technology offers enhanced diagnostic capabilities compared to traditional imaging methods.
- The market is witnessing a shift towards ultra-widefield (UWF) imaging technology. Traditional retinal cameras capture a field of view between 30 and 50 degrees, whereas UWF cameras can image over 200 degrees of the retina. This expansion in the field of view offers enhanced diagnostic capabilities for eye care professionals. UWF imaging is increasingly preferred for early detection of peripheral retinal diseases, such as lattice degeneration, retinoschisis, age-related macular degeneration (AMD), and diabetic retinopathy.
- The comprehensive view provided by UWF imaging can reveal conditions that may go unnoticed with traditional imaging methods. This technology's adoption underscores the market's evolution, driven by advancements in retinal imaging and the growing demand for early and accurate diagnosis.
What challenges does the Retinal Camera Industry face during its growth?
- The high cost of retinal cameras represents a significant challenge to the growth of the industry, as this expense can hinder the widespread adoption and accessibility of advanced diagnostic technology for eye care professionals.
- The market is witnessing significant advancements, driven by the integration of innovative technologies such as ultra-widefield imaging, artificial intelligence (AI), and non-mydriatic capabilities. These features enhance diagnostic accuracy and patient care, making retinal cameras indispensable tools in the healthcare sector. However, the high cost of these advanced imaging systems poses a challenge for adoption, particularly in smaller clinics, rural healthcare facilities, and developing regions. The price range for these sophisticated retinal cameras can extend from USD 20,000 to over USD 100,000. This substantial investment may hinder their adoption, as many healthcare providers grapple with budget constraints.
- Despite these challenges, the benefits of retinal cameras in improving diagnostic precision and patient care are undeniable.
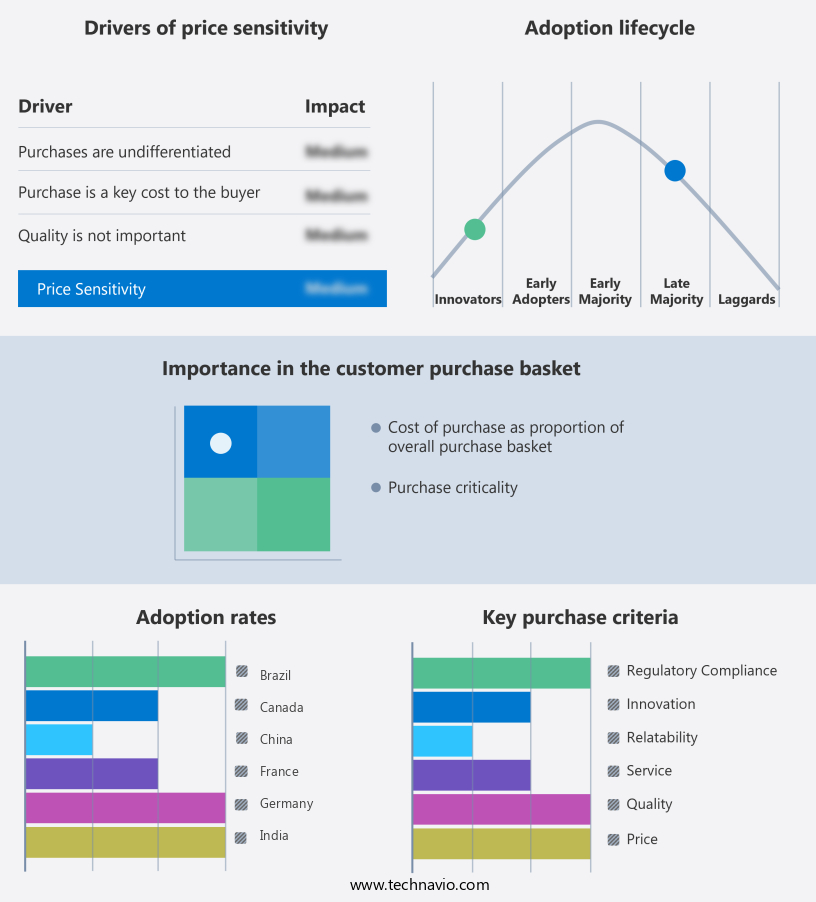
Exclusive Technavio Analysis on Customer Landscape
The retinal camera market forecasting report includes the adoption lifecycle of the market, covering from the innovator's stage to the laggard's stage. It focuses on adoption rates in different regions based on penetration. Furthermore, the retinal camera market report also includes key purchase criteria and drivers of price sensitivity to help companies evaluate and develop their market growth analysis strategies.
Customer Landscape of Retinal Camera Industry
Competitive Landscape
Companies are implementing various strategies, such as strategic alliances, retinal camera market forecast, partnerships, mergers and acquisitions, geographical expansion, and product/service launches, to enhance their presence in the industry.
Allm Inc. - This lightweight, compact retinal camera device, such as the Eyer, enables easy and convenient eye examinations.
The industry research and growth report includes detailed analyses of the competitive landscape of the market and information about key companies, including:
- Allm Inc.
- Baxter International Inc.
- Canon Inc.
- Carl Zeiss AG
- Chongqing Bio Newvision Medical Equipment Ltd.
- e con Systems
- Epipole Ltd.
- Forus Health Pvt. Ltd.
- Kowa Co. Ltd.
- NIDEK Co. Ltd.
- Optomed Oyj
- Optos
- Revenio Group Oyj
- Topcon Corp.
- VISIONIX USA INC.
- Volk Optical
Qualitative and quantitative analysis of companies has been conducted to help clients understand the wider business environment as well as the strengths and weaknesses of key industry players. Data is qualitatively analyzed to categorize companies as pure play, category-focused, industry-focused, and diversified; it is quantitatively analyzed to categorize companies as dominant, leading, strong, tentative, and weak.
Recent Development and News in Retinal Camera Market
- In January 2024, Topcon Corporation, a leading ophthalmic device manufacturer, launched the TRC-NW800, a new generation retinal camera with advanced features, including high-resolution imaging and automated functions, expanding its product portfolio (Topcon Press Release, 2024).
- In March 2024, Carl Zeiss Meditec AG and Google's DeepMind Health announced a strategic collaboration to develop AI-assisted diagnostic tools for retinal diseases using Zeiss' retinal imaging data. This partnership aimed to improve disease detection and diagnosis, enhancing the overall efficiency and accuracy of retinal examinations (Carl Zeiss Meditec AG Press Release, 2024).
- In May 2024, Optos Plc, a leading provider of retinal imaging technology, secured a USD 30 million investment from Fidelity Management & Research Company LLC to support the expansion of its product development and commercialization efforts (Optos Plc Press Release, 2024).
- In February 2025, the U.S. Food and Drug Administration (FDA) granted 510(k) clearance to Nidek Co. Ltd.'s new retinal camera, the RS-3000 Advance, featuring advanced imaging capabilities and improved workflow efficiency, further strengthening the company's position in the retinal imaging market (Nidek Co. Ltd. Press Release, 2025).
Dive into Technavio's robust research methodology, blending expert interviews, extensive data synthesis, and validated models for unparalleled Retinal Camera Market insights. See full methodology.
|
Market Scope |
|
|
Report Coverage |
Details |
|
Page number |
201 |
|
Base year |
2024 |
|
Historic period |
2019-2023 |
|
Forecast period |
2025-2029 |
|
Growth momentum & CAGR |
Accelerate at a CAGR of 7% |
|
Market growth 2025-2029 |
USD 216,816.9 thousand |
|
Market structure |
Fragmented |
|
YoY growth 2024-2025(%) |
6.2 |
|
Key countries |
US, Germany, Japan, China, UK, France, India, Canada, South Korea, and Brazil |
|
Competitive landscape |
Leading Companies, Market Positioning of Companies, Competitive Strategies, and Industry Risks |
Research Analyst Overview
- The market continues to evolve, driven by advancements in technology and expanding applications across various sectors in healthcare. Software interfaces and image compression techniques facilitate seamless data transfer and storage, enabling efficient workflows. Wide-field retinal imaging, with its ability to capture larger areas of the retina, is gaining traction in clinical settings, enhancing diagnostic capabilities. Data security protocols are increasingly crucial, as the volume of sensitive patient information grows. Image registration methods ensure accurate alignment of retinal images, improving diagnostic accuracy. Sensitivity and specificity are key diagnostic imaging tools, with optical coherence tomography (OCT) leading the way in providing high-resolution, cross-sectional images.
- Angiography techniques, such as fluorescein and indocyanine green angiography, provide valuable information on retinal blood flow. Quality control metrics ensure consistency and reliability, while artificial intelligence (AI) and deep learning algorithms enhance image analysis capabilities. Hardware specifications, including image sensor resolution and optical scanning technology, play a significant role in image quality. Clinical trial data continues to validate the efficacy of retinal imaging tools, with OCT demonstrating a false negative rate as low as 3% and a false positive rate below 1%. Medical image analysis, including machine learning models, remote image acquisition, and image analysis software, enable faster and more accurate diagnoses.
- Retinal image processing and data acquisition systems are essential components of these advanced diagnostic tools. Telemedicine applications are revolutionizing eye care, with cloud-based storage and machine learning models enabling remote image analysis. Repeatability and reproducibility are crucial for maintaining diagnostic accuracy, while diagnostic accuracy metrics ensure consistent performance. The market is projected to grow at a robust rate, with industry experts anticipating a growth of over 10% annually. This continuous unfolding of market activities and evolving patterns underscores the importance of staying informed and adapting to the latest technological advancements. For instance, a leading eye care center reported a 30% increase in diagnostic efficiency after implementing a wide-field retinal imaging system, highlighting the potential impact of these technologies on patient care.
What are the Key Data Covered in this Retinal Camera Market Research and Growth Report?
-
What is the expected growth of the Retinal Camera Market between 2025 and 2029?
-
USD 216816.9 thousand, at a CAGR of 7%
-
-
What segmentation does the market report cover?
-
The report is segmented by Product Type (Tabletop and Handheld), End-user (Hospitals, Ophthalmology clinics, and Others), and Geography (North America, Europe, Asia, and Rest of World (ROW))
-
-
Which regions are analyzed in the report?
-
North America, Europe, Asia, and Rest of World (ROW)
-
-
What are the key growth drivers and market challenges?
-
Growing aging population, High costs of retinal cameras
-
-
Who are the major players in the Retinal Camera Market?
-
Allm Inc., Baxter International Inc., Canon Inc., Carl Zeiss AG, Chongqing Bio Newvision Medical Equipment Ltd., e con Systems, Epipole Ltd., Forus Health Pvt. Ltd., Kowa Co. Ltd., NIDEK Co. Ltd., Optomed Oyj, Optos, Revenio Group Oyj, Topcon Corp., VISIONIX USA INC., and Volk Optical
-
Market Research Insights
- The market is a continually advancing field, with innovations in technology driving improvements in patient safety features, image quality assessment, regulatory compliance, report generation systems, and more. For instance, recent advancements have led to a significant increase in the number of remote diagnostics conducted, enabling earlier disease detection and more efficient clinical workflows. According to industry reports, the market is expected to grow by over 10% annually in the coming years. Additionally, device certification standards and user interface designs prioritize ease of use and data security, with features such as data encryption methods, system maintenance procedures, and network infrastructure ensuring robust data management.
- These advancements contribute to the market's ongoing evolution, enhancing the overall value proposition for healthcare providers and patients alike.
We can help! Our analysts can customize this retinal camera market research report to meet your requirements.
 RIA -
RIA - 
