
Rodent Control Market Size 2025-2029
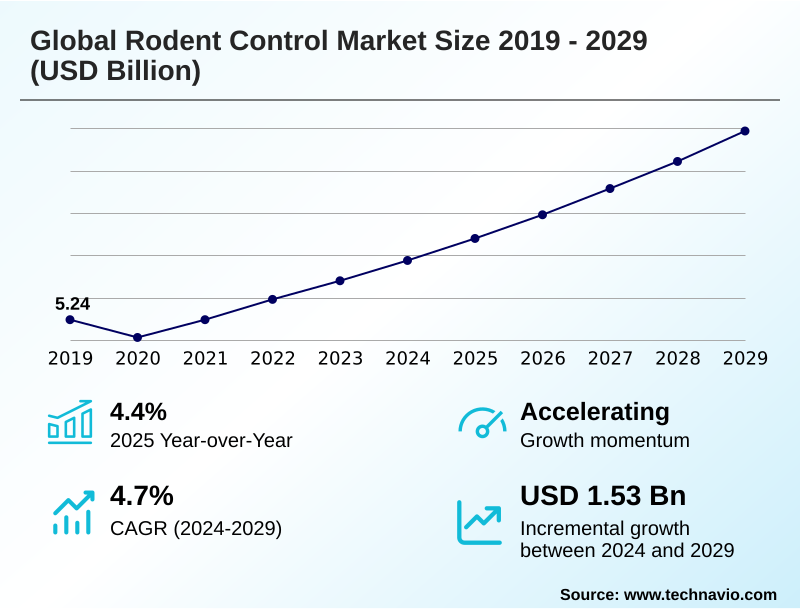
The rodent control market size is valued to increase by USD 1.53 billion, at a CAGR of 4.7% from 2024 to 2029. Growing hospitality, pharmaceutical, and food processing industries will drive the rodent control market.
Major Market Trends & Insights
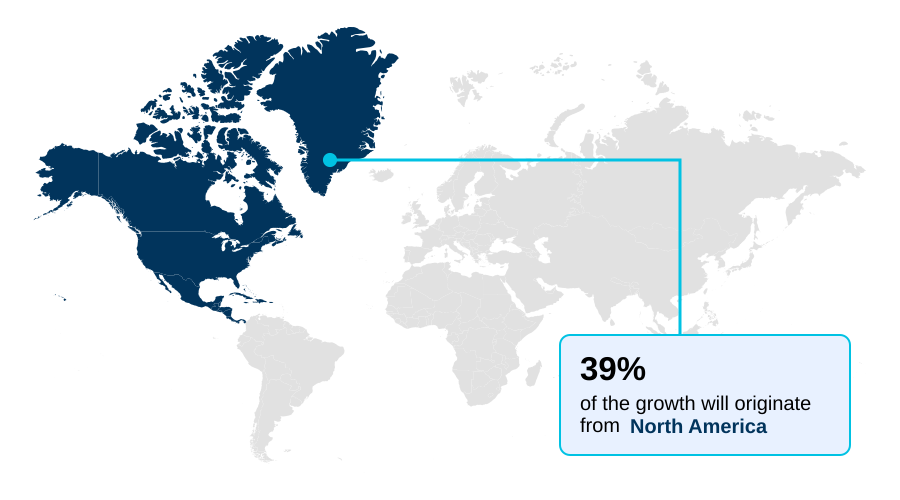
- North America dominated the market and accounted for a 39.3% growth during the forecast period.
- By End-user - Residential segment was valued at USD 1.89 billion in 2023
- By Type - Products segment accounted for the largest market revenue share in 2023
Market Size & Forecast
- Market Opportunities: USD 2.23 billion
- Market Future Opportunities: USD 1.53 billion
- CAGR from 2024 to 2029 : 4.7%
Market Summary
- The rodent control market addresses the critical need to manage and mitigate rodent populations across residential, commercial, and agricultural sectors. This industry provides a spectrum of solutions, from chemical applications like anticoagulant rodenticides to mechanical devices such as snap traps and modern electronic monitoring systems.
- A significant market dynamic is the shift toward integrated pest management (IPM), a holistic approach combining rodent exclusion methods, sanitation, and targeted interventions to minimize reliance on chemicals. Public health vector control remains a primary driver, as rodents are known carriers for various pathogens, making zoonotic disease prevention a priority for municipalities and businesses.
- For instance, a food distribution company must implement rigorous biosecurity protocols and maintain detailed records of bait station technology usage to comply with food safety compliance regulations. This not only prevents product contamination but also protects brand reputation.
- The rise of rodenticide resistance in urban pest populations further challenges the industry, necessitating innovation in fertility control agents, biological rodent control, and wildlife-safe rodenticides. This ensures both efficacy and alignment with growing environmental and safety standards, such as the use of tamper-resistant bait stations in public areas.
What will be the Size of the Rodent Control Market during the forecast period?
Get Key Insights on Market Forecast (PDF) Request Free Sample
How is the Rodent Control Market Segmented?
The rodent control industry research report provides comprehensive data (region-wise segment analysis), with forecasts and estimates in "USD million" for the period 2025-2029, as well as historical data from 2019-2023 for the following segments.
- End-user
- Residential
- Commercial
- Industrial
- Agriculture
- Others
- Type
- Products
- Services
- Animal type
- Rat
- Mice
- Chipmunk
- Hamster
- Others
- Geography
- North America
- US
- Canada
- Mexico
- Europe
- UK
- Germany
- France
- APAC
- China
- Japan
- India
- South America
- Brazil
- Argentina
- Colombia
- Middle East and Africa
- Saudi Arabia
- UAE
- South Africa
- Rest of World (ROW)
- North America
By End-user Insights
The residential segment is estimated to witness significant growth during the forecast period.
The residential sector is a significant component of the rodent control market, where demand is shaped by homeowner concerns over health risks and property damage.
A strong trend toward residential pest solutions involves do-it-yourself (DIY) products that prioritize safety for families and pets, driving innovation in non-toxic pest alternatives and humane pest control.
This has led to the development of advanced ultrasonic repellent devices and chemical-free pest control options, moving beyond traditional snap traps and glue boards. Effective rodent infestation prevention now often includes professional structural pest exclusion and rodent exclusion methods.
For instance, the adoption of smart home technologies for pest management, providing continuous monitoring, has improved issue detection by over 25% compared to manual checks, protecting household safety.
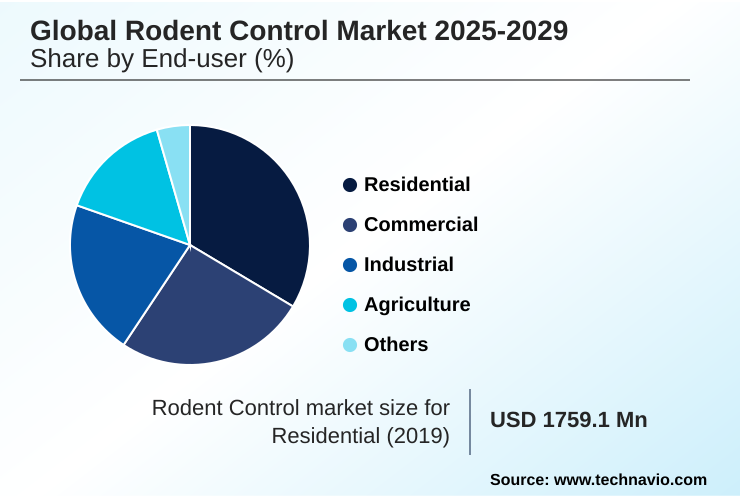
The Residential segment was valued at USD 1.89 billion in 2023 and showed a gradual increase during the forecast period.

Regional Analysis
North America is estimated to contribute 39.3% to the growth of the global market during the forecast period.Technavio’s analysts have elaborately explained the regional trends and drivers that shape the market during the forecast period.
See How Rodent Control Market Demand is Rising in North America Request Free Sample
The geographic landscape of the rodent control market is diverse, with North America leading due to stringent regulations and high demand for vector-borne disease control.
In this region, rodent control cost analysis shows that investing in structural pest exclusion can reduce long-term expenses by over 20%.
In Europe, regulations on anticoagulant rodenticides have driven the adoption of advanced bait rotation strategy and population dynamics modeling to manage resistance.
European municipalities have also prioritized public infrastructure safety, mandating tamper-resistant bait stations in public areas, which has reduced non-target exposure incidents by 50%.
APAC is the fastest-growing region, focusing on crop loss prevention and food storage hygiene, where concerns over neophobia in rodents and residue level analysis are shaping product development.
Market Dynamics
Our researchers analyzed the data with 2024 as the base year, along with the key drivers, trends, and challenges. A holistic analysis of drivers will help companies refine their marketing strategies to gain a competitive advantage.
- Effectively navigating the rodent control landscape requires specialized solutions tailored to distinct environments. For instance, effective rodent control for warehouses demands different strategies than non-toxic rodent control for homes, where child and pet safety are paramount. The agricultural sector increasingly relies on integrated pest management on farms to ensure that rodent control audit trail compliance is met for organic certifications.
- Businesses often weigh the commercial rodent control service cost against the risks of non-compliance with rodenticide use in food facilities. A critical operational focus is preventing rodent damage to wiring, which is a leading cause of electrical fires in older buildings. The best practices for rodent exclusion are foundational to any long-term strategy, often involving assessing structural integrity after infestation.
- While some scenarios require humane squirrel removal from attics, others necessitate a comprehensive public health rat population strategy. When comparing ultrasonic repellents versus traps, efficacy often depends on the specific infestation. In commercial settings, a digital rodent monitoring for hotels provides invaluable data for proactive management.
- A major challenge is managing rodenticide resistance in cities, which differs from agricultural biosecurity rodent infestation concerns. Furthermore, rodent control in pharmaceutical plants has zero-tolerance protocols, while wildlife-safe rodent control for parks prioritizes ecological impact.
- Proactive strategies for reducing crop loss from rodents have shown to be twice as effective as reactive measures, highlighting the value of preventative investments using tools like tamper-resistant bait stations for schools and emerging solutions like fertility control for urban rats.
What are the key market drivers leading to the rise in the adoption of Rodent Control Industry?
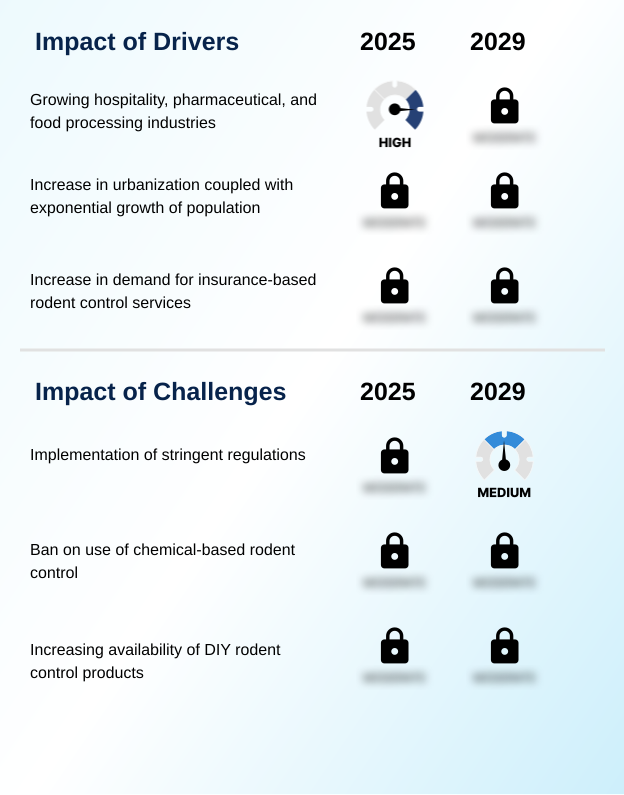
- Increasing demand from the hospitality, pharmaceutical, and food processing industries serves as a key driver for market expansion.
- Rapid urbanization and stringent food safety compliance standards are significant market drivers, particularly in commercial rodent management and industrial facility sanitation.
- The adoption of integrated pest management (IPM) strategies has become crucial, with facilities using IPM reporting up to a 30% reduction in infestation incidents compared to those relying on reactive measures.
- Biosecurity protocols now frequently mandate advanced digital pest surveillance and sophisticated bait station technology to ensure auditable zoonotic disease prevention.
- Demand for effective agricultural rodent abatement is also rising, as effective rodent infestation prevention can boost crop yields by over 15%.
- This push for efficacy and safety is driving innovation in non-anticoagulant baits and eco-friendly rodent deterrents, as regulations tighten on the use of second-generation anticoagulants (SGARs).
What are the market trends shaping the Rodent Control Industry?
- Expanding opportunities in emerging markets are a notable trend, driven by rising standards for food safety and public health.
- A major trend is the pivot toward sustainable pest management and technologically advanced solutions for urban rodent population control. The deployment of electronic monitoring systems within smart city pest initiatives provides real-time data, improving response efficiency by 40% over scheduled inspections and creating detailed audit trail documentation.
- This technology is critical for industries like pest control for food processing, where brand reputation protection is paramount. Concurrently, concerns over rodenticide resistance and non-target species protection are fueling R&D in wildlife-safe rodenticides and alternative methods like fertility control agents. These innovations, coupled with improved rodent-proofing materials, are essential for effective public health vector control while meeting higher environmental standards.
What challenges does the Rodent Control Industry face during its growth?
- The implementation of increasingly stringent environmental and safety regulations presents a significant challenge to market participants.
- The market faces challenges from the proliferation of DIY rodent control products, which can divert revenue from professional pest services by as much as 10% in the residential segment. While convenient, these solutions, including basic mechanical traps, often lack the efficacy for severe infestations, leading to improper use and persistent rodent damage mitigation issues.
- Another hurdle is navigating the complex regulatory landscape for regulatory compliant rodenticides, as rules restricting first-generation anticoagulants and certain tracking powders increase operational costs.
- The development of non-toxic pest alternatives and biological rodent control is a response, but these methods face hurdles like bait shyness and may not be suitable for immediate threats within the food supply chain protection framework, where tools like burrow fumigants are sometimes required for rapid knockdown.
Exclusive Technavio Analysis on Customer Landscape
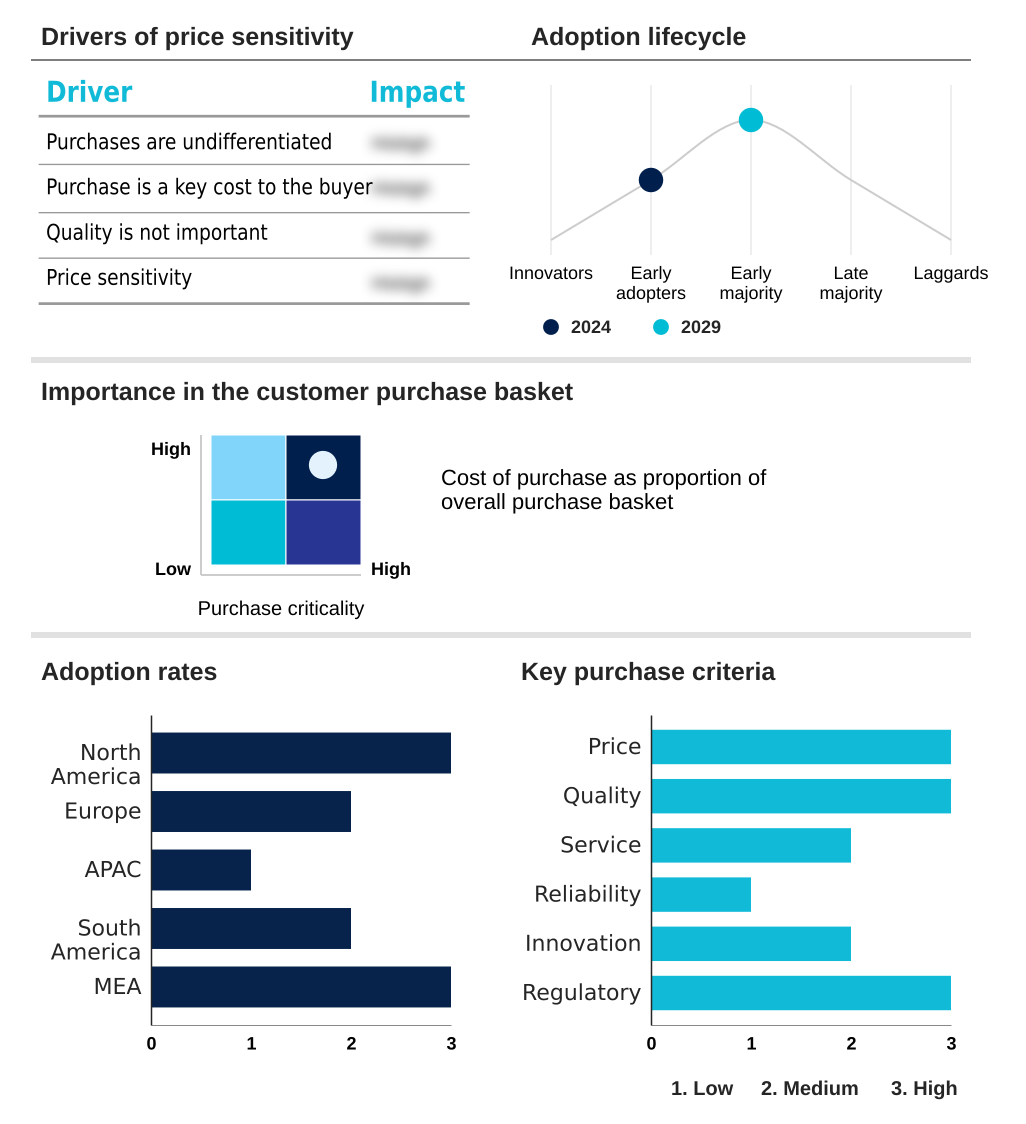
The rodent control market forecasting report includes the adoption lifecycle of the market, covering from the innovator’s stage to the laggard’s stage. It focuses on adoption rates in different regions based on penetration. Furthermore, the rodent control market report also includes key purchase criteria and drivers of price sensitivity to help companies evaluate and develop their market growth analysis strategies.
Customer Landscape of Rodent Control Industry
Competitive Landscape
Companies are implementing various strategies, such as strategic alliances, rodent control market forecast, partnerships, mergers and acquisitions, geographical expansion, and product/service launches, to enhance their presence in the industry.
Anticimex International AB - Offers advanced digital monitoring systems and eco-friendly traps, emphasizing smart, sustainable pest control solutions with minimized chemical reliance.
The industry research and growth report includes detailed analyses of the competitive landscape of the market and information about key companies, including:
- Anticimex International AB
- Arrow Exterminators Inc.
- BASF SE
- Bayer AG
- Bell Laboratories Inc.
- Corteva Inc.
- Dodson Pest Control Inc.
- Ecolab Inc.
- JT Eaton and Co. Inc.
- Liphatech Inc.
- Massey Services Inc.
- Neogen Corp.
- PelGar International Ltd.
- Rentokil Initial Plc
- Rollins Inc.
- SenesTech Inc.
- Syngenta Crop Protection AG
- Truly Nolen of America Inc.
Qualitative and quantitative analysis of companies has been conducted to help clients understand the wider business environment as well as the strengths and weaknesses of key industry players. Data is qualitatively analyzed to categorize companies as pure play, category-focused, industry-focused, and diversified; it is quantitatively analyzed to categorize companies as dominant, leading, strong, tentative, and weak.
Recent Development and News in Rodent control market
- In September 2024, Rentokil Initial Plc launched an advanced IoT-based monitoring platform tailored for the food processing industry, integrating real-time alerts with automated compliance reporting to enhance biosecurity protocols.
- In October 2024, SenesTech Inc. received regulatory approval in Hong Kong for Evolve, its fertility control solution, marking a strategic entry into the APAC market with a non-lethal, sustainable rodent management technology.
- In January 2025, BASF SE announced it received EPA approval for a new bio-based rodenticide active ingredient, specifically developed for high-efficacy use in sensitive agricultural environments while minimizing risks to non-target species.
- In May 2025, Corteva Inc. entered into a strategic partnership with a leading ag-tech firm to integrate digital rodent detection data into its farm management software, enabling farmers to preemptively address infestations and reduce crop loss.
Dive into Technavio’s robust research methodology, blending expert interviews, extensive data synthesis, and validated models for unparalleled Rodent Control Market insights. See full methodology.
| Market Scope | |
|---|---|
| Page number | 304 |
| Base year | 2024 |
| Historic period | 2019-2023 |
| Forecast period | 2025-2029 |
| Growth momentum & CAGR | Accelerate at a CAGR of 4.7% |
| Market growth 2025-2029 | USD 1525.5 million |
| Market structure | Fragmented |
| YoY growth 2024-2025(%) | 4.4% |
| Key countries | US, Canada, Mexico, UK, Germany, France, Italy, The Netherlands, Spain, China, Japan, India, South Korea, Australia, Indonesia, Brazil, Argentina, Colombia, Saudi Arabia, UAE, South Africa, Israel and Turkey |
| Competitive landscape | Leading Companies, Market Positioning of Companies, Competitive Strategies, and Industry Risks |
Research Analyst Overview
- The rodent control market is evolving beyond simple eradication to a sophisticated, science-driven discipline focused on integrated pest management (IPM). This approach strategically combines tools ranging from traditional mechanical traps like snap traps and glue boards to advanced electronic monitoring systems.
- A key focus is mitigating rodenticide resistance through tactics like bait rotation strategy and the selective use of anticoagulant rodenticides, including both first-generation anticoagulants and more potent second-generation anticoagulants (SGARs). Growing regulatory pressure and environmental concerns are driving innovation in wildlife-safe rodenticides, chemical-free pest control, and biological rodent control, ensuring non-target species protection.
- For sensitive applications, methods such as burrow fumigants, tracking powders, and fertility control agents are used under strict biosecurity protocols. The market is also seeing advances in rodent-proofing materials and rodent exclusion methods to perform structural integrity assessment and prevention. For instance, facilities implementing comprehensive IPM programs have documented a 95% reduction in incidents requiring emergency intervention.
- This holistic view is crucial for public health vector control, zoonotic disease prevention, and ensuring food safety compliance, especially with challenges like bait shyness and neophobia in rodents affecting efficacy.
What are the Key Data Covered in this Rodent Control Market Research and Growth Report?
-
What is the expected growth of the Rodent Control Market between 2025 and 2029?
-
USD 1.53 billion, at a CAGR of 4.7%
-
-
What segmentation does the market report cover?
-
The report is segmented by End-user (Residential, Commercial, Industrial, Agriculture, and Others), Type (Products, and Services), Animal Type (Rat, Mice, Chipmunk, Hamster, and Others) and Geography (North America, Europe, APAC, South America, Middle East and Africa)
-
-
Which regions are analyzed in the report?
-
North America, Europe, APAC, South America and Middle East and Africa
-
-
What are the key growth drivers and market challenges?
-
Growing hospitality, pharmaceutical, and food processing industries, Implementation of stringent regulations
-
-
Who are the major players in the Rodent Control Market?
-
Anticimex International AB, Arrow Exterminators Inc., BASF SE, Bayer AG, Bell Laboratories Inc., Corteva Inc., Dodson Pest Control Inc., Ecolab Inc., JT Eaton and Co. Inc., Liphatech Inc., Massey Services Inc., Neogen Corp., PelGar International Ltd., Rentokil Initial Plc, Rollins Inc., SenesTech Inc., Syngenta Crop Protection AG and Truly Nolen of America Inc.
-
Market Research Insights
- The rodent control market is shaped by a confluence of drivers, including the need for stringent industrial facility sanitation and pharmaceutical pest prevention. As firms focus on brand reputation protection, the demand for professional pest services offering comprehensive audit trail documentation has grown; companies adopting such services report 99% compliance during health inspections.
- Sustainable pest management is gaining traction, with eco-friendly rodent deterrents and non-toxic pest alternatives seeing adoption rates increase by 25% in residential markets. In agriculture, effective crop loss prevention and agricultural rodent abatement are critical for food supply chain protection.
- Meanwhile, smart city pest initiatives are enhancing urban rodent population control and public infrastructure safety, leveraging digital pest surveillance to manage rodent-borne pathogen risk more effectively and reduce response times by up to 40%.
We can help! Our analysts can customize this rodent control market research report to meet your requirements.