Command And Control Systems Market Analysis, Size, and Forecast 2026-2030: North America (US, Canada, and Mexico), APAC (China, India, and Japan), Europe (UK, Germany, and France), South America (Brazil and Argentina), Middle East and Africa (Saudi Arabia, UAE, and South Africa), and Rest of World (ROW)

Command And Control Systems Market Analysis, Size, and Forecast 2026-2030:
North America (US, Canada, and Mexico), APAC (China, India, and Japan), Europe (UK, Germany, and France), South America (Brazil and Argentina), Middle East and Africa (Saudi Arabia, UAE, and South Africa), and Rest of World (ROW)

Published: Apr 2026 310 Pages SKU: IRTNTR45598

Market Overview at a Glance

$3.07 B
Market Opportunity
2.3%
CAGR 2025 - 2030
63%
North America Growth
$11.00 B
Government and defense segment 2024

Command And Control Systems Market Size 2026-2030

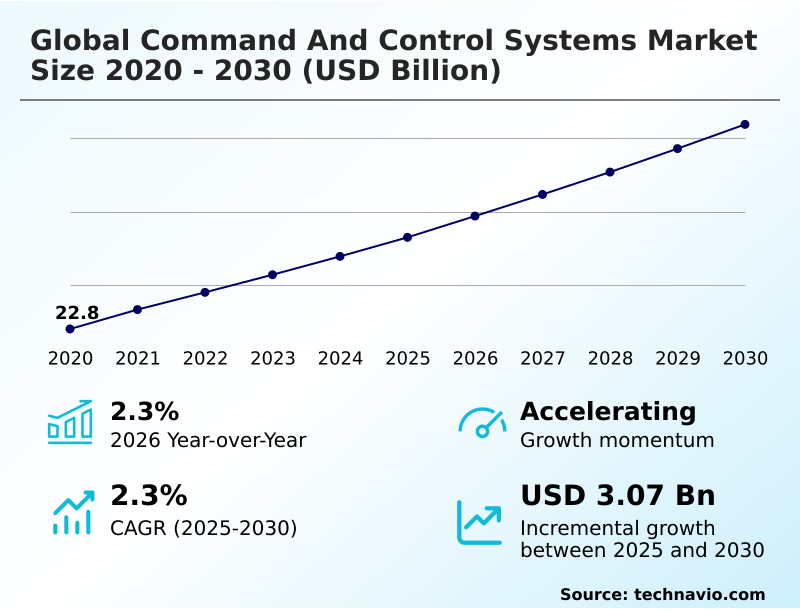
The command and control systems market size is valued to increase by USD 3.07 billion, at a CAGR of 2.3% from 2025 to 2030. Escalating demand for network centric warfare and multi domain integration will drive the command and control systems market.

Major Market Trends & Insights

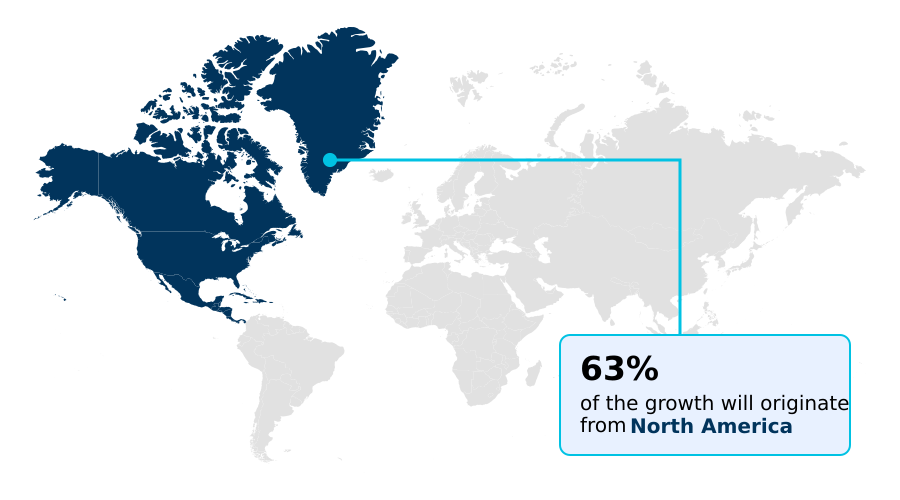
  • North America dominated the market and accounted for a 63% growth during the forecast period.
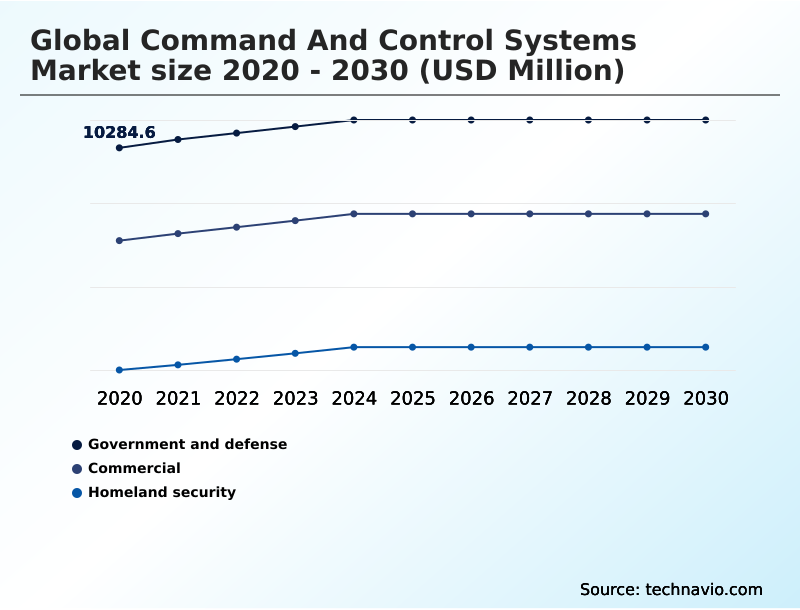
  • By Application - Government and defense segment was valued at USD 11.00 billion in 2024
  • By Platform - Land segment accounted for the largest market revenue share in 2024

Market Size & Forecast

  • Market Opportunities: USD 5.57 billion
  • Market Future Opportunities: USD 3.07 billion
  • CAGR from 2025 to 2030 : 2.3%

Market Summary

  • The command and control systems market is undergoing a significant transformation, driven by the need for enhanced situational awareness and rapid decision-making cycles in complex security environments. Modernization efforts focus on replacing siloed legacy platforms with interconnected, software-defined architectures.
  • This shift is crucial for enabling multi-domain operations, where data from land, air, sea, space, and cyber assets are fused into a common operational picture. Key technologies like AI and machine learning are central to this evolution, with predictive analytics and automated data fusion tools helping commanders process vast amounts of intelligence, surveillance, and reconnaissance (ISR) data.
  • For instance, a logistics command can use these systems for predictive maintenance, optimizing supply chain resilience and ensuring operational continuity. The adoption of open architecture frameworks promotes systems interoperability among allied forces, while zero-trust security models address pervasive cybersecurity vulnerabilities.
  • This evolution toward intelligent, resilient, and integrated platforms is redefining strategic superiority and ensuring forces can maintain information dominance against sophisticated adversaries. The emphasis on a robust digital backbone supports this shift, making the command and control landscape more agile and responsive.

What will be the Size of the Command And Control Systems Market during the forecast period?

Get Key Insights on Market Forecast (PDF) Get Free Sample

How is the Command And Control Systems Market Segmented?

The command and control systems industry research report provides comprehensive data (region-wise segment analysis), with forecasts and estimates in "USD million" for the period 2026-2030, as well as historical data from 2020-2024 for the following segments.

  • Application
    • Government and defense
    • Commercial
    • Homeland security
  • Platform
    • Land
    • Airborne
    • Naval
    • Space
  • Solution
    • Software
    • Hardware
    • Services
  • Geography
    • North America
      • US
      • Canada
      • Mexico
    • APAC
      • China
      • India
      • Japan
    • Europe
      • UK
      • Germany
      • France
    • South America
      • Brazil
      • Argentina
    • Middle East and Africa
      • Saudi Arabia
      • UAE
      • South Africa
    • Rest of World (ROW)

By Application Insights

The government and defense segment is estimated to witness significant growth during the forecast period.

The government and defense segment drives market demand, fueled by the imperative to modernize military infrastructure for multi-domain threats. A strategic shift is underway from legacy systems to agile, software-defined architectures supporting Joint All Domain Command and Control (JADC2) frameworks.

This transition prioritizes the integration of AI and cloud-native architectures for achieving decision superiority. Defense establishments are adopting open architecture frameworks and zero-trust security models to ensure systems interoperability and a high-fidelity operational picture.

These advanced battle management systems are crucial for national security, enabling forces to maintain a technological edge. The implementation of automated data fusion tools improves decision-making cycles by up to 40%, ensuring operational effectiveness in contested environments with resilient networks.

Get Free Sample

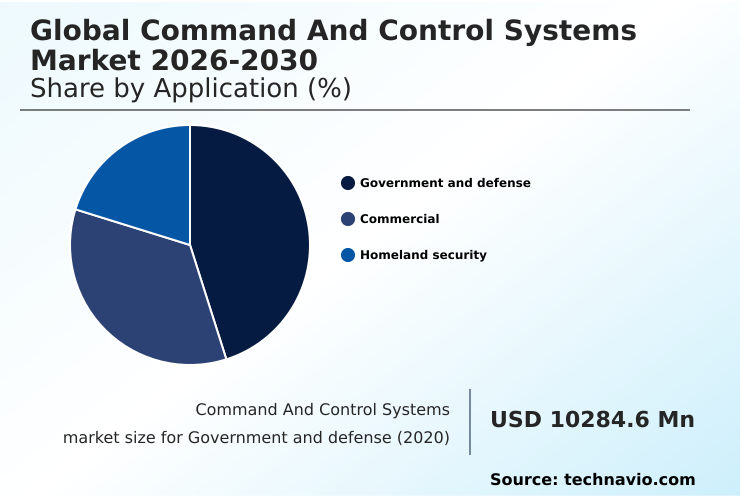
The Government and defense segment was valued at USD 11.00 billion in 2024 and showed a gradual increase during the forecast period.

Get Free Sample

Regional Analysis

North America is estimated to contribute 63% to the growth of the global market during the forecast period.Technavio’s analysts have elaborately explained the regional trends and drivers that shape the market during the forecast period.

See How Command And Control Systems Market Demand is Rising in North America Get Free Sample

The geographic landscape of the command and control systems market is led by North America, which is projected to contribute approximately 63% of the market's incremental growth.

This dominance is driven by aggressive modernization initiatives focused on achieving JADC2 capabilities through software-defined architectures and AI integration.

The region's market is expanding at a rate of 3.5%, significantly outpacing Europe's 1.5% growth, reflecting substantial investments in cloud-native architectures and zero-trust security models to ensure information dominance.

APAC is also a fast-growing region, with nations focusing on building sovereign capabilities and modernizing forces to handle regional tensions.

The emphasis across all key geographies is on achieving systems interoperability and deploying resilient networks to maintain operational continuity in contested environments, making multi-domain integration a global priority.

Market Dynamics

Our researchers analyzed the data with 2025 as the base year, along with the key drivers, trends, and challenges. A holistic analysis of drivers will help companies refine their marketing strategies to gain a competitive advantage.

  • The evolution of modern defense strategy hinges on the adoption of sophisticated command and control capabilities. Central to this is the implementation of ai driven decision support architectures, which are becoming standard for enhancing situational awareness for commanders.
  • These systems enable the automated processing of battlefield data, allowing for the predictive analysis of adversary maneuvers and the rapid automating data classification and prioritization of threats. A key application is the orchestration of complex joint force operations, which requires seamless interoperability between allied nation forces.
  • For example, the integration of an aegis combat system c2 integration with joint air and missile defense systems is now more streamlined. Systems like the integrated air and missile defense battle command system (ibcs) rely on this cohesion. The focus on mobility and flexibility is driving demand for software defined radio communication systems to ensure resilient command in contested environments.
  • This is particularly vital for cyber hardened multi domain operations and the coordination of heterogeneous unmanned vehicles. Modernization programs, such as those for modernization of legacy ground control systems and global positioning systems operational control, are now prioritized.
  • The effectiveness of distributed battle management command and control platforms, which focus on securing data integrity in transit, has shown to reduce response times by more than half compared to older, siloed systems. Ultimately, the successful deployment of technologies like the tactical airspace integration system functionality and integrated battle management system adoption defines the future of digital warfare.

What are the key market drivers leading to the rise in the adoption of Command And Control Systems Industry?

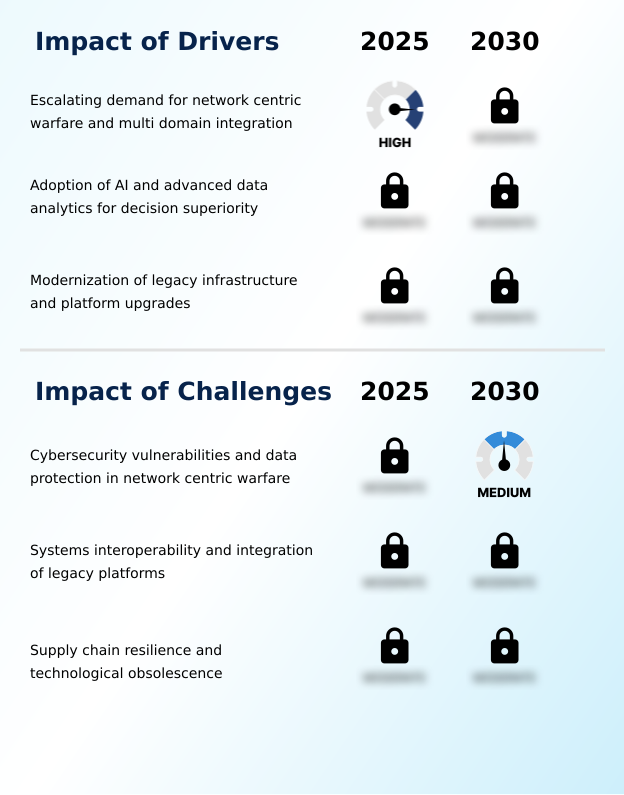
  • The escalating demand for network-centric warfare capabilities and seamless multi-domain integration is a foundational driver propelling market expansion.

  • The market is fundamentally driven by the need for network-centric warfare and multi-domain integration, improving the speed of information transfer by a factor of 10 in some cases.
  • This enables forces to achieve a shared operational picture and attain decision superiority.
  • A second major driver is the adoption of AI and predictive analytics to process vast data volumes, which can reduce the cognitive load on personnel by over 50%.
  • These technologies automate the analysis of ISR data, allowing for faster identification of threats. Finally, the modernization of legacy infrastructure through open architecture frameworks is critical.
  • This approach extends the life of existing assets while integrating modern capabilities like secure communication channels, making it a cost-effective strategy for maintaining operational readiness.

What are the market trends shaping the Command And Control Systems Industry?

  • The integration of AI for autonomous orchestration is a transformative market trend. It enables automated, machine-driven decision support to manage complex operational data.

  • A primary market trend is the integration of AI for autonomous orchestration, moving from manual data processing to automated, machine-driven decision support. This use of human-autonomy teaming and collaborative autonomy is essential for managing the high volume of sensor data on modern battlefields and reduces crew workload by up to 45%.
  • Another key trend is the migration toward decentralized architectures and cloud-native designs. By utilizing edge computing solutions, forces can maintain information dominance in environments with degraded connectivity. This architectural shift ensures resilient networks and allows for rapid capability updates; deployment cycles for new software capabilities can be accelerated by over 70% compared to monolithic systems.
  • This agility is critical for maintaining a technological edge.

What challenges does the Command And Control Systems Industry face during its growth?

  • Persistent cybersecurity vulnerabilities and the critical need for data protection in network-centric warfare environments present a significant challenge to industry growth.

  • A paramount challenge is managing escalating cybersecurity vulnerabilities, as the shift to interconnected digital battlefields can increase the attack surface for cyber threats by up to 300%. Ensuring data integrity protection requires constant monitoring and the implementation of zero-trust security models, which is a resource-intensive task.
  • Another significant hurdle is systems interoperability, particularly the integration of modern software with legacy hardware. These legacy platform integration projects often exceed budgets by 25-40% due to the complexity of bridging proprietary systems. Furthermore, supply chain resilience is a growing concern.
  • Geopolitical tensions create risks of component shortages and technological obsolescence, threatening the production and long-term readiness of mission-critical systems and disrupting operational continuity.

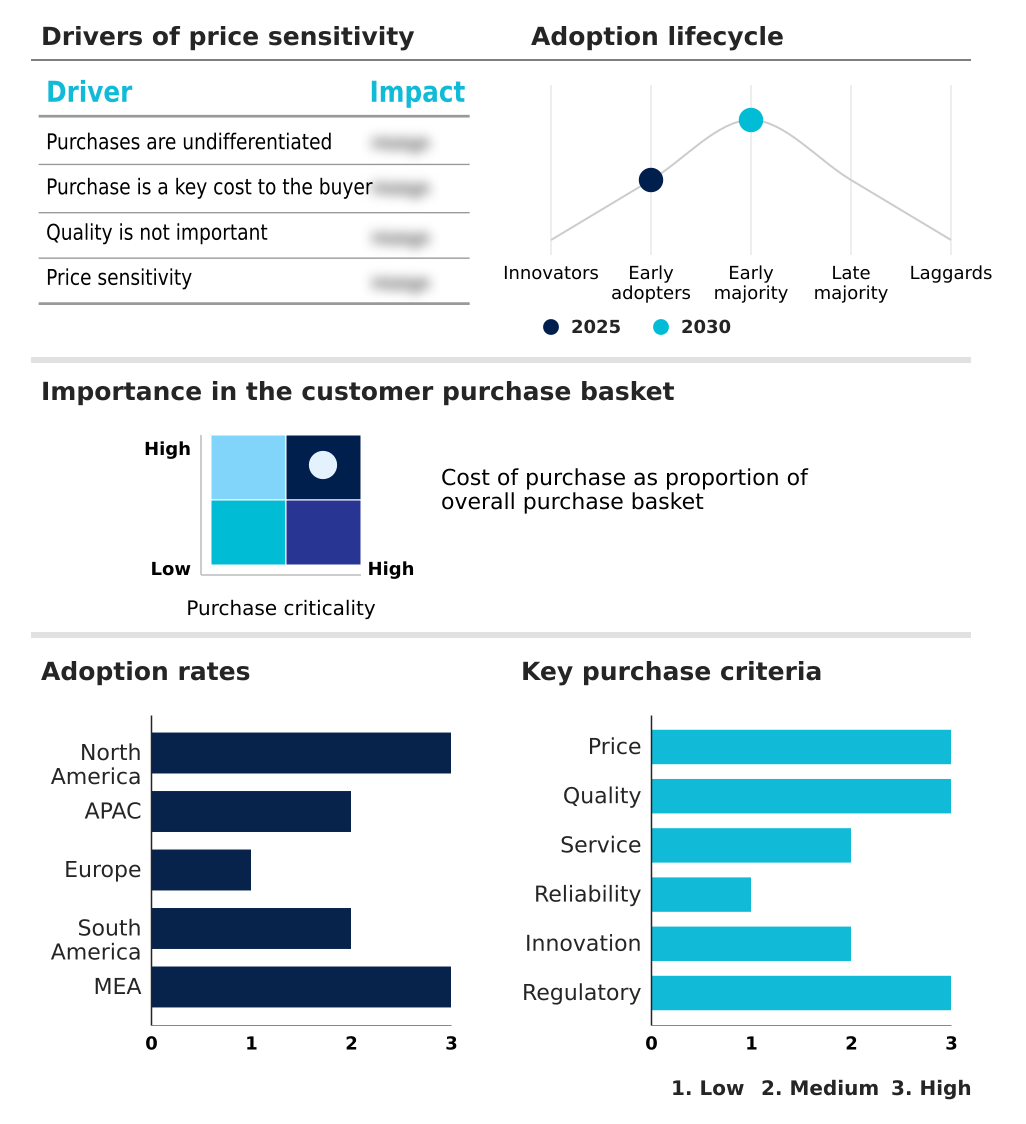
Exclusive Technavio Analysis on Customer Landscape

The command and control systems market forecasting report includes the adoption lifecycle of the market, covering from the innovator’s stage to the laggard’s stage. It focuses on adoption rates in different regions based on penetration. Furthermore, the command and control systems market report also includes key purchase criteria and drivers of price sensitivity to help companies evaluate and develop their market growth analysis strategies.

Customer Landscape of Command And Control Systems Industry

Competitive Landscape

Companies are implementing various strategies, such as strategic alliances, command and control systems market forecast, partnerships, mergers and acquisitions, geographical expansion, and product/service launches, to enhance their presence in the industry.

Airbus SE - Offers integrated battle management, air defense coordination, and battlefield situational awareness through a suite of advanced command and control systems solutions.

The industry research and growth report includes detailed analyses of the competitive landscape of the market and information about key companies, including:

  • Airbus SE
  • Atos SE
  • BAE Systems Plc
  • Elbit Systems Ltd.
  • General Dynamics Corp.
  • IBM Corp.
  • Indra Sistemas SA
  • Kongsberg Gruppen ASA
  • L3Harris Technologies Inc.
  • Leidos Holdings Inc.
  • Leonardo S.p.A.
  • Lockheed Martin Corp.
  • Motorola Solutions Inc.
  • Northrop Grumman Corp.
  • Palantir Technologies Inc.
  • Rheinmetall AG
  • RTX Corp.
  • Saab AB
  • Thales Group
  • The Boeing Co.

Qualitative and quantitative analysis of companies has been conducted to help clients understand the wider business environment as well as the strengths and weaknesses of key industry players. Data is qualitatively analyzed to categorize companies as pure play, category-focused, industry-focused, and diversified; it is quantitatively analyzed to categorize companies as dominant, leading, strong, tentative, and weak.

Recent Development and News in Command and control systems market

  • In January 2025, the Department of Defense released the Defense Business Board report on supply chain illumination, recommending enhanced visibility and risk mitigation across critical defense sectors.
  • In August 2025, the United States Navy awarded Northrop Grumman a significant contract for the Providence Distributed Battle Management Command and Control Systems, aiming to enhance interoperable and secure information dominance.
  • In September 2025, the Department of Defense added the K1000ULE unmanned aerial system to the Blue UAS Cleared List, enabling its use for collaborative teaming and shared mission layer operations across multiple domains.
  • In April 2026, the United States Space Force terminated its contract with RTX for the Global Positioning Systems Next Generation Operational Control System, signaling a strategic shift toward more rapid, incremental capability delivery models.

Dive into Technavio’s robust research methodology, blending expert interviews, extensive data synthesis, and validated models for unparalleled Command And Control Systems Market insights. See full methodology.

Market Scope
Page number 310
Base year 2025
Historic period 2020-2024
Forecast period 2026-2030
Growth momentum & CAGR Accelerate at a CAGR of 2.3%
Market growth 2026-2030 USD 3074.5 million
Market structure Fragmented
YoY growth 2025-2026(%) 2.3%
Key countries US, Canada, Mexico, China, India, Japan, South Korea, Australia, Indonesia, UK, Germany, France, Italy, Spain, The Netherlands, Brazil, Argentina, Chile, Saudi Arabia, UAE, South Africa, Israel and Turkey
Competitive landscape Leading Companies, Market Positioning of Companies, Competitive Strategies, and Industry Risks

Request Free Sample

Research Analyst Overview

  • The command and control systems market is advancing rapidly, driven by the strategic shift toward network-centric warfare and multi-domain integration. The core objective is achieving decision superiority by leveraging technologies like AI, predictive analytics, and data fusion tools. These systems process vast streams of intelligence, surveillance, and reconnaissance (ISR) data to create a common operational picture, enhancing situational awareness.
  • A key boardroom consideration is the investment in open architecture frameworks and Modular Open Systems Approach (MOSA), which mitigate technological obsolescence and improve systems interoperability. Modern battle management systems, such as the command post of the future (CPOF), are essential for mission planning and battlefield visualization.
  • The adoption of cloud-native and decentralized architectures, combined with edge computing solutions, ensures operational resilience against anti-access/area denial (A2AD) tactics. Moreover, implementing zero-trust security models is critical for countering cybersecurity vulnerabilities. This integrated approach reduces the time to achieve a shared operational picture by over 60% compared to legacy systems, enabling effective joint force operations and robust electronic warfare resilience.

What are the Key Data Covered in this Command And Control Systems Market Research and Growth Report?

  • What is the expected growth of the Command And Control Systems Market between 2026 and 2030?

    • USD 3.07 billion, at a CAGR of 2.3%

  • What segmentation does the market report cover?

    • The report is segmented by Application (Government and defense, Commercial, and Homeland security), Platform (Land, Airborne, Naval, and Space), Solution (Software, Hardware, and Services) and Geography (North America, APAC, Europe, South America, Middle East and Africa)

  • Which regions are analyzed in the report?

    • North America, APAC, Europe, South America and Middle East and Africa

  • What are the key growth drivers and market challenges?

    • Escalating demand for network centric warfare and multi domain integration, Cybersecurity vulnerabilities and data protection in network centric warfare

  • Who are the major players in the Command And Control Systems Market?

    • Airbus SE, Atos SE, BAE Systems Plc, Elbit Systems Ltd., General Dynamics Corp., IBM Corp., Indra Sistemas SA, Kongsberg Gruppen ASA, L3Harris Technologies Inc., Leidos Holdings Inc., Leonardo S.p.A., Lockheed Martin Corp., Motorola Solutions Inc., Northrop Grumman Corp., Palantir Technologies Inc., Rheinmetall AG, RTX Corp., Saab AB, Thales Group and The Boeing Co.

Market Research Insights

  • The dynamics of the command and control systems market are defined by the pursuit of information dominance and strategic superiority. Modern defense forces are architecting a new digital backbone, shifting from legacy platforms to agile, software-defined architectures to support multi-domain operations. The core objective is ensuring operational continuity on digital battlefields.
  • This transition addresses national security priorities by enabling mission-critical responsiveness and a high-fidelity operational picture. Systems leveraging AI have been shown to improve decision-making cycles by up to 40% and reduce the cognitive load on personnel by over 50%.
  • The emphasis is on incremental capability delivery and building resilient networks for effective threat landscape navigation, ensuring robust command chain protection and maintaining command authority in any scenario.

We can help! Our analysts can customize this command and control systems market research report to meet your requirements.

Get in touch

1. Executive Summary

1.1 Market overview

Executive Summary - Chart on Market Overview
Executive Summary - Data Table on Market Overview
Executive Summary - Chart on Global Market Characteristics
Executive Summary - Chart on Market by Geography
Executive Summary - Chart on Market Segmentation by Application
Executive Summary - Chart on Market Segmentation by Platform
Executive Summary - Chart on Market Segmentation by Solution
Executive Summary - Chart on Incremental Growth
Executive Summary - Data Table on Incremental Growth
Executive Summary - Chart on Company Market Positioning

2. Technavio Analysis

2.1 Analysis of price sensitivity, lifecycle, customer purchase basket, adoption rates, and purchase criteria

2.2 Criticality of inputs and Factors of differentiation

Chart on Overview on criticality of inputs and factors of differentiation

2.3 Factors of disruption

Chart on Overview on factors of disruption

2.4 Impact of drivers and challenges

Chart on Impact of drivers and challenges in 2025 and 2030

3. Market Landscape

3.1 Market ecosystem

Chart on Parent Market
Data Table on - Parent Market

3.2 Market characteristics

Chart on Market characteristics analysis

3.3 Value chain analysis

Chart on Value chain analysis

4. Market Sizing

4.1 Market definition

Data Table on Offerings of companies included in the market definition

4.2 Market segment analysis

Market segments

4.3 Market size 2025

4.4 Market outlook: Forecast for 2025-2030

Chart on Global - Market size and forecast 2025-2030 ($ million)
Data Table on Global - Market size and forecast 2025-2030 ($ million)
Chart on Global Market: Year-over-year growth 2025-2030 (%)
Data Table on Global Market: Year-over-year growth 2025-2030 (%)

5. Historic Market Size

5.1 Global Command And Control Systems Market 2020 - 2024

Historic Market Size - Data Table on Global Command And Control Systems Market 2020 - 2024 ($ million)

5.2 Application segment analysis 2020 - 2024

Historic Market Size - Application Segment 2020 - 2024 ($ million)

5.3 Platform segment analysis 2020 - 2024

Historic Market Size - Platform Segment 2020 - 2024 ($ million)

5.4 Solution segment analysis 2020 - 2024

Historic Market Size - Solution Segment 2020 - 2024 ($ million)

5.5 Geography segment analysis 2020 - 2024

Historic Market Size - Geography Segment 2020 - 2024 ($ million)

5.6 Country segment analysis 2020 - 2024

Historic Market Size - Country Segment 2020 - 2024 ($ million)

6. Qualitative Analysis

6.1 Impact of AI on global command and control systems market

6.2 Impact of geopolitical conflict on global command and control systems market

7. Five Forces Analysis

7.1 Five forces summary

Five forces analysis - Comparison between 2025 and 2030

7.2 Bargaining power of buyers

Bargaining power of buyers - Impact of key factors 2025 and 2030

7.3 Bargaining power of suppliers

Bargaining power of suppliers - Impact of key factors in 2025 and 2030

7.4 Threat of new entrants

Threat of new entrants - Impact of key factors in 2025 and 2030

7.5 Threat of substitutes

Threat of substitutes - Impact of key factors in 2025 and 2030

7.6 Threat of rivalry

Threat of rivalry - Impact of key factors in 2025 and 2030

7.7 Market condition

Chart on Market condition - Five forces 2025 and 2030

8. Market Segmentation by Application

8.1 Market segments

Chart on Application - Market share 2025-2030 (%)
Data Table on Application - Market share 2025-2030 (%)

8.2 Comparison by Application

Chart on Comparison by Application
Data Table on Comparison by Application

8.3 Government and defense - Market size and forecast 2025-2030

Chart on Government and defense - Market size and forecast 2025-2030 ($ million)
Data Table on Government and defense - Market size and forecast 2025-2030 ($ million)
Chart on Government and defense - Year-over-year growth 2025-2030 (%)
Data Table on Government and defense - Year-over-year growth 2025-2030 (%)

8.4 Commercial - Market size and forecast 2025-2030

Chart on Commercial - Market size and forecast 2025-2030 ($ million)
Data Table on Commercial - Market size and forecast 2025-2030 ($ million)
Chart on Commercial - Year-over-year growth 2025-2030 (%)
Data Table on Commercial - Year-over-year growth 2025-2030 (%)

8.5 Homeland security - Market size and forecast 2025-2030

Chart on Homeland security - Market size and forecast 2025-2030 ($ million)
Data Table on Homeland security - Market size and forecast 2025-2030 ($ million)
Chart on Homeland security - Year-over-year growth 2025-2030 (%)
Data Table on Homeland security - Year-over-year growth 2025-2030 (%)

8.6 Market opportunity by Application

Market opportunity by Application ($ million)
Data Table on Market opportunity by Application ($ million)

9. Market Segmentation by Platform

9.1 Market segments

Chart on Platform - Market share 2025-2030 (%)
Data Table on Platform - Market share 2025-2030 (%)

9.2 Comparison by Platform

Chart on Comparison by Platform
Data Table on Comparison by Platform

9.3 Land - Market size and forecast 2025-2030

Chart on Land - Market size and forecast 2025-2030 ($ million)
Data Table on Land - Market size and forecast 2025-2030 ($ million)
Chart on Land - Year-over-year growth 2025-2030 (%)
Data Table on Land - Year-over-year growth 2025-2030 (%)

9.4 Airborne - Market size and forecast 2025-2030

Chart on Airborne - Market size and forecast 2025-2030 ($ million)
Data Table on Airborne - Market size and forecast 2025-2030 ($ million)
Chart on Airborne - Year-over-year growth 2025-2030 (%)
Data Table on Airborne - Year-over-year growth 2025-2030 (%)

9.5 Naval - Market size and forecast 2025-2030

Chart on Naval - Market size and forecast 2025-2030 ($ million)
Data Table on Naval - Market size and forecast 2025-2030 ($ million)
Chart on Naval - Year-over-year growth 2025-2030 (%)
Data Table on Naval - Year-over-year growth 2025-2030 (%)

9.6 Space - Market size and forecast 2025-2030

Chart on Space - Market size and forecast 2025-2030 ($ million)
Data Table on Space - Market size and forecast 2025-2030 ($ million)
Chart on Space - Year-over-year growth 2025-2030 (%)
Data Table on Space - Year-over-year growth 2025-2030 (%)

9.7 Market opportunity by Platform

Market opportunity by Platform ($ million)
Data Table on Market opportunity by Platform ($ million)

10. Market Segmentation by Solution

10.1 Market segments

Chart on Solution - Market share 2025-2030 (%)
Data Table on Solution - Market share 2025-2030 (%)

10.2 Comparison by Solution

Chart on Comparison by Solution
Data Table on Comparison by Solution

10.3 Software - Market size and forecast 2025-2030

Chart on Software - Market size and forecast 2025-2030 ($ million)
Data Table on Software - Market size and forecast 2025-2030 ($ million)
Chart on Software - Year-over-year growth 2025-2030 (%)
Data Table on Software - Year-over-year growth 2025-2030 (%)

10.4 Hardware - Market size and forecast 2025-2030

Chart on Hardware - Market size and forecast 2025-2030 ($ million)
Data Table on Hardware - Market size and forecast 2025-2030 ($ million)
Chart on Hardware - Year-over-year growth 2025-2030 (%)
Data Table on Hardware - Year-over-year growth 2025-2030 (%)

10.5 Services - Market size and forecast 2025-2030

Chart on Services - Market size and forecast 2025-2030 ($ million)
Data Table on Services - Market size and forecast 2025-2030 ($ million)
Chart on Services - Year-over-year growth 2025-2030 (%)
Data Table on Services - Year-over-year growth 2025-2030 (%)

10.6 Market opportunity by Solution

Market opportunity by Solution ($ million)
Data Table on Market opportunity by Solution ($ million)

11. Customer Landscape

11.1 Customer landscape overview

Analysis of price sensitivity, lifecycle, customer purchase basket, adoption rates, and purchase criteria

12. Geographic Landscape

12.1 Geographic segmentation

Chart on Market share by geography 2025-2030 (%)
Data Table on Market share by geography 2025-2030 (%)

12.2 Geographic comparison

Chart on Geographic comparison
Data Table on Geographic comparison

12.3 North America - Market size and forecast 2025-2030

Chart on North America - Market size and forecast 2025-2030 ($ million)
Data Table on North America - Market size and forecast 2025-2030 ($ million)
Chart on North America - Year-over-year growth 2025-2030 (%)
Data Table on North America - Year-over-year growth 2025-2030 (%)
Chart on Regional Comparison - North America
Data Table on Regional Comparison - North America

12.3.1 US - Market size and forecast 2025-2030

Chart on US - Market size and forecast 2025-2030 ($ million)
Data Table on US - Market size and forecast 2025-2030 ($ million)
Chart on US - Year-over-year growth 2025-2030 (%)
Data Table on US - Year-over-year growth 2025-2030 (%)

12.3.2 Canada - Market size and forecast 2025-2030

Chart on Canada - Market size and forecast 2025-2030 ($ million)
Data Table on Canada - Market size and forecast 2025-2030 ($ million)
Chart on Canada - Year-over-year growth 2025-2030 (%)
Data Table on Canada - Year-over-year growth 2025-2030 (%)

12.3.3 Mexico - Market size and forecast 2025-2030

Chart on Mexico - Market size and forecast 2025-2030 ($ million)
Data Table on Mexico - Market size and forecast 2025-2030 ($ million)
Chart on Mexico - Year-over-year growth 2025-2030 (%)
Data Table on Mexico - Year-over-year growth 2025-2030 (%)

12.4 APAC - Market size and forecast 2025-2030

Chart on APAC - Market size and forecast 2025-2030 ($ million)
Data Table on APAC - Market size and forecast 2025-2030 ($ million)
Chart on APAC - Year-over-year growth 2025-2030 (%)
Data Table on APAC - Year-over-year growth 2025-2030 (%)
Chart on Regional Comparison - APAC
Data Table on Regional Comparison - APAC

12.4.1 China - Market size and forecast 2025-2030

Chart on China - Market size and forecast 2025-2030 ($ million)
Data Table on China - Market size and forecast 2025-2030 ($ million)
Chart on China - Year-over-year growth 2025-2030 (%)
Data Table on China - Year-over-year growth 2025-2030 (%)

12.4.2 India - Market size and forecast 2025-2030

Chart on India - Market size and forecast 2025-2030 ($ million)
Data Table on India - Market size and forecast 2025-2030 ($ million)
Chart on India - Year-over-year growth 2025-2030 (%)
Data Table on India - Year-over-year growth 2025-2030 (%)

12.4.3 Japan - Market size and forecast 2025-2030

Chart on Japan - Market size and forecast 2025-2030 ($ million)
Data Table on Japan - Market size and forecast 2025-2030 ($ million)
Chart on Japan - Year-over-year growth 2025-2030 (%)
Data Table on Japan - Year-over-year growth 2025-2030 (%)

12.4.4 South Korea - Market size and forecast 2025-2030

Chart on South Korea - Market size and forecast 2025-2030 ($ million)
Data Table on South Korea - Market size and forecast 2025-2030 ($ million)
Chart on South Korea - Year-over-year growth 2025-2030 (%)
Data Table on South Korea - Year-over-year growth 2025-2030 (%)

12.4.5 Australia - Market size and forecast 2025-2030

Chart on Australia - Market size and forecast 2025-2030 ($ million)
Data Table on Australia - Market size and forecast 2025-2030 ($ million)
Chart on Australia - Year-over-year growth 2025-2030 (%)
Data Table on Australia - Year-over-year growth 2025-2030 (%)

12.4.6 Indonesia - Market size and forecast 2025-2030

Chart on Indonesia - Market size and forecast 2025-2030 ($ million)
Data Table on Indonesia - Market size and forecast 2025-2030 ($ million)
Chart on Indonesia - Year-over-year growth 2025-2030 (%)
Data Table on Indonesia - Year-over-year growth 2025-2030 (%)

12.5 Europe - Market size and forecast 2025-2030

Chart on Europe - Market size and forecast 2025-2030 ($ million)
Data Table on Europe - Market size and forecast 2025-2030 ($ million)
Chart on Europe - Year-over-year growth 2025-2030 (%)
Data Table on Europe - Year-over-year growth 2025-2030 (%)
Chart on Regional Comparison - Europe
Data Table on Regional Comparison - Europe

12.5.1 UK - Market size and forecast 2025-2030

Chart on UK - Market size and forecast 2025-2030 ($ million)
Data Table on UK - Market size and forecast 2025-2030 ($ million)
Chart on UK - Year-over-year growth 2025-2030 (%)
Data Table on UK - Year-over-year growth 2025-2030 (%)

12.5.2 Germany - Market size and forecast 2025-2030

Chart on Germany - Market size and forecast 2025-2030 ($ million)
Data Table on Germany - Market size and forecast 2025-2030 ($ million)
Chart on Germany - Year-over-year growth 2025-2030 (%)
Data Table on Germany - Year-over-year growth 2025-2030 (%)

12.5.3 France - Market size and forecast 2025-2030

Chart on France - Market size and forecast 2025-2030 ($ million)
Data Table on France - Market size and forecast 2025-2030 ($ million)
Chart on France - Year-over-year growth 2025-2030 (%)
Data Table on France - Year-over-year growth 2025-2030 (%)

12.5.4 Italy - Market size and forecast 2025-2030

Chart on Italy - Market size and forecast 2025-2030 ($ million)
Data Table on Italy - Market size and forecast 2025-2030 ($ million)
Chart on Italy - Year-over-year growth 2025-2030 (%)
Data Table on Italy - Year-over-year growth 2025-2030 (%)

12.5.5 Spain - Market size and forecast 2025-2030

Chart on Spain - Market size and forecast 2025-2030 ($ million)
Data Table on Spain - Market size and forecast 2025-2030 ($ million)
Chart on Spain - Year-over-year growth 2025-2030 (%)
Data Table on Spain - Year-over-year growth 2025-2030 (%)

12.5.6 The Netherlands - Market size and forecast 2025-2030

Chart on The Netherlands - Market size and forecast 2025-2030 ($ million)
Data Table on The Netherlands - Market size and forecast 2025-2030 ($ million)
Chart on The Netherlands - Year-over-year growth 2025-2030 (%)
Data Table on The Netherlands - Year-over-year growth 2025-2030 (%)

12.6 South America - Market size and forecast 2025-2030

Chart on South America - Market size and forecast 2025-2030 ($ million)
Data Table on South America - Market size and forecast 2025-2030 ($ million)
Chart on South America - Year-over-year growth 2025-2030 (%)
Data Table on South America - Year-over-year growth 2025-2030 (%)
Chart on Regional Comparison - South America
Data Table on Regional Comparison - South America

12.6.1 Brazil - Market size and forecast 2025-2030

Chart on Brazil - Market size and forecast 2025-2030 ($ million)
Data Table on Brazil - Market size and forecast 2025-2030 ($ million)
Chart on Brazil - Year-over-year growth 2025-2030 (%)
Data Table on Brazil - Year-over-year growth 2025-2030 (%)

12.6.2 Argentina - Market size and forecast 2025-2030

Chart on Argentina - Market size and forecast 2025-2030 ($ million)
Data Table on Argentina - Market size and forecast 2025-2030 ($ million)
Chart on Argentina - Year-over-year growth 2025-2030 (%)
Data Table on Argentina - Year-over-year growth 2025-2030 (%)

12.6.3 Chile - Market size and forecast 2025-2030

Chart on Chile - Market size and forecast 2025-2030 ($ million)
Data Table on Chile - Market size and forecast 2025-2030 ($ million)
Chart on Chile - Year-over-year growth 2025-2030 (%)
Data Table on Chile - Year-over-year growth 2025-2030 (%)

12.7 Middle East and Africa - Market size and forecast 2025-2030

Chart on Middle East and Africa - Market size and forecast 2025-2030 ($ million)
Data Table on Middle East and Africa - Market size and forecast 2025-2030 ($ million)
Chart on Middle East and Africa - Year-over-year growth 2025-2030 (%)
Data Table on Middle East and Africa - Year-over-year growth 2025-2030 (%)
Chart on Regional Comparison - Middle East and Africa
Data Table on Regional Comparison - Middle East and Africa

12.7.1 Saudi Arabia - Market size and forecast 2025-2030

Chart on Saudi Arabia - Market size and forecast 2025-2030 ($ million)
Data Table on Saudi Arabia - Market size and forecast 2025-2030 ($ million)
Chart on Saudi Arabia - Year-over-year growth 2025-2030 (%)
Data Table on Saudi Arabia - Year-over-year growth 2025-2030 (%)

12.7.2 UAE - Market size and forecast 2025-2030

Chart on UAE - Market size and forecast 2025-2030 ($ million)
Data Table on UAE - Market size and forecast 2025-2030 ($ million)
Chart on UAE - Year-over-year growth 2025-2030 (%)
Data Table on UAE - Year-over-year growth 2025-2030 (%)

12.7.3 South Africa - Market size and forecast 2025-2030

Chart on South Africa - Market size and forecast 2025-2030 ($ million)
Data Table on South Africa - Market size and forecast 2025-2030 ($ million)
Chart on South Africa - Year-over-year growth 2025-2030 (%)
Data Table on South Africa - Year-over-year growth 2025-2030 (%)

12.7.4 Israel - Market size and forecast 2025-2030

Chart on Israel - Market size and forecast 2025-2030 ($ million)
Data Table on Israel - Market size and forecast 2025-2030 ($ million)
Chart on Israel - Year-over-year growth 2025-2030 (%)
Data Table on Israel - Year-over-year growth 2025-2030 (%)

12.7.5 Turkey - Market size and forecast 2025-2030

Chart on Turkey - Market size and forecast 2025-2030 ($ million)
Data Table on Turkey - Market size and forecast 2025-2030 ($ million)
Chart on Turkey - Year-over-year growth 2025-2030 (%)
Data Table on Turkey - Year-over-year growth 2025-2030 (%)

12.8 Market opportunity by geography

Market opportunity by geography ($ million)
Data Tables on Market opportunity by geography ($ million)

13. Drivers, Challenges, and Opportunity

13.1 Market drivers

Escalating demand for network centric warfare and multi domain integration
Adoption of AI and advanced data analytics for decision superiority
Modernization of legacy infrastructure and platform upgrades

13.2 Market challenges

Cybersecurity vulnerabilities and data protection in network centric warfare
Systems interoperability and integration of legacy platforms
Supply chain resilience and technological obsolescence

13.3 Impact of drivers and challenges

Impact of drivers and challenges in 2025 and 2030

13.4 Market opportunities

Integration of AI and autonomous orchestration
Migration toward cloud native and decentralized architectures
Standardization through open architecture frameworks

14. Competitive Landscape

14.1 Overview

14.2

Overview on criticality of inputs and factors of differentiation

14.3 Landscape disruption

Overview on factors of disruption

14.4 Industry risks

Impact of key risks on business

15. Competitive Analysis

15.1 Companies profiled

Companies covered

15.2 Company ranking index

15.3 Market positioning of companies

Matrix on companies position and classification

15.4 Airbus SE

Airbus SE - Overview
Airbus SE - Business segments
Airbus SE - Key news
Airbus SE - Key offerings
Airbus SE - Segment focus
SWOT

15.5 Atos SE

Atos SE - Overview
Atos SE - Business segments
Atos SE - Key offerings
Atos SE - Segment focus
SWOT

15.6 BAE Systems Plc

BAE Systems Plc - Overview
BAE Systems Plc - Business segments
BAE Systems Plc - Key offerings
BAE Systems Plc - Segment focus
SWOT

15.7 General Dynamics Corp.

General Dynamics Corp. - Overview
General Dynamics Corp. - Business segments
General Dynamics Corp. - Key offerings
General Dynamics Corp. - Segment focus
SWOT

15.8 IBM Corp.

IBM Corp. - Overview
IBM Corp. - Business segments
IBM Corp. - Key news
IBM Corp. - Key offerings
IBM Corp. - Segment focus
SWOT

15.9 Indra Sistemas SA

Indra Sistemas SA - Overview
Indra Sistemas SA - Business segments
Indra Sistemas SA - Key offerings
Indra Sistemas SA - Segment focus
SWOT

15.10 L3Harris Technologies Inc.

L3Harris Technologies Inc. - Overview
L3Harris Technologies Inc. - Business segments
L3Harris Technologies Inc. - Key offerings
L3Harris Technologies Inc. - Segment focus
SWOT

15.11 Leidos Holdings Inc.

Leidos Holdings Inc. - Overview
Leidos Holdings Inc. - Business segments
Leidos Holdings Inc. - Key offerings
Leidos Holdings Inc. - Segment focus
SWOT

15.12 Lockheed Martin Corp.

Lockheed Martin Corp. - Overview
Lockheed Martin Corp. - Business segments
Lockheed Martin Corp. - Key offerings
Lockheed Martin Corp. - Segment focus
SWOT

15.13 Motorola Solutions Inc.

Motorola Solutions Inc. - Overview
Motorola Solutions Inc. - Business segments
Motorola Solutions Inc. - Key news
Motorola Solutions Inc. - Key offerings
Motorola Solutions Inc. - Segment focus
SWOT

15.14 Northrop Grumman Corp.

Northrop Grumman Corp. - Overview
Northrop Grumman Corp. - Business segments
Northrop Grumman Corp. - Key offerings
Northrop Grumman Corp. - Segment focus
SWOT

15.15 Rheinmetall AG

Rheinmetall AG - Overview
Rheinmetall AG - Business segments
Rheinmetall AG - Key offerings
Rheinmetall AG - Segment focus
SWOT

15.16 Saab AB

Saab AB - Overview
Saab AB - Business segments
Saab AB - Key offerings
Saab AB - Segment focus
SWOT

15.17 Thales Group

Thales Group - Overview
Thales Group - Business segments
Thales Group - Key offerings
Thales Group - Segment focus
SWOT

15.18 The Boeing Co.

The Boeing Co. - Overview
The Boeing Co. - Business segments
The Boeing Co. - Key news
The Boeing Co. - Key offerings
The Boeing Co. - Segment focus
SWOT

16. Appendix

16.1 Scope of the report

Market definition
Objectives
Notes and caveats

16.2 Inclusions and exclusions checklist

Inclusions checklist
Exclusions checklist

16.3 Currency conversion rates for US$

16.4 Research methodology

16.5 Data procurement

Information sources

16.6 Data validation

16.7 Validation techniques employed for market sizing

16.8 Data synthesis

16.9 360 degree market analysis

16.10 List of abbreviations

Research Methodology

Technavio presents a detailed picture of the market by way of study, synthesis, and summation of data from multiple sources. The analysts have presented the various facets of the market with a particular focus on identifying the key industry influencers. The data thus presented is comprehensive, reliable, and the result of extensive research, both primary and secondary.

INFORMATION SOURCES

Primary sources

  • Manufacturers and suppliers
  • Channel partners
  • Industry experts
  • Strategic decision makers

Secondary sources

  • Industry journals and periodicals
  • Government data
  • Financial reports of key industry players
  • Historical data
  • Press releases

DATA ANALYSIS

Data Synthesis

  • Collation of data
  • Estimation of key figures
  • Analysis of derived insights

Data Validation

  • Triangulation with data models
  • Reference against proprietary databases
  • Corroboration with industry experts

REPORT WRITING

Qualitative

  • Market drivers
  • Market challenges
  • Market trends
  • Five forces analysis

Quantitative

  • Market size and forecast
  • Market segmentation
  • Geographical insights
  • Competitive landscape

Interested in this report?

Get your sample now to see our research methodology and insights!

Download Now

Frequently Asked Questions

Command And Control Systems market growth will increase by USD 3074.5 million during 2026-2030.

The Command And Control Systems market is expected to grow at a CAGR of 2.3% during 2026-2030.

Command And Control Systems market is segmented by Application (Government and defense, Commercial, Homeland security) Platform (Land, Airborne, Naval, Space) Solution (Software, Hardware, Services)

Airbus SE, Atos SE, BAE Systems Plc, Elbit Systems Ltd., General Dynamics Corp., IBM Corp., Indra Sistemas SA, Kongsberg Gruppen ASA, L3Harris Technologies Inc., Leidos Holdings Inc., Leonardo S.p.A., Lockheed Martin Corp., Motorola Solutions Inc., Northrop Grumman Corp., Palantir Technologies Inc., Rheinmetall AG, RTX Corp., Saab AB, Thales Group, The Boeing Co. are a few of the key vendors in the Command And Control Systems market.

North America will register the highest growth rate of 63% among the other regions. Therefore, the Command And Control Systems market in North America is expected to garner significant business opportunities for the vendors during the forecast period.

US, Canada, Mexico, China, India, Japan, South Korea, Australia, Indonesia, UK, Germany, France, Italy, Spain, The Netherlands, Brazil, Argentina, Chile, Saudi Arabia, UAE, South Africa, Israel, Turkey

  • Escalating demand for network centric warfare and multi domain integration is the driving factor this market.

The Command And Control Systems market vendors should focus on grabbing business opportunities from the Application segment as it accounted for the largest market share in the base year.
RIA - Research AI Assistant
Ask RIA