3D Concrete Printing Market Analysis, Size, and Forecast 2026-2030: North America (US, Canada, and Mexico), APAC (China, India, and Japan), Europe (Germany, The Netherlands, and UK), Middle East and Africa (UAE, Saudi Arabia, and South Africa), South America (Brazil, Argentina, and Colombia), and Rest of World (ROW)

3D Concrete Printing Market Analysis, Size, and Forecast 2026-2030:
North America (US, Canada, and Mexico), APAC (China, India, and Japan), Europe (Germany, The Netherlands, and UK), Middle East and Africa (UAE, Saudi Arabia, and South Africa), South America (Brazil, Argentina, and Colombia), and Rest of World (ROW)

Published: Mar 2026 292 Pages SKU: IRTNTR81384

Market Overview at a Glance

$5.96 B
Market Opportunity
56.7%
CAGR 2025 - 2030
32.5%
APAC Growth
$259.59 Mn
On-site segment 2024

3D Concrete Printing Market Size 2026-2030

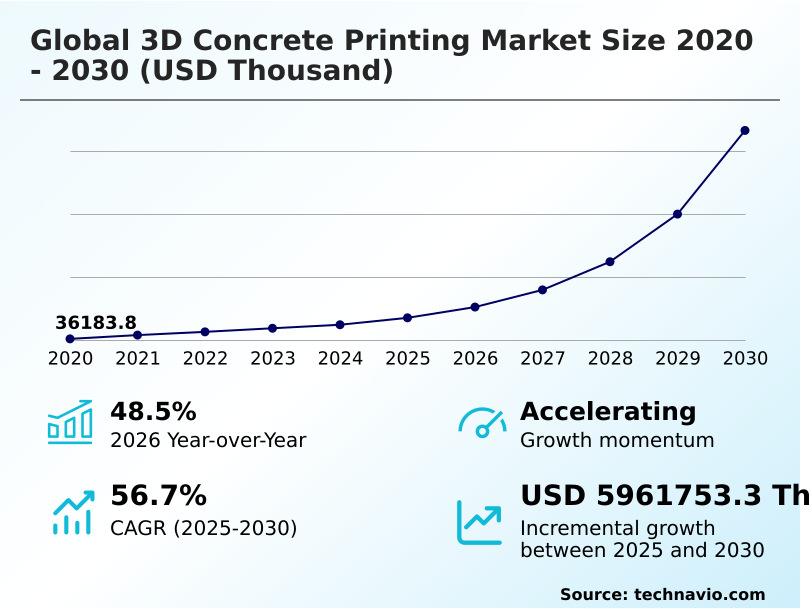
The 3d concrete printing market size is valued to increase by USD 5.96 billion, at a CAGR of 56.7% from 2025 to 2030. Increasing need for rapid and cost effective residential construction will drive the 3d concrete printing market.

Major Market Trends & Insights

  • APAC dominated the market and accounted for a 32.5% growth during the forecast period.
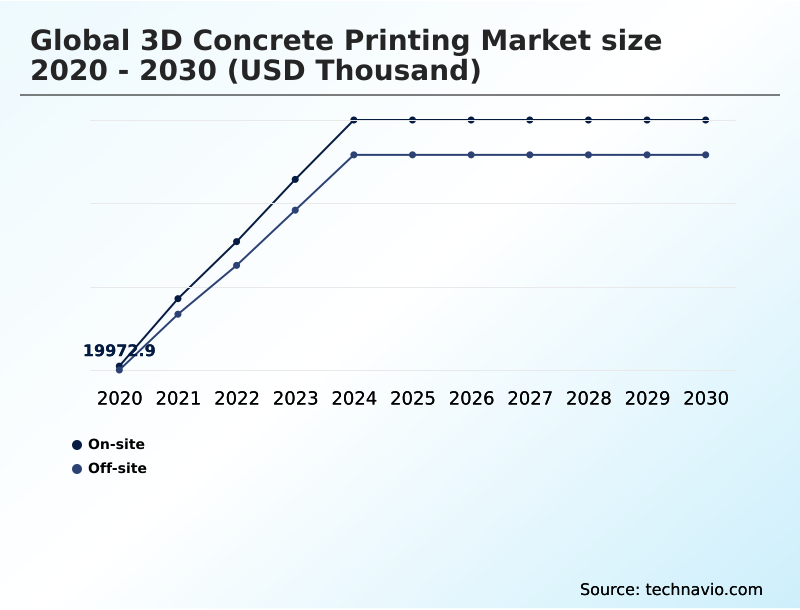
  • By Type - On-site segment was valued at USD 259.59 million in 2024
  • By Application - Residential construction segment accounted for the largest market revenue share in 2024

Market Size & Forecast

  • Market Opportunities:
  • Market Future Opportunities: USD 5.96 billion
  • CAGR from 2025 to 2030 : 56.7%

Market Summary

  • The 3D concrete printing market is defined by the advancement of additive manufacturing for construction, a transformative approach addressing chronic productivity bottlenecks and labor shortages. Key industry drivers include the urgent need for affordable housing and the global push toward sustainable construction methods.
  • The technology leverages robotic arm extrusion and gantry construction systems to perform layer-by-layer fabrication of structures, significantly reducing material waste and project timelines. Trends are moving toward smart material integration, including self-healing concrete and mixtures with enhanced thermal properties.
  • For instance, a business scenario in commercial development involves using topologically optimized structures created with generative design algorithms to construct an architecturally unique, energy-efficient building facade. This process, integrated with building information modeling, allows for the pre-simulation of the entire printing process, identifying potential flaws and reducing costly on-site errors.
  • However, the sector faces challenges related to the seamless incorporation of steel reinforcement and navigating fragmented regulatory frameworks that lack unified standards for structural concrete printing. The high initial capital investment for hardware and the premium cost of proprietary concrete ink also temper widespread adoption, particularly for smaller firms.

What will be the Size of the 3D Concrete Printing Market during the forecast period?

Get Key Insights on Market Forecast (PDF) Request Free Sample

How is the 3D Concrete Printing Market Segmented?

The 3d concrete printing industry research report provides comprehensive data (region-wise segment analysis), with forecasts and estimates in "USD thousand" for the period 2026-2030, as well as historical data from 2020-2024 for the following segments.

  • Type
    • On-site
    • Off-site
  • Application
    • Residential construction
    • Commercial construction
    • Public infrastructure
    • Industrial construction
  • Technology
    • Gantry-based systems
    • Robotic arm-based systems
  • Geography
    • North America
      • US
      • Canada
      • Mexico
    • APAC
      • China
      • India
      • Japan
    • Europe
      • Germany
      • The Netherlands
      • UK
    • Middle East and Africa
      • UAE
      • Saudi Arabia
      • South Africa
    • South America
      • Brazil
      • Argentina
      • Colombia
    • Rest of World (ROW)

By Type Insights

The on-site segment is estimated to witness significant growth during the forecast period.

On-site deployment, involving the direct extrusion of cementitious materials at the final project location, is redefining construction supply chains.

This methodology, central to many automated building solutions, leverages on-site concrete printing to eliminate the heavy transport logistics associated with precast components, which can reduce related carbon emissions by over 50%.

The use of automated deposition systems and mobile 3D printers facilitates a continuous workflow for foundations and walls, minimizing complex assembly joints.

However, this approach requires advanced material formulations and material rheology control to counter environmental variables like temperature and humidity that impact curing times and structural integrity.

Effective digital construction technology and automated quality control are essential for managing these variables, ensuring enhanced structural longevity and achieving operational efficiency gains in residential housing construction and commercial infrastructure development.

Request Free Sample

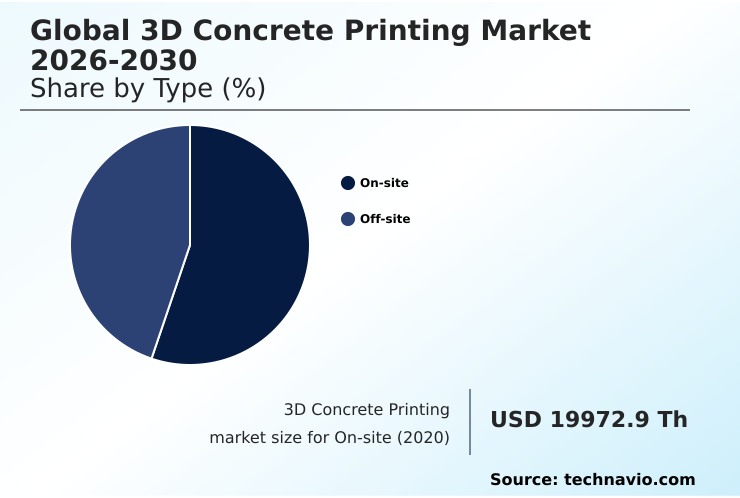
The On-site segment was valued at USD 259.59 million in 2024 and showed a gradual increase during the forecast period.

Request Free Sample

Regional Analysis

APAC is estimated to contribute 32.5% to the growth of the global market during the forecast period.Technavio’s analysts have elaborately explained the regional trends and drivers that shape the market during the forecast period.

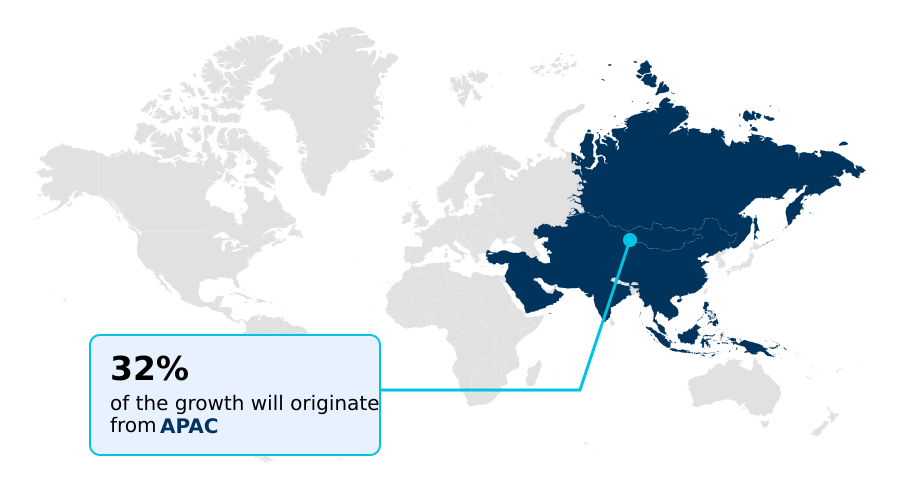
See How 3D Concrete Printing Market Demand is Rising in APAC Request Free Sample

The geographic landscape is characterized by varying adoption rates, with APAC leading due to massive urbanization and government-backed infrastructure initiatives driving demand for rapid construction timelines.

In North America, the focus is on advanced robotic automation and digital twin modeling to address labor shortages and build disaster relief structures, with some firms reporting a 40% reduction in on-site labor requirements.

Europe prioritizes low-carbon concrete mixtures and architectural aesthetics customization, driven by stringent environmental regulations and a focus on urban regeneration projects.

Key to global expansion is the development of high-strength concrete formulations and advanced polymer infusions that can adapt to diverse climates, from the extreme heat in the Middle East to cold regions requiring specialized non-combustible building materials.

Market Dynamics

Our researchers analyzed the data with 2025 as the base year, along with the key drivers, trends, and challenges. A holistic analysis of drivers will help companies refine their marketing strategies to gain a competitive advantage.

  • The technical evolution of the market is focused on resolving fundamental engineering challenges to broaden its application scope. A primary hurdle is achieving the seamless incorporation of steel reinforcement to enhance tensile strength, a critical factor for structures in seismic zones.
  • Equally important is ensuring proper interlayer adhesion in layered concrete, as delamination can compromise the structural integrity of printed walls. As the technology scales, its application in the automated fabrication of warehouse facilities and printing multi-story residential buildings becomes more viable.
  • This scalability is influenced by the choice between the agility of robotic arm-based systems mobility and the stability of gantry-based systems for large scale printing. The integration of smart materials in construction and the potential use of lunar regolith in printing for extraterrestrial applications highlight future trends.
  • Current practical applications include the printing of pedestrian bridges and the customization of architectural facades with printing. For broader adoption, the development of cold weather extrusion materials is essential for northern climates. Sustainability is advanced by using recycled industrial byproducts in concrete, which can lead to a 30% reduction in carbon footprint compared to conventional mixes.
  • Key value propositions include cost reduction through automated construction and the enhanced fire resistance of printed walls. Architects are now optimizing thermal mass with architectural design, enabled by real-time monitoring of cement curing. The automation of the process is key to reducing labor dependency with automation and building affordable housing with automation.
  • Ultimately, overcoming high initial capital investment remains a significant barrier for smaller enterprises.

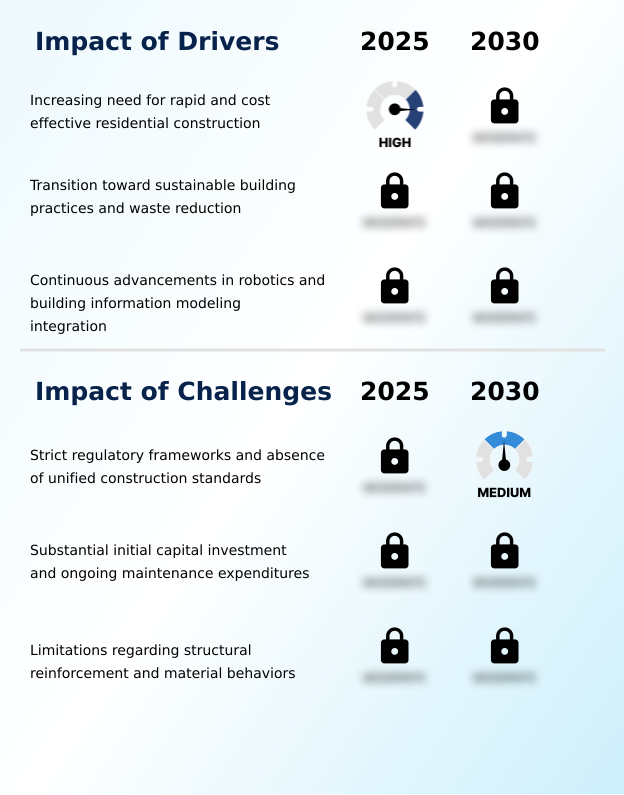
What are the key market drivers leading to the rise in the adoption of 3D Concrete Printing Industry?

  • The increasing need for rapid and cost-effective residential construction is a key driver for the market.

  • The increasing need for cost-effective building solutions is a primary market driver, as automated extrusion systems accelerate rapid construction timelines for residential housing construction and industrial construction applications.
  • Utilizing building information modeling integration and generative design algorithms enables custom formwork elimination, which can shorten project schedules by up to 60% compared to traditional methods.
  • Continuous advancements in robotic construction technologies and gantry construction systems are making large-scale additive manufacturing more accessible.
  • This decentralized manufacturing approach, coupled with sustainable building practices like using recycled industrial byproducts in concrete, helps firms achieve stringent environmental certifications and improve supply chain resilience, leading to significant operational efficiency gains across the sector.

What are the market trends shaping the 3D Concrete Printing Industry?

  • A key trend is the market's expansion into infrastructure construction for extraterrestrial and extreme environments. This involves developing technologies for applications beyond traditional urban settings.

  • A prominent trajectory involves the integration of smart materials in construction, specifically self-healing cementitious mixtures and advanced cementitious materials that promise enhanced structural longevity. This trend extends to the incorporation of conductive nanomaterials, enabling structures to function as sensor networks for structural health monitoring.
  • The development of cold weather extrusion materials is also gaining traction, enabling extraterrestrial construction methods and building in extreme environment infrastructure. Such innovations in advanced material science are transforming the lifecycle of commercial structures, with some projects reporting a 25% reduction in long-term maintenance costs.
  • The ultimate goal is a fully autonomous ecosystem where buildings not only utilize eco-friendly cement blends but also manage their own structural maintenance, aligning with circular economy principles and sustainable construction methods.

What challenges does the 3D Concrete Printing Industry face during its growth?

  • Strict regulatory frameworks and the absence of unified construction standards present a key challenge affecting industry growth.

  • The primary challenge remains the overcoming high initial capital investment required for industrial grade gantry systems and robotic arm extrusion hardware. Beyond equipment costs, the need for specialized printable concrete feedstock and proprietary concrete ink adds operational expenses.
  • A significant hurdle is the interlayer adhesion in layered concrete, which can be compromised by environmental variables, affecting the structural integrity of printed walls. Furthermore, the industry grapples with the need for building code modernization and the seamless incorporation of steel reinforcement, which is critical for creating seismic-resilient structures.
  • The absence of unified standards complicates public infrastructure fabrication and urban regeneration projects, as regulatory approval times can be twice as long as for conventional methods.

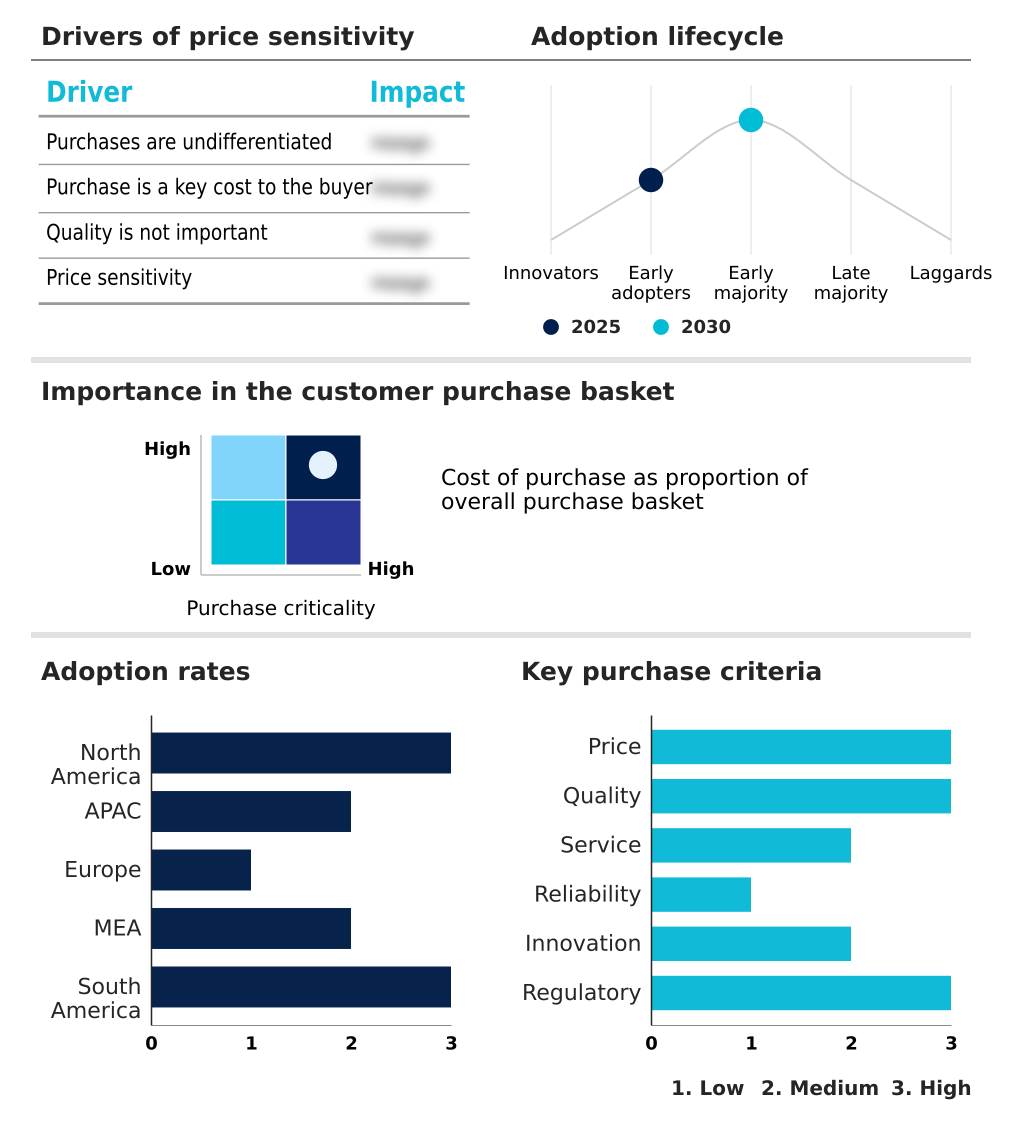
Exclusive Technavio Analysis on Customer Landscape

The 3d concrete printing market forecasting report includes the adoption lifecycle of the market, covering from the innovator’s stage to the laggard’s stage. It focuses on adoption rates in different regions based on penetration. Furthermore, the 3d concrete printing market report also includes key purchase criteria and drivers of price sensitivity to help companies evaluate and develop their market growth analysis strategies.

Customer Landscape of 3D Concrete Printing Industry

Competitive Landscape

Companies are implementing various strategies, such as strategic alliances, 3d concrete printing market forecast, partnerships, mergers and acquisitions, geographical expansion, and product/service launches, to enhance their presence in the industry.

ALQUIST - Analysis indicates a focus on integrated hardware and proprietary material systems, including robotic printers and specialized rapid-curing mortars designed for affordable and sustainable construction applications.

The industry research and growth report includes detailed analyses of the competitive landscape of the market and information about key companies, including:

  • ALQUIST
  • Apis Cor
  • Black Buffalo 3D Corporation
  • CEMEX SAB de CV
  • COBOD International AS
  • Constructions-3D
  • Contour Crafting Corp.
  • CyBe Construction
  • Heidelberg Materials AG
  • Holcim Ltd.
  • ICON Technology Inc.
  • Mighty Buildings Inc.
  • MudBots
  • PERI 3D Construction
  • Sika AG
  • SQ4D LLC
  • Twente Additive Manufacturing.
  • Vertico
  • WASP
  • XtreeE

Qualitative and quantitative analysis of companies has been conducted to help clients understand the wider business environment as well as the strengths and weaknesses of key industry players. Data is qualitatively analyzed to categorize companies as pure play, category-focused, industry-focused, and diversified; it is quantitatively analyzed to categorize companies as dominant, leading, strong, tentative, and weak.

Recent Development and News in 3d concrete printing market

  • In April 2025, Starbucks launched its first 3D-printed store in the United States, opening a new drive-thru location in Texas built with additive manufacturing techniques.
  • In January 2025, CEMEX SAB de CV announced a strategic collaboration with COBOD International AS to optimize its D.fab admixture for high-speed printing with BOD2 gantry systems, aiming to reduce material costs.
  • In November 2024, ICON Technology Inc. secured a major government contract to build a community of 50 resilient, 3D-printed homes in a disaster-prone region, leveraging its Vulcan construction system and Lavacrete material.
  • In September 2024, Mighty Buildings Inc. closed a Series C funding round, securing significant capital to scale up its factory-based production of carbon-neutral, prefabricated 3D-printed composite building panels.

Dive into Technavio’s robust research methodology, blending expert interviews, extensive data synthesis, and validated models for unparalleled 3D Concrete Printing Market insights. See full methodology.

Market Scope
Page number 292
Base year 2025
Historic period 2020-2024
Forecast period 2026-2030
Growth momentum & CAGR Accelerate at a CAGR of 56.7%
Market growth 2026-2030 USD 5961753.3 thousand
Market structure Fragmented
YoY growth 2025-2026(%) 48.5%
Key countries US, Canada, Mexico, China, India, Japan, South Korea, Australia, Indonesia, Germany, The Netherlands, UK, France, Italy, Spain, UAE, Saudi Arabia, South Africa, Israel, Turkey, Brazil, Argentina and Colombia
Competitive landscape Leading Companies, Market Positioning of Companies, Competitive Strategies, and Industry Risks

Request Free Sample

Research Analyst Overview

  • The 3D concrete printing market's evolution is driven by the convergence of additive manufacturing for construction and digital construction technology. On-site activity is dominated by gantry construction systems and increasingly agile mobile 3D printers performing on-site concrete printing, while multi-axis robotic printing arms enable complex off-site fabrication of prefabricated composite panels.
  • The core process, extrusion-based fabrication, relies on cementitious material deposition of printable concrete feedstock through precise material rheology control. This layer-by-layer fabrication is guided by robotic path planning algorithms linked with building information modeling integration.
  • Boardroom decisions are increasingly influenced by sustainability metrics, with firms adopting low-carbon concrete mixtures and eco-friendly cement blends to achieve zero-emission construction sites and adhere to sustainable building practices. Material innovation is key, with R&D focused on advanced cementitious materials, rapid-curing mortar, self-healing cementitious mixtures, high-strength concrete formulations, and advanced polymer infusions.
  • The use of proprietary concrete ink within automated building solutions enables the creation of topologically optimized structures via generative design algorithms, leading to the custom formwork elimination that cuts preliminary work by over 40%. The shift toward autonomous robotic construction is enabled by both robotic arm extrusion and industrial grade gantry systems executing large-scale additive manufacturing and structural concrete printing.
  • This progress in advanced material science is critical for developing non-combustible building materials and effective structural reinforcement techniques.

What are the Key Data Covered in this 3D Concrete Printing Market Research and Growth Report?

  • What is the expected growth of the 3D Concrete Printing Market between 2026 and 2030?

    • USD 5.96 billion, at a CAGR of 56.7%

  • What segmentation does the market report cover?

    • The report is segmented by Type (On-site, and Off-site), Application (Residential construction, Commercial construction, Public infrastructure, and Industrial construction), Technology (Gantry-based systems, and Robotic arm-based systems) and Geography (North America, APAC, Europe, Middle East and Africa, South America)

  • Which regions are analyzed in the report?

    • North America, APAC, Europe, Middle East and Africa and South America

  • What are the key growth drivers and market challenges?

    • Increasing need for rapid and cost effective residential construction, Strict regulatory frameworks and absence of unified construction standards

  • Who are the major players in the 3D Concrete Printing Market?

    • ALQUIST, Apis Cor, Black Buffalo 3D Corporation, CEMEX SAB de CV, COBOD International AS, Constructions-3D, Contour Crafting Corp., CyBe Construction, Heidelberg Materials AG, Holcim Ltd., ICON Technology Inc., Mighty Buildings Inc., MudBots, PERI 3D Construction, Sika AG, SQ4D LLC, Twente Additive Manufacturing., Vertico, WASP and XtreeE

Market Research Insights

  • The market is characterized by a rapid evolution in robotic construction technologies that enable architectural aesthetics customization and the creation of complex geometric structures. These advanced material formulations facilitate rapid construction timelines, with some projects demonstrating a 50% schedule compression over conventional methods. Applications are diversifying from residential housing construction to commercial infrastructure development and public infrastructure fabrication.
  • The drive for cost-effective building solutions is paramount, with advanced robotic automation delivering operational efficiency gains by reducing labor inputs by up to 70%. The focus on sustainable construction methods and reduced material waste also aligns with circular economy principles, creating a compelling value proposition across multiple sectors from industrial construction applications to disaster relief structures.

We can help! Our analysts can customize this 3d concrete printing market research report to meet your requirements.

Get in touch

1. Executive Summary

1.1 Market overview

Executive Summary - Chart on Market Overview
Executive Summary - Data Table on Market Overview
Executive Summary - Chart on Global Market Characteristics
Executive Summary - Chart on Market by Geography
Executive Summary - Chart on Market Segmentation by Type
Executive Summary - Chart on Market Segmentation by Application
Executive Summary - Chart on Market Segmentation by Technology
Executive Summary - Chart on Incremental Growth
Executive Summary - Data Table on Incremental Growth
Executive Summary - Chart on Company Market Positioning

2. Technavio Analysis

2.1 Analysis of price sensitivity, lifecycle, customer purchase basket, adoption rates, and purchase criteria

2.2 Criticality of inputs and Factors of differentiation

Chart on Overview on criticality of inputs and factors of differentiation

2.3 Factors of disruption

Chart on Overview on factors of disruption

2.4 Impact of drivers and challenges

Chart on Impact of drivers and challenges in 2025 and 2030

3. Market Landscape

3.1 Market ecosystem

Chart on Parent Market
Data Table on - Parent Market

3.2 Market characteristics

Chart on Market characteristics analysis

3.3 Value chain analysis

Chart on Value chain analysis

4. Market Sizing

4.1 Market definition

Data Table on Offerings of companies included in the market definition

4.2 Market segment analysis

Market segments

4.3 Market size 2025

4.4 Market outlook: Forecast for 2025-2030

Chart on Global - Market size and forecast 2025-2030 ($ thousand)
Data Table on Global - Market size and forecast 2025-2030 ($ thousand)
Chart on Global Market: Year-over-year growth 2025-2030 (%)
Data Table on Global Market: Year-over-year growth 2025-2030 (%)

5. Historic Market Size

5.1 Global 3D Concrete Printing Market 2020 - 2024

Historic Market Size - Data Table on Global 3D Concrete Printing Market 2020 - 2024 ($ thousand)

5.2 Type segment analysis 2020 - 2024

Historic Market Size - Type Segment 2020 - 2024 ($ thousand)

5.3 Application segment analysis 2020 - 2024

Historic Market Size - Application Segment 2020 - 2024 ($ thousand)

5.4 Technology segment analysis 2020 - 2024

Historic Market Size - Technology Segment 2020 - 2024 ($ thousand)

5.5 Geography segment analysis 2020 - 2024

Historic Market Size - Geography Segment 2020 - 2024 ($ thousand)

5.6 Country segment analysis 2020 - 2024

Historic Market Size - Country Segment 2020 - 2024 ($ thousand)

6. Qualitative Analysis

6.1 Impact of AI on Global 3D Concrete Printing Market

6.2 Impact of Geopolitical Conflicts on Global 3D Concrete Printing Market

7. Five Forces Analysis

7.1 Five forces summary

Five forces analysis - Comparison between 2025 and 2030

7.2 Bargaining power of buyers

Bargaining power of buyers - Impact of key factors 2025 and 2030

7.3 Bargaining power of suppliers

Bargaining power of suppliers - Impact of key factors in 2025 and 2030

7.4 Threat of new entrants

Threat of new entrants - Impact of key factors in 2025 and 2030

7.5 Threat of substitutes

Threat of substitutes - Impact of key factors in 2025 and 2030

7.6 Threat of rivalry

Threat of rivalry - Impact of key factors in 2025 and 2030

7.7 Market condition

Chart on Market condition - Five forces 2025 and 2030

8. Market Segmentation by Type

8.1 Market segments

Chart on Type - Market share 2025-2030 (%)
Data Table on Type - Market share 2025-2030 (%)

8.2 Comparison by Type

Chart on Comparison by Type
Data Table on Comparison by Type

8.3 On-site - Market size and forecast 2025-2030

Chart on On-site - Market size and forecast 2025-2030 ($ thousand)
Data Table on On-site - Market size and forecast 2025-2030 ($ thousand)
Chart on On-site - Year-over-year growth 2025-2030 (%)
Data Table on On-site - Year-over-year growth 2025-2030 (%)

8.4 Off-site - Market size and forecast 2025-2030

Chart on Off-site - Market size and forecast 2025-2030 ($ thousand)
Data Table on Off-site - Market size and forecast 2025-2030 ($ thousand)
Chart on Off-site - Year-over-year growth 2025-2030 (%)
Data Table on Off-site - Year-over-year growth 2025-2030 (%)

8.5 Market opportunity by Type

Market opportunity by Type ($ thousand)
Data Table on Market opportunity by Type ($ thousand)

9. Market Segmentation by Application

9.1 Market segments

Chart on Application - Market share 2025-2030 (%)
Data Table on Application - Market share 2025-2030 (%)

9.2 Comparison by Application

Chart on Comparison by Application
Data Table on Comparison by Application

9.3 Residential construction - Market size and forecast 2025-2030

Chart on Residential construction - Market size and forecast 2025-2030 ($ thousand)
Data Table on Residential construction - Market size and forecast 2025-2030 ($ thousand)
Chart on Residential construction - Year-over-year growth 2025-2030 (%)
Data Table on Residential construction - Year-over-year growth 2025-2030 (%)

9.4 Commercial construction - Market size and forecast 2025-2030

Chart on Commercial construction - Market size and forecast 2025-2030 ($ thousand)
Data Table on Commercial construction - Market size and forecast 2025-2030 ($ thousand)
Chart on Commercial construction - Year-over-year growth 2025-2030 (%)
Data Table on Commercial construction - Year-over-year growth 2025-2030 (%)

9.5 Public infrastructure - Market size and forecast 2025-2030

Chart on Public infrastructure - Market size and forecast 2025-2030 ($ thousand)
Data Table on Public infrastructure - Market size and forecast 2025-2030 ($ thousand)
Chart on Public infrastructure - Year-over-year growth 2025-2030 (%)
Data Table on Public infrastructure - Year-over-year growth 2025-2030 (%)

9.6 Industrial construction - Market size and forecast 2025-2030

Chart on Industrial construction - Market size and forecast 2025-2030 ($ thousand)
Data Table on Industrial construction - Market size and forecast 2025-2030 ($ thousand)
Chart on Industrial construction - Year-over-year growth 2025-2030 (%)
Data Table on Industrial construction - Year-over-year growth 2025-2030 (%)

9.7 Market opportunity by Application

Market opportunity by Application ($ thousand)
Data Table on Market opportunity by Application ($ thousand)

10. Market Segmentation by Technology

10.1 Market segments

Chart on Technology - Market share 2025-2030 (%)
Data Table on Technology - Market share 2025-2030 (%)

10.2 Comparison by Technology

Chart on Comparison by Technology
Data Table on Comparison by Technology

10.3 Gantry-based systems - Market size and forecast 2025-2030

Chart on Gantry-based systems - Market size and forecast 2025-2030 ($ thousand)
Data Table on Gantry-based systems - Market size and forecast 2025-2030 ($ thousand)
Chart on Gantry-based systems - Year-over-year growth 2025-2030 (%)
Data Table on Gantry-based systems - Year-over-year growth 2025-2030 (%)

10.4 Robotic arm-based systems - Market size and forecast 2025-2030

Chart on Robotic arm-based systems - Market size and forecast 2025-2030 ($ thousand)
Data Table on Robotic arm-based systems - Market size and forecast 2025-2030 ($ thousand)
Chart on Robotic arm-based systems - Year-over-year growth 2025-2030 (%)
Data Table on Robotic arm-based systems - Year-over-year growth 2025-2030 (%)

10.5 Market opportunity by Technology

Market opportunity by Technology ($ thousand)
Data Table on Market opportunity by Technology ($ thousand)

11. Customer Landscape

11.1 Customer landscape overview

Analysis of price sensitivity, lifecycle, customer purchase basket, adoption rates, and purchase criteria

12. Geographic Landscape

12.1 Geographic segmentation

Chart on Market share by geography 2025-2030 (%)
Data Table on Market share by geography 2025-2030 (%)

12.2 Geographic comparison

Chart on Geographic comparison
Data Table on Geographic comparison

12.3 North America - Market size and forecast 2025-2030

Chart on North America - Market size and forecast 2025-2030 ($ thousand)
Data Table on North America - Market size and forecast 2025-2030 ($ thousand)
Chart on North America - Year-over-year growth 2025-2030 (%)
Data Table on North America - Year-over-year growth 2025-2030 (%)
Chart on Regional Comparison - North America
Data Table on Regional Comparison - North America

12.3.1 US - Market size and forecast 2025-2030

Chart on US - Market size and forecast 2025-2030 ($ thousand)
Data Table on US - Market size and forecast 2025-2030 ($ thousand)
Chart on US - Year-over-year growth 2025-2030 (%)
Data Table on US - Year-over-year growth 2025-2030 (%)

12.3.2 Canada - Market size and forecast 2025-2030

Chart on Canada - Market size and forecast 2025-2030 ($ thousand)
Data Table on Canada - Market size and forecast 2025-2030 ($ thousand)
Chart on Canada - Year-over-year growth 2025-2030 (%)
Data Table on Canada - Year-over-year growth 2025-2030 (%)

12.3.3 Mexico - Market size and forecast 2025-2030

Chart on Mexico - Market size and forecast 2025-2030 ($ thousand)
Data Table on Mexico - Market size and forecast 2025-2030 ($ thousand)
Chart on Mexico - Year-over-year growth 2025-2030 (%)
Data Table on Mexico - Year-over-year growth 2025-2030 (%)

12.4 APAC - Market size and forecast 2025-2030

Chart on APAC - Market size and forecast 2025-2030 ($ thousand)
Data Table on APAC - Market size and forecast 2025-2030 ($ thousand)
Chart on APAC - Year-over-year growth 2025-2030 (%)
Data Table on APAC - Year-over-year growth 2025-2030 (%)
Chart on Regional Comparison - APAC
Data Table on Regional Comparison - APAC

12.4.1 China - Market size and forecast 2025-2030

Chart on China - Market size and forecast 2025-2030 ($ thousand)
Data Table on China - Market size and forecast 2025-2030 ($ thousand)
Chart on China - Year-over-year growth 2025-2030 (%)
Data Table on China - Year-over-year growth 2025-2030 (%)

12.4.2 India - Market size and forecast 2025-2030

Chart on India - Market size and forecast 2025-2030 ($ thousand)
Data Table on India - Market size and forecast 2025-2030 ($ thousand)
Chart on India - Year-over-year growth 2025-2030 (%)
Data Table on India - Year-over-year growth 2025-2030 (%)

12.4.3 Japan - Market size and forecast 2025-2030

Chart on Japan - Market size and forecast 2025-2030 ($ thousand)
Data Table on Japan - Market size and forecast 2025-2030 ($ thousand)
Chart on Japan - Year-over-year growth 2025-2030 (%)
Data Table on Japan - Year-over-year growth 2025-2030 (%)

12.4.4 South Korea - Market size and forecast 2025-2030

Chart on South Korea - Market size and forecast 2025-2030 ($ thousand)
Data Table on South Korea - Market size and forecast 2025-2030 ($ thousand)
Chart on South Korea - Year-over-year growth 2025-2030 (%)
Data Table on South Korea - Year-over-year growth 2025-2030 (%)

12.4.5 Australia - Market size and forecast 2025-2030

Chart on Australia - Market size and forecast 2025-2030 ($ thousand)
Data Table on Australia - Market size and forecast 2025-2030 ($ thousand)
Chart on Australia - Year-over-year growth 2025-2030 (%)
Data Table on Australia - Year-over-year growth 2025-2030 (%)

12.4.6 Indonesia - Market size and forecast 2025-2030

Chart on Indonesia - Market size and forecast 2025-2030 ($ thousand)
Data Table on Indonesia - Market size and forecast 2025-2030 ($ thousand)
Chart on Indonesia - Year-over-year growth 2025-2030 (%)
Data Table on Indonesia - Year-over-year growth 2025-2030 (%)

12.5 Europe - Market size and forecast 2025-2030

Chart on Europe - Market size and forecast 2025-2030 ($ thousand)
Data Table on Europe - Market size and forecast 2025-2030 ($ thousand)
Chart on Europe - Year-over-year growth 2025-2030 (%)
Data Table on Europe - Year-over-year growth 2025-2030 (%)
Chart on Regional Comparison - Europe
Data Table on Regional Comparison - Europe

12.5.1 Germany - Market size and forecast 2025-2030

Chart on Germany - Market size and forecast 2025-2030 ($ thousand)
Data Table on Germany - Market size and forecast 2025-2030 ($ thousand)
Chart on Germany - Year-over-year growth 2025-2030 (%)
Data Table on Germany - Year-over-year growth 2025-2030 (%)

12.5.2 The Netherlands - Market size and forecast 2025-2030

Chart on The Netherlands - Market size and forecast 2025-2030 ($ thousand)
Data Table on The Netherlands - Market size and forecast 2025-2030 ($ thousand)
Chart on The Netherlands - Year-over-year growth 2025-2030 (%)
Data Table on The Netherlands - Year-over-year growth 2025-2030 (%)

12.5.3 UK - Market size and forecast 2025-2030

Chart on UK - Market size and forecast 2025-2030 ($ thousand)
Data Table on UK - Market size and forecast 2025-2030 ($ thousand)
Chart on UK - Year-over-year growth 2025-2030 (%)
Data Table on UK - Year-over-year growth 2025-2030 (%)

12.5.4 France - Market size and forecast 2025-2030

Chart on France - Market size and forecast 2025-2030 ($ thousand)
Data Table on France - Market size and forecast 2025-2030 ($ thousand)
Chart on France - Year-over-year growth 2025-2030 (%)
Data Table on France - Year-over-year growth 2025-2030 (%)

12.5.5 Italy - Market size and forecast 2025-2030

Chart on Italy - Market size and forecast 2025-2030 ($ thousand)
Data Table on Italy - Market size and forecast 2025-2030 ($ thousand)
Chart on Italy - Year-over-year growth 2025-2030 (%)
Data Table on Italy - Year-over-year growth 2025-2030 (%)

12.5.6 Spain - Market size and forecast 2025-2030

Chart on Spain - Market size and forecast 2025-2030 ($ thousand)
Data Table on Spain - Market size and forecast 2025-2030 ($ thousand)
Chart on Spain - Year-over-year growth 2025-2030 (%)
Data Table on Spain - Year-over-year growth 2025-2030 (%)

12.6 Middle East and Africa - Market size and forecast 2025-2030

Chart on Middle East and Africa - Market size and forecast 2025-2030 ($ thousand)
Data Table on Middle East and Africa - Market size and forecast 2025-2030 ($ thousand)
Chart on Middle East and Africa - Year-over-year growth 2025-2030 (%)
Data Table on Middle East and Africa - Year-over-year growth 2025-2030 (%)
Chart on Regional Comparison - Middle East and Africa
Data Table on Regional Comparison - Middle East and Africa

12.6.1 UAE - Market size and forecast 2025-2030

Chart on UAE - Market size and forecast 2025-2030 ($ thousand)
Data Table on UAE - Market size and forecast 2025-2030 ($ thousand)
Chart on UAE - Year-over-year growth 2025-2030 (%)
Data Table on UAE - Year-over-year growth 2025-2030 (%)

12.6.2 Saudi Arabia - Market size and forecast 2025-2030

Chart on Saudi Arabia - Market size and forecast 2025-2030 ($ thousand)
Data Table on Saudi Arabia - Market size and forecast 2025-2030 ($ thousand)
Chart on Saudi Arabia - Year-over-year growth 2025-2030 (%)
Data Table on Saudi Arabia - Year-over-year growth 2025-2030 (%)

12.6.3 South Africa - Market size and forecast 2025-2030

Chart on South Africa - Market size and forecast 2025-2030 ($ thousand)
Data Table on South Africa - Market size and forecast 2025-2030 ($ thousand)
Chart on South Africa - Year-over-year growth 2025-2030 (%)
Data Table on South Africa - Year-over-year growth 2025-2030 (%)

12.6.4 Israel - Market size and forecast 2025-2030

Chart on Israel - Market size and forecast 2025-2030 ($ thousand)
Data Table on Israel - Market size and forecast 2025-2030 ($ thousand)
Chart on Israel - Year-over-year growth 2025-2030 (%)
Data Table on Israel - Year-over-year growth 2025-2030 (%)

12.6.5 Turkey - Market size and forecast 2025-2030

Chart on Turkey - Market size and forecast 2025-2030 ($ thousand)
Data Table on Turkey - Market size and forecast 2025-2030 ($ thousand)
Chart on Turkey - Year-over-year growth 2025-2030 (%)
Data Table on Turkey - Year-over-year growth 2025-2030 (%)

12.7 South America - Market size and forecast 2025-2030

Chart on South America - Market size and forecast 2025-2030 ($ thousand)
Data Table on South America - Market size and forecast 2025-2030 ($ thousand)
Chart on South America - Year-over-year growth 2025-2030 (%)
Data Table on South America - Year-over-year growth 2025-2030 (%)
Chart on Regional Comparison - South America
Data Table on Regional Comparison - South America

12.7.1 Brazil - Market size and forecast 2025-2030

Chart on Brazil - Market size and forecast 2025-2030 ($ thousand)
Data Table on Brazil - Market size and forecast 2025-2030 ($ thousand)
Chart on Brazil - Year-over-year growth 2025-2030 (%)
Data Table on Brazil - Year-over-year growth 2025-2030 (%)

12.7.2 Argentina - Market size and forecast 2025-2030

Chart on Argentina - Market size and forecast 2025-2030 ($ thousand)
Data Table on Argentina - Market size and forecast 2025-2030 ($ thousand)
Chart on Argentina - Year-over-year growth 2025-2030 (%)
Data Table on Argentina - Year-over-year growth 2025-2030 (%)

12.7.3 Colombia - Market size and forecast 2025-2030

Chart on Colombia - Market size and forecast 2025-2030 ($ thousand)
Data Table on Colombia - Market size and forecast 2025-2030 ($ thousand)
Chart on Colombia - Year-over-year growth 2025-2030 (%)
Data Table on Colombia - Year-over-year growth 2025-2030 (%)

12.8 Market opportunity by geography

Market opportunity by geography ($ thousand)
Data Tables on Market opportunity by geography ($ thousand)

13. Drivers, Challenges, and Opportunity

13.1 Market drivers

Increasing need for rapid and cost effective residential construction
Transition toward sustainable building practices and waste reduction
Continuous advancements in robotics and building information modeling integration

13.2 Market challenges

Strict regulatory frameworks and absence of unified construction standards
Substantial initial capital investment and ongoing maintenance expenditures
Limitations regarding structural reinforcement and material behaviors

13.3 Impact of drivers and challenges

Impact of drivers and challenges in 2025 and 2030

13.4 Market opportunities

Expansion into extraterrestrial and extreme environment infrastructure construction
Integration of smart materials and self-healing concrete mixtures
Customization of architectural aesthetics and complex geometries for commercial spaces

14. Competitive Landscape

14.1 Overview

14.2

Overview on criticality of inputs and factors of differentiation

14.3 Landscape disruption

Overview on factors of disruption

14.4 Industry risks

Impact of key risks on business

15. Competitive Analysis

15.1 Companies profiled

Companies covered

15.2 Company ranking index

15.3 Market positioning of companies

Matrix on companies position and classification

15.4 Apis Cor

Apis Cor - Overview
Apis Cor - Product / Service
Apis Cor - Key offerings
SWOT

15.5 Black Buffalo 3D Corporation

Black Buffalo 3D Corporation - Overview
Black Buffalo 3D Corporation - Product / Service
Black Buffalo 3D Corporation - Key offerings
SWOT

15.6 CEMEX SAB de CV

CEMEX SAB de CV - Overview
CEMEX SAB de CV - Product / Service
CEMEX SAB de CV - Key news
CEMEX SAB de CV - Key offerings
SWOT

15.7 COBOD International AS

COBOD International AS - Overview
COBOD International AS - Product / Service
COBOD International AS - Key offerings
SWOT

15.8 CyBe Construction

CyBe Construction - Overview
CyBe Construction - Product / Service
CyBe Construction - Key offerings
SWOT

15.9 Heidelberg Materials AG

Heidelberg Materials AG - Overview
Heidelberg Materials AG - Business segments
Heidelberg Materials AG - Key offerings
Heidelberg Materials AG - Segment focus
SWOT

15.10 ICON Technology Inc.

ICON Technology Inc. - Overview
ICON Technology Inc. - Product / Service
ICON Technology Inc. - Key offerings
SWOT

15.11 Mighty Buildings Inc.

Mighty Buildings Inc. - Overview
Mighty Buildings Inc. - Product / Service
Mighty Buildings Inc. - Key offerings
SWOT

15.12 MudBots

MudBots - Overview
MudBots - Product / Service
MudBots - Key offerings
SWOT

15.13 PERI 3D Construction

PERI 3D Construction - Overview
PERI 3D Construction - Product / Service
PERI 3D Construction - Key offerings
SWOT

15.14 Sika AG

Sika AG - Overview
Sika AG - Business segments
Sika AG - Key news
Sika AG - Key offerings
Sika AG - Segment focus
SWOT

15.15 SQ4D LLC

SQ4D LLC - Overview
SQ4D LLC - Product / Service
SQ4D LLC - Key offerings
SWOT

15.16 Twente Additive Manufacturing.

Twente Additive Manufacturing. - Overview
Twente Additive Manufacturing. - Product / Service
Twente Additive Manufacturing. - Key offerings
SWOT

15.17 WASP

WASP - Overview
WASP - Product / Service
WASP - Key offerings
SWOT

15.18 XtreeE

XtreeE - Overview
XtreeE - Product / Service
XtreeE - Key offerings
SWOT

16. Appendix

16.1 Scope of the report

Market definition
Objectives
Notes and caveats

16.2 Inclusions and exclusions checklist

Inclusions checklist
Exclusions checklist

16.3 Currency conversion rates for US$

16.4 Research methodology

16.5 Data procurement

Information sources

16.6 Data validation

16.7 Validation techniques employed for market sizing

16.8 Data synthesis

16.9 360 degree market analysis

16.10 List of abbreviations

Research Methodology

Technavio presents a detailed picture of the market by way of study, synthesis, and summation of data from multiple sources. The analysts have presented the various facets of the market with a particular focus on identifying the key industry influencers. The data thus presented is comprehensive, reliable, and the result of extensive research, both primary and secondary.

INFORMATION SOURCES

Primary sources

  • Manufacturers and suppliers
  • Channel partners
  • Industry experts
  • Strategic decision makers

Secondary sources

  • Industry journals and periodicals
  • Government data
  • Financial reports of key industry players
  • Historical data
  • Press releases

DATA ANALYSIS

Data Synthesis

  • Collation of data
  • Estimation of key figures
  • Analysis of derived insights

Data Validation

  • Triangulation with data models
  • Reference against proprietary databases
  • Corroboration with industry experts

REPORT WRITING

Qualitative

  • Market drivers
  • Market challenges
  • Market trends
  • Five forces analysis

Quantitative

  • Market size and forecast
  • Market segmentation
  • Geographical insights
  • Competitive landscape

Interested in this report?

Get your sample now to see our research methodology and insights!

Download Now

Frequently Asked Questions

3D Concrete Printing market growth will increase by USD 5961753.3 thousand thousand during 2026-2030.

The 3D Concrete Printing market is expected to grow at a CAGR of 56.7% during 2026-2030.

3D Concrete Printing market is segmented by Type (On-site, Off-site) Application (Residential construction, Commercial construction, Public infrastructure, Industrial construction) Technology (Gantry-based systems, Robotic arm-based systems)

ALQUIST, Apis Cor, Black Buffalo 3D Corporation, CEMEX SAB de CV, COBOD International AS, Constructions-3D, Contour Crafting Corp., CyBe Construction, Heidelberg Materials AG, Holcim Ltd., ICON Technology Inc., Mighty Buildings Inc., MudBots, PERI 3D Construction, Sika AG, SQ4D LLC, Twente Additive Manufacturing., Vertico, WASP, XtreeE are a few of the key vendors in the 3D Concrete Printing market.

APAC will register the highest growth rate of 32.5% among the other regions. Therefore, the 3D Concrete Printing market in APAC is expected to garner significant business opportunities for the vendors during the forecast period.

US, Canada, Mexico, China, India, Japan, South Korea, Australia, Indonesia, Germany, The Netherlands, UK, France, Italy, Spain, UAE, Saudi Arabia, South Africa, Israel, Turkey, Brazil, Argentina, Colombia

  • Increasing need for rapid and cost effective residential construction is the driving factor this market.

The 3D Concrete Printing market vendors should focus on grabbing business opportunities from the Type segment as it accounted for the largest market share in the base year.
RIA - Research AI Assistant
Ask RIA