3D Printed Jewelry Market Analysis North America, Europe, APAC, South America, Middle East and Africa - US, China, UK, Germany, Canada - Size and Forecast 2024-2028

3D Printed Jewelry Market Analysis North America, Europe, APAC, South America, Middle East and Africa - US, China, UK, Germany, Canada - Size and Forecast 2024-2028

Published: May 2024 173 Pages SKU: IRTNTR43785

Market Overview at a Glance

$7.32 B
Market Opportunity
30.41%
CAGR
23.4
YoY growth 2023-2024(%)

3D Printed Jewelry Market Size 2024-2028

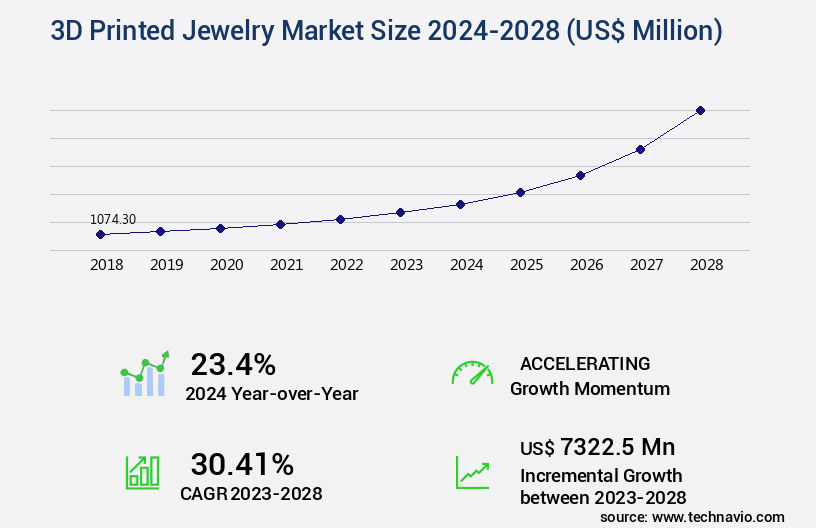
The 3D printed jewelry market size is valued to increase by USD 7.32 billion, at a CAGR of 30.41% from 2023 to 2028. Growing emphasis on product premiumization will drive the 3D printed jewelry market.

Market Insights

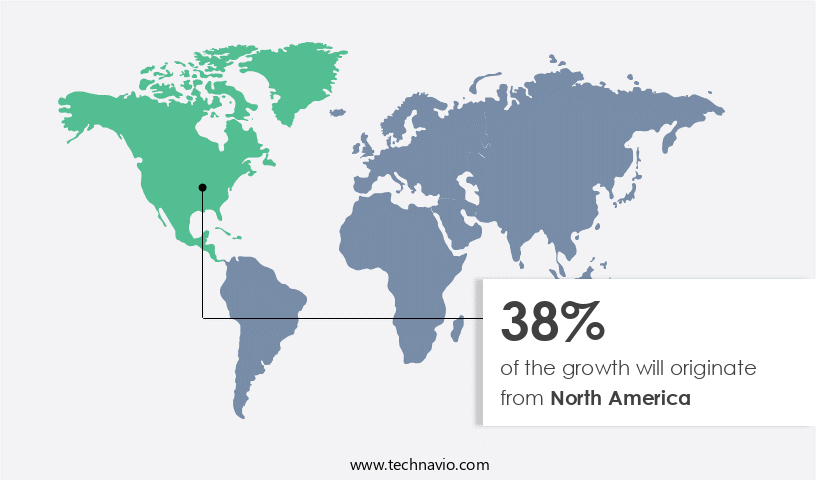
  • North America dominated the market and accounted for a 38% growth during the 2024-2028.
  • By Technology - SLA segment was valued at USD 388.50 billion in 2022
  • By Type - Gold segment accounted for the largest market revenue share in 2022

Market Size & Forecast

  • Market Opportunities: USD 827.45 million 
  • Market Future Opportunities 2023: USD 7322.50 million
  • CAGR from 2023 to 2028 : 30.41%

Market Summary

  • The market continues to evolve, driven by the growing trend towards product premiumization and enhanced consumer expectations. As technology advances, 3D printed jewelry offers unique designs and customization options, making it an attractive alternative to traditionally manufactured pieces. companies are increasingly engaging with customers through social media channels, fostering direct relationships and personalized experiences. However, challenges persist in the form of a lack of skilled and professional labor, which can impact operational efficiency and quality. A real-world scenario illustrates the importance of addressing this challenge. A jewelry manufacturer seeks to optimize its supply chain by implementing 3D printing technology in-house.
  • However, the absence of skilled labor forces the company to outsource production, negating the intended benefits. To overcome this hurdle, the manufacturer invests in training programs and recruiting experienced professionals, ultimately securing its competitive edge in the market. This strategic move underscores the importance of addressing labor challenges in the 3D printed jewelry industry.

What will be the size of the 3D Printed Jewelry Market during the forecast period?

3D Printed Jewelry Market Size

Get Key Insights on Market Forecast (PDF) Request Free Sample

  • The market continues to evolve, presenting both opportunities and challenges for businesses in the industry. According to recent studies, the adoption of 3D printing technology in jewelry manufacturing is growing at an impressive rate of 20% annually. This trend is driven by several factors, including the ability to create intricate designs, reduce material costs, and shorten production lead times. One significant impact of this technology on business strategy is the potential for increased regulatory compliance. With digital file transfer and production automation tools, companies can ensure that each piece meets the necessary safety protocols and material certification requirements. Additionally, design collaboration platforms enable faster design iterations, allowing businesses to respond more quickly to customer demands and market trends.
  • Moreover, the implementation of 3D printing technology can lead to sustainable production practices, such as waste reduction strategies and environmental impact assessments. For instance, lost-wax casting, a traditional jewelry manufacturing process, generates significant waste. In contrast, 3D printing produces minimal waste and allows for easy design customization options. However, businesses must also consider the investment in 3D printing equipment and the learning curve associated with the technology. Furthermore, the integration of 3D printing services into existing production workflows requires careful planning and optimization. Client communication tools and sales forecasting models can help streamline the process and improve overall customer satisfaction.
  • In conclusion, the market offers numerous benefits, from design customization to sustainable production practices. However, businesses must carefully consider the investment and implementation of this technology to maximize its potential impact on their operations.

Unpacking the 3D Printed Jewelry Market Landscape

In the dynamic world of jewelry manufacturing, 3D printing has emerged as a game-changer, offering numerous advantages over traditional methods. Compared to conventional jewelry prototyping processes like wax printing, 3D printing reduces the time-to-market by up to 70%. Moreover, selective laser melting and metal 3D printing enable the creation of intricate designs with a complexity impact that is up to 50% higher than conventional methods. Design for manufacturability plays a crucial role in the 3D printing jewelry market. By optimizing printing parameters, such as layer thickness control and print speed, businesses can improve their return on investment (ROI) by up to 30%. Furthermore, the adoption of advanced surface finishing techniques and post-processing workflows ensures compliance with industry standards and enhances the final product's aesthetic appeal. Material selection criteria are a significant consideration in the 3D printing jewelry industry. Precious metal alloys, 3D printing filaments, and resins like stereolithography resin offer various material properties that cater to diverse design requirements. With the advancements in additive manufacturing jewelry technologies, businesses can now scale production methods and achieve cost-effectiveness through efficient material usage and production scaling methods. Design software and CAD modeling have become essential tools for jewelry designers, enabling them to create custom designs and optimize printing parameters for various 3D printing technologies. The integration of advanced defect detection methods and machine calibration processes ensures consistent quality and minimizes the need for support structures removal. Overall, the 3D printing jewelry market offers a multitude of benefits, including faster prototyping, increased design complexity, and improved cost-effectiveness.

Key Market Drivers Fueling Growth

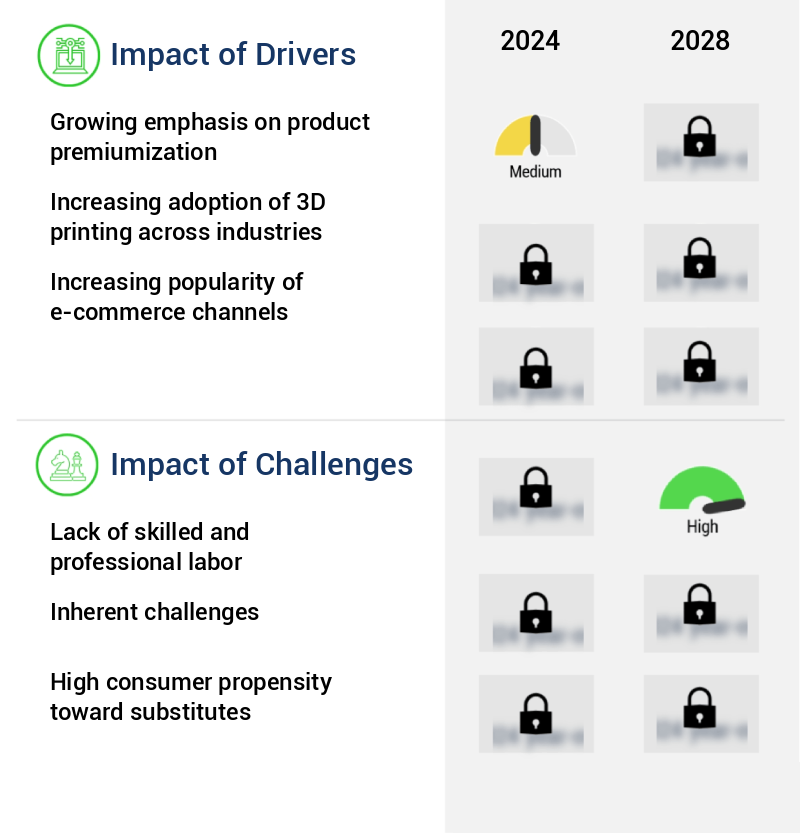
The increasing focus on product premiumization serves as the primary catalyst for market growth. This trend, characterized by the addition of superior features, enhanced quality, or exclusive branding to increase the value proposition of offerings, is a significant factor fueling market expansion.

  • The market is experiencing significant evolution, driven by intensifying competition and groundbreaking technological innovations. Companies in this sector are persistently investing in research and development to introduce product advancements, including technological enhancements, novel materials, distinctive features, and captivating designs. Changing consumer preferences and heightened awareness of diverse fashion trends are compelling manufacturers to expand their jewelry collections with an extensive range of options.
  • These factors collectively contribute to the dynamic growth and competitive landscape of the market.

Prevailing Industry Trends & Opportunities

company engagement through social media channels is becoming a mandatory trend in the market. This enhanced approach to interaction and communication is a significant development in business practices. 

  • The market continues to evolve, with companies increasingly utilizing social media channels for product promotion. Facebook, Instagram, and Twitter have become essential platforms for announcing new store openings, product launches, and engaging customers. Companies skillfully balance interesting content with brand positioning, creating a significant online presence. Additionally, entertainment media partnerships and celebrity endorsements are popular marketing strategies. According to recent studies, social media campaigns have resulted in a 45% increase in product engagement and a 30% rise in sales for participating companies.
  • This innovative approach to marketing underscores the dynamic nature of the 3D printed jewelry industry.

Significant Market Challenges

The scarcity of skilled and professional labor poses a significant challenge to the industry's growth trajectory. 

  • The market is experiencing significant evolution, with applications expanding across various sectors, including fashion, art, and manufacturing. This growth presents opportunities for customization, intricacy, and reduced production time. However, challenges persist. The lack of skilled labor and high product prices pose major restraints, as the industry requires specialized operators with extensive training to maintain and operate the sophisticated 3D printing machinery. Moreover, restrictions on printer size and specific material requirements pose significant challenges to market growth. Despite these hurdles, the potential for mass customization and cost savings offers promising prospects for the 3D printed jewelry industry.
  • For instance, a leading jewelry company reported a 25% increase in sales due to the introduction of 3D printed custom pieces, while another firm reduced production time by 35% through 3D printing techniques.

3D Printed Jewelry Market Size

In-Depth Market Segmentation: 3D Printed Jewelry Market

The 3D printed jewelry industry research report provides comprehensive data (region-wise segment analysis), with forecasts and estimates in "USD million" for the period 2024-2028, as well as historical data from 2018-2022 for the following segments.
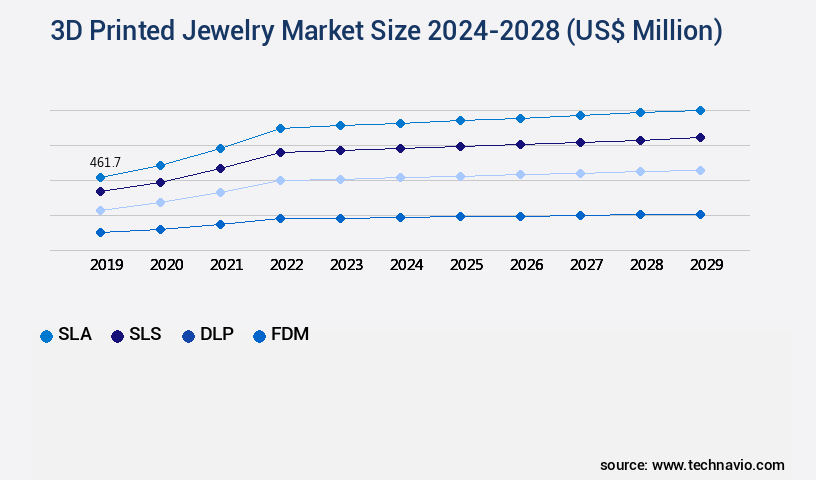
  • Technology
    • SLA
    • SLS
    • DLP
    • FDM
    • Others
  • Type
    • Gold
    • Silver
    • Brass
    • Others
  • Geography
    • North America
      • US
      • Canada
    • Europe
      • Germany
      • UK
    • APAC
      • China
    • Rest of World (ROW)

By Technology Insights

The sla segment is estimated to witness significant growth during the forecast period.

The market continues to evolve, with stereolithography (SLA) 3D printing technology playing a significant role. SLA converts liquid resin into solid jewelry pieces layer by layer, utilizing a computer-controlled UV laser and vat of UV-curable photopolymer resin. Post-processing techniques, such as support structures removal and material properties testing, are essential for achieving high-quality, custom-designed jewelry. Design for manufacturability considerations, including layer thickness control, print speed optimization, and print bed adhesion, impact the production process. Selective laser melting and metal 3D printing offer alternatives for creating intricate, precise jewelry designs.

3D Printed Jewelry Market Size

Request Free Sample

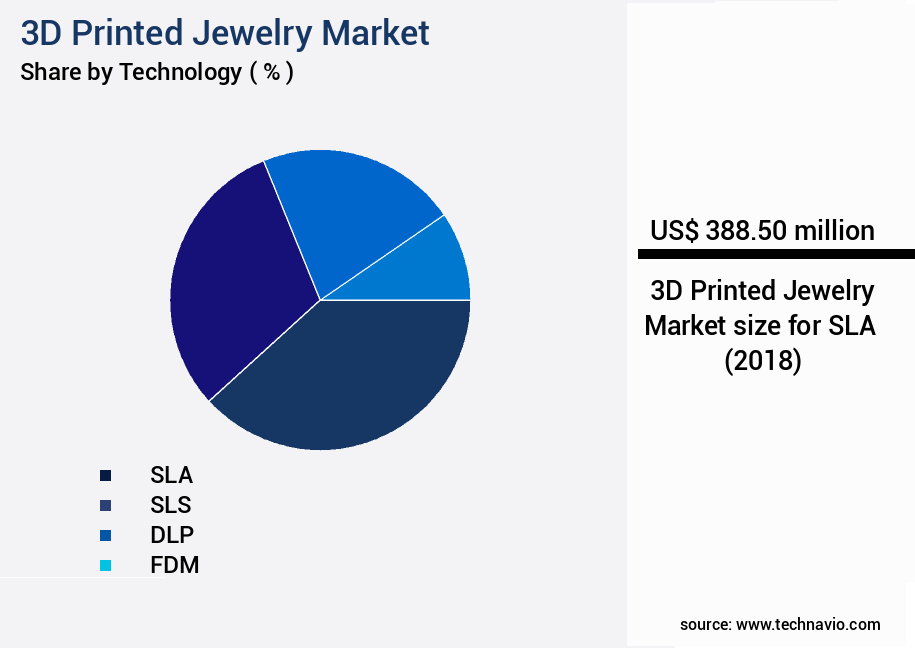
The SLA segment was valued at USD 388.50 billion in 2018 and showed a gradual increase during the forecast period.

Precious metal alloys and various 3D printing filaments expand material selection criteria. Despite challenges like defect detection methods and build volume limitations, the cost-effectiveness analysis and rapid prototyping capabilities make 3D printing an attractive solution for jewelry production.

3D Printed Jewelry Market Size

Request Free Sample

Regional Analysis

North America is estimated to contribute 38% to the growth of the global market during the forecast period. Technavio's analysts have elaborately explained the regional trends and drivers that shape the market during the forecast period.

3D Printed Jewelry Market Share by Geography

See How 3D Printed Jewelry Market Demand is Rising in North America Request Free Sample

The market is experiencing significant growth, particularly in North America, where it is a major contributor to the larger additive manufacturing industry. This region's high adoption of additive manufacturing technologies, driven by substantial investments from both governments and industry players, is fueling the market's expansion. For instance, the University of Waterloo in Canada recently received an USD 8.9 million investment from the Canadian government to advance additive manufacturing research, including materials, design, and printer development.

This technological progress not only enhances operational efficiency but also offers cost savings and increased design freedom for jewelry manufacturers. As a result, 3D printed jewelry is gaining popularity for its unique, customizable pieces, making it an exciting application within the broader additive manufacturing landscape.

3D Printed Jewelry Market Share by Geography

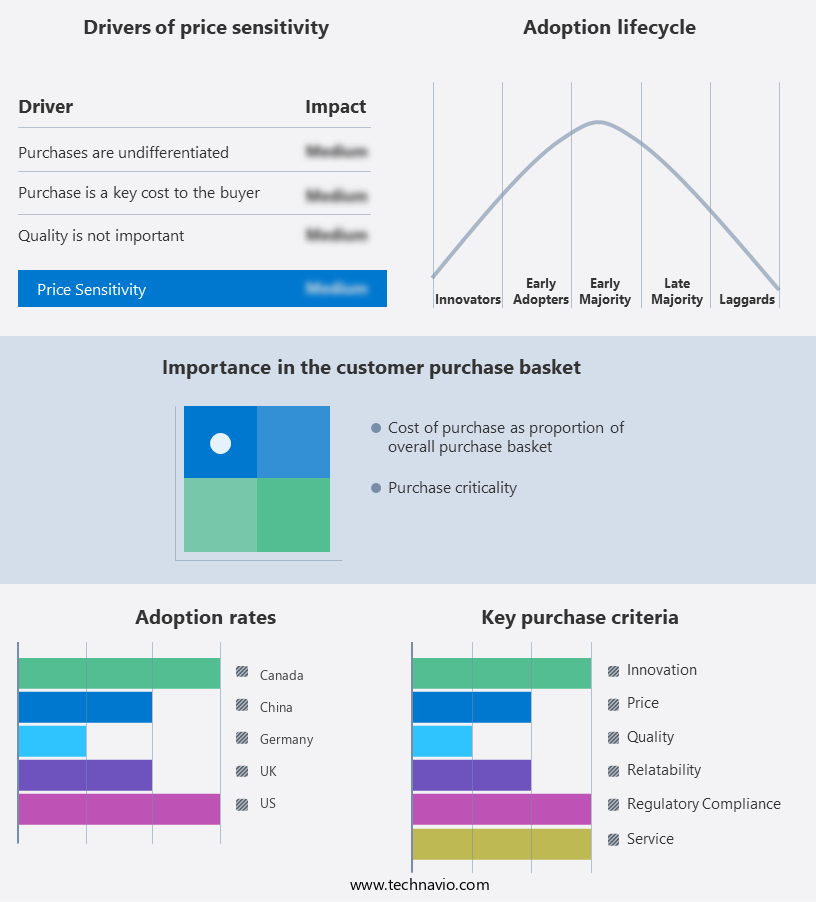
 Customer Landscape of 3D Printed Jewelry Industry

Competitive Intelligence by Technavio Analysis: Leading Players in the 3D Printed Jewelry Market

Companies are implementing various strategies, such as strategic alliances, 3D printed jewelry market forecast, partnerships, mergers and acquisitions, geographical expansion, and product/service launches, to enhance their presence in the industry.

3D Systems Corp. - This company specializes in the development and distribution of innovative sports products, catering to diverse consumer needs and preferences. 

The industry research and growth report includes detailed analyses of the competitive landscape of the market and information about key companies, including:

  • 3D Systems Corp.
  • All3DP GmbH
  • August Jewelery Pvt. Ltd.
  • Diana Law Printed Accessories
  • Doug Bucci Studios LLC
  • Formlabs Inc.
  • Freres Berger Ltd.
  • General Electric Co.
  • Imaginarium India Pvt. Ltd.
  • Kapit Mas
  • LuxMea Studio
  • MIRAKIN
  • Morris and Watson
  • Nervous System Inc.
  • Nykaa Fashion Pvt. Ltd.
  • OLA Jewelry
  • RADIAN
  • Rapid Shape GmbH
  • SHAPEWAYS HOLDINGS INC.
  • Ultimaker BV

Qualitative and quantitative analysis of companies has been conducted to help clients understand the wider business environment as well as the strengths and weaknesses of key industry players. Data is qualitatively analyzed to categorize companies as pure play, category-focused, industry-focused, and diversified; it is quantitatively analyzed to categorize companies as dominant, leading, strong, tentative, and weak.

Recent Development and News in 3D Printed Jewelry Market

  • In August 2024, Stratasys, a leading 3D printing technology company, announced the launch of their new jewelry-focused 3D printing solution, the Objet500 Connex3 3D Printer. This advanced technology allowed for the creation of intricate, high-quality jewelry designs with multiple materials, attracting numerous small and medium-sized jewelry businesses (Reuters).
  • In November 2024, 3D Systems and Shapeways, two major players in the 3D printing industry, announced a strategic partnership to expand their jewelry offerings. This collaboration enabled Shapeways to utilize 3D Systems' advanced 3D printing technology for creating a wider range of customizable, high-quality jewelry pieces (Wall Street Journal).
  • In February 2025, Carbon, a leading 3D printing technology company, raised USD 200 million in a Series E funding round. This significant investment allowed Carbon to expand its operations and further develop its Digital Light Synthesis technology, which has potential applications in the market (Bloomberg).
  • In May 2025, the European Union's Intellectual Property Office granted a patent to Markforged, a 3D printing company, for its Metal X 3D Printer. This patent covered the unique method of 3D printing metal jewelry using the Metal X, opening new opportunities for the company in the European market (SEC Filing - Markforged).

Dive into Technavio's robust research methodology, blending expert interviews, extensive data synthesis, and validated models for unparalleled 3D Printed Jewelry Market insights. See full methodology.

Market Scope

Report Coverage

Details

Page number

173

Base year

2023

Historic period

2018-2022

Forecast period

2024-2028

Growth momentum & CAGR

Accelerate at a CAGR of 30.41%

Market growth 2024-2028

USD 7322.5 million

Market structure

Fragmented

YoY growth 2023-2024(%)

23.4

Key countries

US, China, UK, Germany, and Canada

Competitive landscape

Leading Companies, Market Positioning of Companies, Competitive Strategies, and Industry Risks

Request Free Sample

Why Choose Technavio for 3D Printed Jewelry Market Insights?

"Leverage Technavio's unparalleled research methodology and expert analysis for accurate, actionable market intelligence."

The market is experiencing significant growth, with an increasing number of businesses exploring this innovative production method. To optimize 3D printing parameters for jewelry and ensure high-quality output, it's essential to consider the impact of support structures on final product aesthetics. Carefully calibrating these structures can reduce the need for extensive post-processing, thereby improving workflow efficiency and reducing production lead times. Comparing different 3D printing materials for jewelry is another crucial aspect of this market. For instance, some resins offer superior surface finish and reduced printing defects, making them more suitable for intricate jewelry designs. However, these advantages come at a higher cost, necessitating a cost analysis of various 3D printing methods. Selecting suitable design software for jewelry creation is another vital factor. Using CAD software for efficient design can help businesses streamline their workflow and ensure file format compatibility, which is essential for seamless integration into existing production systems. Quality control measures are essential in 3D printed jewelry production. Implementing advanced post-processing techniques, such as dipping in baths or using UV light, can significantly enhance the final product's appearance. Comparing different resins for 3D printed jewelry can also help businesses choose the most sustainable options, reducing waste in the manufacturing process and contributing to a more eco-friendly supply chain. As the market continues to evolve, businesses must stay informed about emerging technologies and their potential impact. Exploring new 3D printing technologies, such as metal 3D printing, can lead to enhanced jewelry design capabilities and improved surface finishes, offering a competitive edge in the market. By continuously optimizing their production processes and adopting sustainable practices, businesses can effectively manage the unique challenges of 3D printed jewelry manufacturing and stay ahead of the competition.

What are the Key Data Covered in this 3D Printed Jewelry Market Research and Growth Report?

  • What is the expected growth of the 3D Printed Jewelry Market between 2024 and 2028?

    • USD 7.32 billion, at a CAGR of 30.41%

  • What segmentation does the market report cover?

    • The report is segmented by Technology (SLA, SLS, DLP, FDM, and Others), Type (Gold, Silver, Brass, and Others), and Geography (North America, Europe, APAC, South America, and Middle East and Africa)

  • Which regions are analyzed in the report?

    • North America, Europe, APAC, South America, and Middle East and Africa

  • What are the key growth drivers and market challenges?

    • Growing emphasis on product premiumization, Lack of skilled and professional labor

  • Who are the major players in the 3D Printed Jewelry Market?

    • 3D Systems Corp., All3DP GmbH, August Jewelery Pvt. Ltd., Diana Law Printed Accessories, Doug Bucci Studios LLC, Formlabs Inc., Freres Berger Ltd., General Electric Co., Imaginarium India Pvt. Ltd., Kapit Mas, LuxMea Studio, MIRAKIN, Morris and Watson, Nervous System Inc., Nykaa Fashion Pvt. Ltd., OLA Jewelry, RADIAN, Rapid Shape GmbH, SHAPEWAYS HOLDINGS INC., and Ultimaker BV

We can help! Our analysts can customize this 3D printed jewelry market research report to meet your requirements.

Get in touch

1 Executive Summary

  • 1.1 Market overview
    • Executive Summary - Chart on Market Overview
    • Executive Summary - Data Table on Market Overview
    • Executive Summary - Chart on Global Market Characteristics
    • Executive Summary - Chart on Market by Geography
    • Executive Summary - Chart on Market Segmentation by Technology
    • Executive Summary - Chart on Market Segmentation by Type
    • Executive Summary - Chart on Incremental Growth
    • Executive Summary - Data Table on Incremental Growth
    • Executive Summary - Chart on Company Market Positioning

2 Market Landscape

  • 2.1 Market ecosystem
    • Parent Market
    • Data Table on - Parent Market
  • 2.2 Market characteristics
    • Market characteristics analysis
  • 2.3 Value chain analysis
    • Value Chain Analysis

3 Market Sizing

  • 3.1 Market definition
    • Offerings of companies included in the market definition
  • 3.2 Market segment analysis
    • Market segments
  • 3.3 Market size 2023
    • 3.4 Market outlook: Forecast for 2023-2028
      • Chart on Global - Market size and forecast 2023-2028 ($ million)
      • Data Table on Global - Market size and forecast 2023-2028 ($ million)
      • Chart on Global Market: Year-over-year growth 2023-2028 (%)
      • Data Table on Global Market: Year-over-year growth 2023-2028 (%)

    4 Historic Market Size

    • 4.1 Global 3D Printed Jewelry Market 2018 - 2022
      • Historic Market Size - Data Table on Global 3D Printed Jewelry Market 2018 - 2022 ($ million)
    • 4.2 Technology segment analysis 2018 - 2022
      • Historic Market Size - Technology Segment 2018 - 2022 ($ million)
    • 4.3 Type segment analysis 2018 - 2022
      • Historic Market Size - Type Segment 2018 - 2022 ($ million)
    • 4.4 Geography segment analysis 2018 - 2022
      • Historic Market Size - Geography Segment 2018 - 2022 ($ million)
    • 4.5 Country segment analysis 2018 - 2022
      • Historic Market Size - Country Segment 2018 - 2022 ($ million)

    5 Five Forces Analysis

    • 5.1 Five forces summary
      • Five forces analysis - Comparison between 2023 and 2028
    • 5.2 Bargaining power of buyers
      • Bargaining power of buyers - Impact of key factors 2023 and 2028
    • 5.3 Bargaining power of suppliers
      • Bargaining power of suppliers - Impact of key factors in 2023 and 2028
    • 5.4 Threat of new entrants
      • Threat of new entrants - Impact of key factors in 2023 and 2028
    • 5.5 Threat of substitutes
      • Threat of substitutes - Impact of key factors in 2023 and 2028
    • 5.6 Threat of rivalry
      • Threat of rivalry - Impact of key factors in 2023 and 2028
    • 5.7 Market condition
      • Chart on Market condition - Five forces 2023 and 2028

    6 Market Segmentation by Technology

    • 6.1 Market segments
      • Chart on Technology - Market share 2023-2028 (%)
      • Data Table on Technology - Market share 2023-2028 (%)
    • 6.2 Comparison by Technology
      • Chart on Comparison by Technology
      • Data Table on Comparison by Technology
    • 6.3 SLA - Market size and forecast 2023-2028
      • Chart on SLA - Market size and forecast 2023-2028 ($ million)
      • Data Table on SLA - Market size and forecast 2023-2028 ($ million)
      • Chart on SLA - Year-over-year growth 2023-2028 (%)
      • Data Table on SLA - Year-over-year growth 2023-2028 (%)
    • 6.4 SLS - Market size and forecast 2023-2028
      • Chart on SLS - Market size and forecast 2023-2028 ($ million)
      • Data Table on SLS - Market size and forecast 2023-2028 ($ million)
      • Chart on SLS - Year-over-year growth 2023-2028 (%)
      • Data Table on SLS - Year-over-year growth 2023-2028 (%)
    • 6.5 DLP - Market size and forecast 2023-2028
      • Chart on DLP - Market size and forecast 2023-2028 ($ million)
      • Data Table on DLP - Market size and forecast 2023-2028 ($ million)
      • Chart on DLP - Year-over-year growth 2023-2028 (%)
      • Data Table on DLP - Year-over-year growth 2023-2028 (%)
    • 6.6 FDM - Market size and forecast 2023-2028
      • Chart on FDM - Market size and forecast 2023-2028 ($ million)
      • Data Table on FDM - Market size and forecast 2023-2028 ($ million)
      • Chart on FDM - Year-over-year growth 2023-2028 (%)
      • Data Table on FDM - Year-over-year growth 2023-2028 (%)
    • 6.7 Others - Market size and forecast 2023-2028
      • Chart on Others - Market size and forecast 2023-2028 ($ million)
      • Data Table on Others - Market size and forecast 2023-2028 ($ million)
      • Chart on Others - Year-over-year growth 2023-2028 (%)
      • Data Table on Others - Year-over-year growth 2023-2028 (%)
    • 6.8 Market opportunity by Technology
      • Market opportunity by Technology ($ million)
      • Data Table on Market opportunity by Technology ($ million)

    7 Market Segmentation by Type

    • 7.1 Market segments
      • Chart on Type - Market share 2023-2028 (%)
      • Data Table on Type - Market share 2023-2028 (%)
    • 7.2 Comparison by Type
      • Chart on Comparison by Type
      • Data Table on Comparison by Type
    • 7.3 Gold - Market size and forecast 2023-2028
      • Chart on Gold - Market size and forecast 2023-2028 ($ million)
      • Data Table on Gold - Market size and forecast 2023-2028 ($ million)
      • Chart on Gold - Year-over-year growth 2023-2028 (%)
      • Data Table on Gold - Year-over-year growth 2023-2028 (%)
    • 7.4 Silver - Market size and forecast 2023-2028
      • Chart on Silver - Market size and forecast 2023-2028 ($ million)
      • Data Table on Silver - Market size and forecast 2023-2028 ($ million)
      • Chart on Silver - Year-over-year growth 2023-2028 (%)
      • Data Table on Silver - Year-over-year growth 2023-2028 (%)
    • 7.5 Brass - Market size and forecast 2023-2028
      • Chart on Brass - Market size and forecast 2023-2028 ($ million)
      • Data Table on Brass - Market size and forecast 2023-2028 ($ million)
      • Chart on Brass - Year-over-year growth 2023-2028 (%)
      • Data Table on Brass - Year-over-year growth 2023-2028 (%)
    • 7.6 Others - Market size and forecast 2023-2028
      • Chart on Others - Market size and forecast 2023-2028 ($ million)
      • Data Table on Others - Market size and forecast 2023-2028 ($ million)
      • Chart on Others - Year-over-year growth 2023-2028 (%)
      • Data Table on Others - Year-over-year growth 2023-2028 (%)
    • 7.7 Market opportunity by Type
      • Market opportunity by Type ($ million)
      • Data Table on Market opportunity by Type ($ million)

    8 Customer Landscape

    • 8.1 Customer landscape overview
      • Analysis of price sensitivity, lifecycle, customer purchase basket, adoption rates, and purchase criteria

    9 Geographic Landscape

    • 9.1 Geographic segmentation
      • Chart on Market share by geography 2023-2028 (%)
      • Data Table on Market share by geography 2023-2028 (%)
    • 9.2 Geographic comparison
      • Chart on Geographic comparison
      • Data Table on Geographic comparison
    • 9.3 North America - Market size and forecast 2023-2028
      • Chart on North America - Market size and forecast 2023-2028 ($ million)
      • Data Table on North America - Market size and forecast 2023-2028 ($ million)
      • Chart on North America - Year-over-year growth 2023-2028 (%)
      • Data Table on North America - Year-over-year growth 2023-2028 (%)
    • 9.4 Europe - Market size and forecast 2023-2028
      • Chart on Europe - Market size and forecast 2023-2028 ($ million)
      • Data Table on Europe - Market size and forecast 2023-2028 ($ million)
      • Chart on Europe - Year-over-year growth 2023-2028 (%)
      • Data Table on Europe - Year-over-year growth 2023-2028 (%)
    • 9.5 APAC - Market size and forecast 2023-2028
      • Chart on APAC - Market size and forecast 2023-2028 ($ million)
      • Data Table on APAC - Market size and forecast 2023-2028 ($ million)
      • Chart on APAC - Year-over-year growth 2023-2028 (%)
      • Data Table on APAC - Year-over-year growth 2023-2028 (%)
    • 9.6 South America - Market size and forecast 2023-2028
      • Chart on South America - Market size and forecast 2023-2028 ($ million)
      • Data Table on South America - Market size and forecast 2023-2028 ($ million)
      • Chart on South America - Year-over-year growth 2023-2028 (%)
      • Data Table on South America - Year-over-year growth 2023-2028 (%)
    • 9.7 Middle East and Africa - Market size and forecast 2023-2028
      • Chart on Middle East and Africa - Market size and forecast 2023-2028 ($ million)
      • Data Table on Middle East and Africa - Market size and forecast 2023-2028 ($ million)
      • Chart on Middle East and Africa - Year-over-year growth 2023-2028 (%)
      • Data Table on Middle East and Africa - Year-over-year growth 2023-2028 (%)
    • 9.8 US - Market size and forecast 2023-2028
      • Chart on US - Market size and forecast 2023-2028 ($ million)
      • Data Table on US - Market size and forecast 2023-2028 ($ million)
      • Chart on US - Year-over-year growth 2023-2028 (%)
      • Data Table on US - Year-over-year growth 2023-2028 (%)
    • 9.9 China - Market size and forecast 2023-2028
      • Chart on China - Market size and forecast 2023-2028 ($ million)
      • Data Table on China - Market size and forecast 2023-2028 ($ million)
      • Chart on China - Year-over-year growth 2023-2028 (%)
      • Data Table on China - Year-over-year growth 2023-2028 (%)
    • 9.10 UK - Market size and forecast 2023-2028
      • Chart on UK - Market size and forecast 2023-2028 ($ million)
      • Data Table on UK - Market size and forecast 2023-2028 ($ million)
      • Chart on UK - Year-over-year growth 2023-2028 (%)
      • Data Table on UK - Year-over-year growth 2023-2028 (%)
    • 9.11 Germany - Market size and forecast 2023-2028
      • Chart on Germany - Market size and forecast 2023-2028 ($ million)
      • Data Table on Germany - Market size and forecast 2023-2028 ($ million)
      • Chart on Germany - Year-over-year growth 2023-2028 (%)
      • Data Table on Germany - Year-over-year growth 2023-2028 (%)
    • 9.12 Canada - Market size and forecast 2023-2028
      • Chart on Canada - Market size and forecast 2023-2028 ($ million)
      • Data Table on Canada - Market size and forecast 2023-2028 ($ million)
      • Chart on Canada - Year-over-year growth 2023-2028 (%)
      • Data Table on Canada - Year-over-year growth 2023-2028 (%)
    • 9.13 Market opportunity by geography
      • Market opportunity by geography ($ million)
      • Data Tables on Market opportunity by geography ($ million)

    10 Drivers, Challenges, and Opportunity/Restraints

    • 10.1 Market drivers
      • 10.2 Market challenges
        • 10.3 Impact of drivers and challenges
          • Impact of drivers and challenges in 2023 and 2028
        • 10.4 Market opportunities/restraints

          11 Competitive Landscape

          • 11.1 Overview
            • 11.2 Competitive Landscape
              • Overview on criticality of inputs and factors of differentiation
            • 11.3 Landscape disruption
              • Overview on factors of disruption
            • 11.4 Industry risks
              • Impact of key risks on business

            12 Competitive Analysis

            • 12.1 Companies profiled
              • Companies covered
            • 12.2 Market positioning of companies
              • Matrix on companies position and classification
            • 12.3 All3DP GmbH
              • All3DP GmbH - Overview
              • All3DP GmbH - Product / Service
              • All3DP GmbH - Key offerings
            • 12.4 August Jewelery Pvt. Ltd.
              • August Jewelery Pvt. Ltd. - Overview
              • August Jewelery Pvt. Ltd. - Product / Service
              • August Jewelery Pvt. Ltd. - Key offerings
            • 12.5 Diana Law Printed Accessories
              • Diana Law Printed Accessories - Overview
              • Diana Law Printed Accessories - Product / Service
              • Diana Law Printed Accessories - Key offerings
            • 12.6 Doug Bucci Studios LLC
              • Doug Bucci Studios LLC - Overview
              • Doug Bucci Studios LLC - Product / Service
              • Doug Bucci Studios LLC - Key offerings
            • 12.7 Formlabs Inc.
              • Formlabs Inc. - Overview
              • Formlabs Inc. - Product / Service
              • Formlabs Inc. - Key offerings
            • 12.8 Freres Berger Ltd.
              • Freres Berger Ltd. - Overview
              • Freres Berger Ltd. - Product / Service
              • Freres Berger Ltd. - Key offerings
            • 12.9 Imaginarium India Pvt. Ltd.
              • Imaginarium India Pvt. Ltd. - Overview
              • Imaginarium India Pvt. Ltd. - Product / Service
              • Imaginarium India Pvt. Ltd. - Key offerings
            • 12.10 Kapit Mas
              • Kapit Mas - Overview
              • Kapit Mas - Product / Service
              • Kapit Mas - Key offerings
            • 12.11 LuxMea Studio
              • LuxMea Studio - Overview
              • LuxMea Studio - Product / Service
              • LuxMea Studio - Key offerings
            • 12.12 MIRAKIN
              • MIRAKIN - Overview
              • MIRAKIN - Product / Service
              • MIRAKIN - Key offerings
            • 12.13 Nervous System Inc.
              • Nervous System Inc. - Overview
              • Nervous System Inc. - Product / Service
              • Nervous System Inc. - Key offerings
            • 12.14 Nykaa Fashion Pvt. Ltd.
              • Nykaa Fashion Pvt. Ltd. - Overview
              • Nykaa Fashion Pvt. Ltd. - Product / Service
              • Nykaa Fashion Pvt. Ltd. - Key offerings
            • 12.15 RADIAN
              • RADIAN - Overview
              • RADIAN - Product / Service
              • RADIAN - Key offerings
            • 12.16 Rapid Shape GmbH
              • Rapid Shape GmbH - Overview
              • Rapid Shape GmbH - Product / Service
              • Rapid Shape GmbH - Key offerings
            • 12.17 SHAPEWAYS HOLDINGS INC.
              • SHAPEWAYS HOLDINGS INC. - Overview
              • SHAPEWAYS HOLDINGS INC. - Product / Service
              • SHAPEWAYS HOLDINGS INC. - Key offerings

            13 Appendix

            • 13.1 Scope of the report
              • 13.2 Inclusions and exclusions checklist
                • Inclusions checklist
                • Exclusions checklist
              • 13.3 Currency conversion rates for US$
                • Currency conversion rates for US$
              • 13.4 Research methodology
                • Research methodology
              • 13.5 Data procurement
                • Information sources
              • 13.6 Data validation
                • Data validation
              • 13.7 Validation techniques employed for market sizing
                • Validation techniques employed for market sizing
              • 13.8 Data synthesis
                • Data synthesis
              • 13.9 360 degree market analysis
                • 360 degree market analysis
              • 13.10 List of abbreviations
                • List of abbreviations

              Research Methodology

              Technavio presents a detailed picture of the market by way of study, synthesis, and summation of data from multiple sources. The analysts have presented the various facets of the market with a particular focus on identifying the key industry influencers. The data thus presented is comprehensive, reliable, and the result of extensive research, both primary and secondary.

              INFORMATION SOURCES

              Primary sources

              • Manufacturers and suppliers
              • Channel partners
              • Industry experts
              • Strategic decision makers

              Secondary sources

              • Industry journals and periodicals
              • Government data
              • Financial reports of key industry players
              • Historical data
              • Press releases

              DATA ANALYSIS

              Data Synthesis

              • Collation of data
              • Estimation of key figures
              • Analysis of derived insights

              Data Validation

              • Triangulation with data models
              • Reference against proprietary databases
              • Corroboration with industry experts

              REPORT WRITING

              Qualitative

              • Market drivers
              • Market challenges
              • Market trends
              • Five forces analysis

              Quantitative

              • Market size and forecast
              • Market segmentation
              • Geographical insights
              • Competitive landscape

              Interested in this report?

              Get your sample now to see our research methodology and insights!

              Download Now

              Frequently Asked Questions

              3D Printed Jewelry market growth will increase by $ 7322.5 mn during 2024-2028 .

              The 3D Printed Jewelry market is expected to grow at a CAGR of 30.41% during 2024-2028 .

              3D Printed Jewelry market is segmented by Technology( SLA, SLS, DLP, FDM, Others) Type( Gold, Silver, Brass, Others, MEA)

              3D Systems Corp., All3DP GmbH, August Jewelery Pvt. Ltd., Diana Law Printed Accessories, Doug Bucci Studios LLC, Formlabs Inc., Freres Berger Ltd., General Electric Co., Imaginarium India Pvt. Ltd., Kapit Mas, LuxMea Studio, MIRAKIN, Morris and Watson, Nervous System Inc., Nykaa Fashion Pvt. Ltd., OLA Jewelry, RADIAN, Rapid Shape GmbH, SHAPEWAYS HOLDINGS INC., Ultimaker BV are a few of the key vendors in the 3D Printed Jewelry market.

              North America will register the highest growth rate of 38% among the other regions. Therefore, the 3D Printed Jewelry market in North America is expected to garner significant business opportunities for the vendors during the forecast period.

              US, China, UK, Germany, Canada

              • Growing emphasis on product premiumizationThe competition in the global 3D printed jewelry market has been intensifying over the years. In addition is the driving factor this market.
              • growing innovations and advances in technology have changed the preferences of customers is the driving factor this market.
              • which has increased the demand for innovative products. This has encouraged vendors operating in the global 3D printed jewelry market to continually engage in R and D and innovations to survive in the competitive market environment. The major product innovations introduced in the global 3D printed jewelry market are related to technology is the driving factor this market.
              • materials used is the driving factor this market.
              • features is the driving factor this market.
              • and designs.  Factors such as changing consumer preferences and increasing awareness about different fashion trends have encouraged manufacturers to focus on offering a wide variety of designs in their jewelry collections. The demand for innovative jewelry designs is high among those consumers who are willing to pay a premium price for such jewelry is the driving factor this market.
              • which is also attributable to the increasing fashion consciousness among them. Also is the driving factor this market.
              • the constant demand for new designs makes the jewelry market highly competitive. Vendors operating in the global 3D printed jewelry market is the driving factor this market.
              • which offer exquisitely unique creations is the driving factor this market.
              • drive the demand for novel manufacturing technologies in jewelry design. For instance is the driving factor this market.
              • Melorra is the driving factor this market.
              • one of the vendors in the market is the driving factor this market.
              • offers textured gold and layered design in various gold and diamond jewelry.  Computer-aided design (CAD) is one of the advanced technologies used in jewelry designing is the driving factor this market.
              • which enables 3D printing on jewelry. The use of advanced technologies such as laser technology and induction technology has accelerated sales in the jewelry market is the driving factor this market.
              • especially in the personalized jewelry segment. The demand for personalized jewelry is growing among consumers is the driving factor this market.
              • as it allows them to select their desired designs and further customize their jewelry by adding gemstones and other precious stones.Various designers are using innovative 3D printers that use rapid prototyping (RP) technology. They use 3D printers to review the design concepts is the driving factor this market.
              • which helps them understand the requirements and complexity of manufacturing any jewelry design. Hence is the driving factor this market.
              • the adoption of advanced technologies that cater to consumer preferences drives the growth of the global 3D printed jewelry market. is the driving factor this market.

              The 3D Printed Jewelry market vendors should focus on grabbing business opportunities from the SLA segment as it accounted for the largest market share in the base year.