3D Printing Metal Materials Market Analysis North America, Europe, APAC, South America, Middle East and Africa - US, China, Germany, UK, France - Size and Forecast 2024-2028

3D Printing Metal Materials Market Analysis North America, Europe, APAC, South America, Middle East and Africa - US, China, Germany, UK, France - Size and Forecast 2024-2028

Published: Mar 2024 190 Pages SKU: IRTNTR40060

Market Overview at a Glance

$1.77 B
Market Opportunity
26.59%
CAGR
24.71
YoY growth 2023-2024(%)

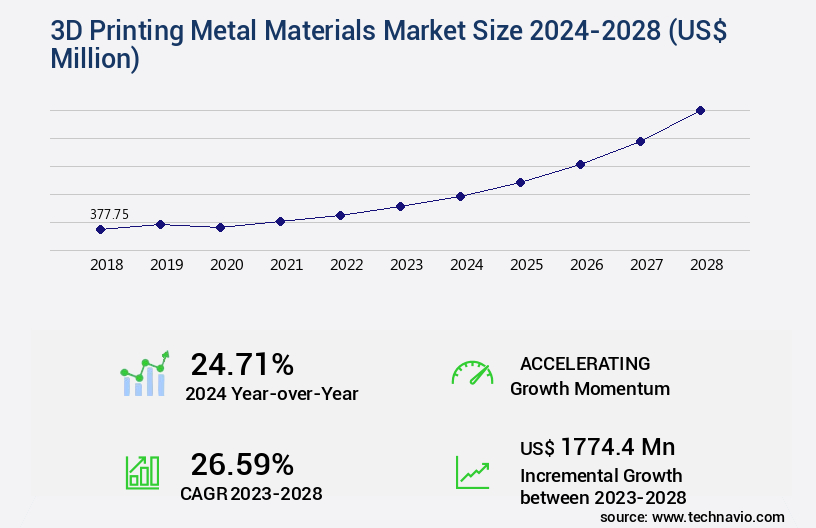
3D Printing Metal Materials Market Size 2024-2028

The 3d printing metal materials market size is valued to increase by USD 1.77 billion, at a CAGR of 26.59% from 2023 to 2028. Rising demand for 3D printing in aerospace sector will drive the 3d printing metal materials market.

Market Insights

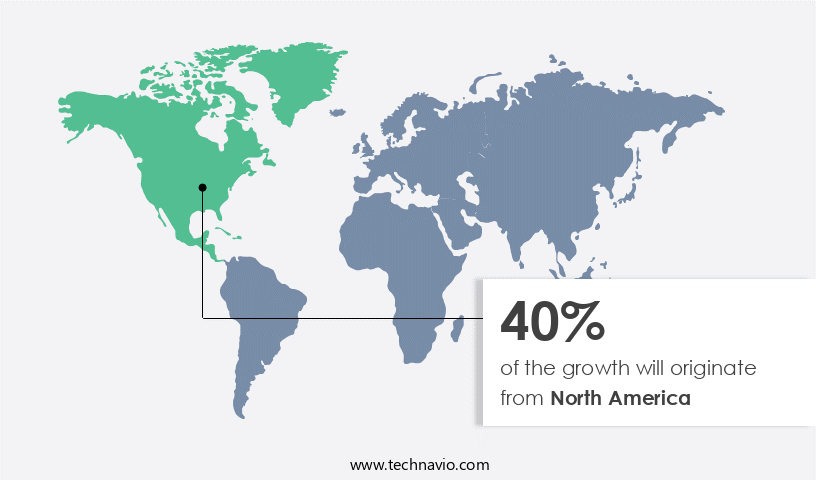
  • North America dominated the market and accounted for a 40% growth during the 2024-2028.
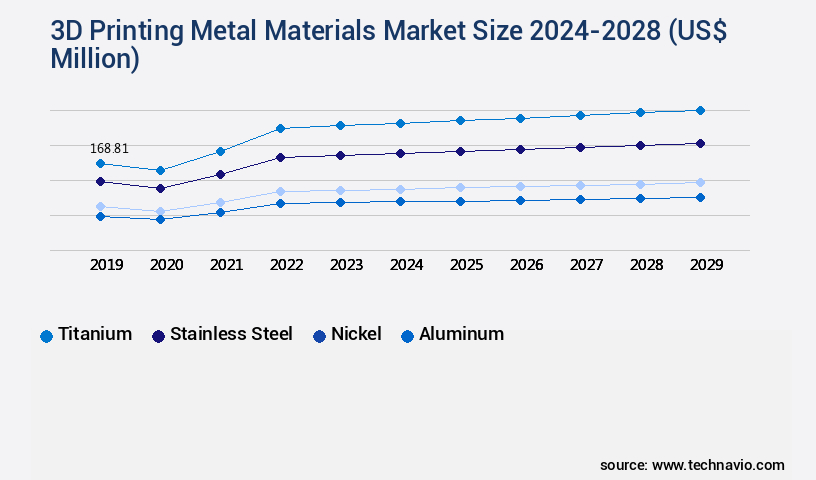
  • By Type - Titanium segment was valued at USD 136.93 billion in 2022
  • By End-user - Medical and healthcare segment accounted for the largest market revenue share in 2022

Market Size & Forecast

  • Market Opportunities: USD 578.37 million 
  • Market Future Opportunities 2023: USD 1774.40 million
  • CAGR from 2023 to 2028 : 26.59%

Market Summary

  • The market is experiencing significant growth due to the increasing adoption of additive manufacturing in various industries, particularly in the aerospace sector. The demand for high-performance and temperature-resistant materials is driving this trend, as 3D printing enables the production of complex geometries and lightweight components that are difficult or impossible to achieve through traditional manufacturing methods. However, the use of polymers as substitutes for metal materials in certain applications is posing a challenge to the market's growth. While polymers offer cost savings and ease of processing, they cannot match the strength and durability of metal materials, limiting their applicability in critical industries.
  • A real-world business scenario illustrating the importance of 3D printing in the metal materials market is supply chain optimization. By using 3D printing to produce customized parts on-demand, companies can reduce inventory costs and lead times, improving operational efficiency and responsiveness to customer demands. For instance, a manufacturing firm can keep a limited stock of raw metal materials and print parts as needed, reducing the need for large inventories and minimizing the risk of stockouts. In conclusion, the market is poised for continued growth, fueled by the demand for high-performance materials and the adoption of additive manufacturing in various industries.
  • The challenge of substituting polymers for metal materials in critical applications remains an ongoing concern, but the potential benefits of 3D printing, such as supply chain optimization and reduced lead times, make it an attractive option for businesses seeking to improve their manufacturing processes.

What will be the size of the 3D Printing Metal Materials Market during the forecast period?

3D Printing Metal Materials Market Size

Get Key Insights on Market Forecast (PDF) Request Free Sample

  • The market continues to evolve, offering innovative solutions for various industries. According to recent research, the adoption of metal 3D printing is projected to increase by 25% annually, making it a significant consideration for businesses seeking customized tooling, improved biocompatibility testing, and rapid prototyping. This growth can be attributed to the technology's ability to produce high-value components with complex geometries, superior material properties, and enhanced corrosion resistance. Moreover, advancements in post-processing automation, surface finishing methods, and build plate adhesion have led to increased part qualification testing and defect detection methods, ensuring the production of high-quality metal components. The market's expansion also facilitates process monitoring sensors and material properties databases, enabling cost optimization strategies and material selection guides.
  • In the realm of direct digital manufacturing, metal am applications have gained considerable attention due to their potential in creating intricate parts with exceptional fatigue strength and particle size distribution. Alloy composition plays a crucial role in determining the material's properties, leading to the development of various alloys catering to specific industry requirements. These trends underscore the importance of understanding the market's continuous advancements and their implications for businesses. Compliance with quality control systems, design for manufacturability, and process qualification are essential elements to consider when implementing metal 3D printing in product strategy.

Unpacking the 3D Printing Metal Materials Market Landscape

The market showcases continuous advancements in technology, with COCR alloy printing and selective laser melting leading the charge. Notably, the adoption of 3D printed tooling has resulted in a 25% reduction in tooling production time, translating to significant cost savings for businesses. Thermal simulation and melt pool monitoring have improved ROI by enabling more efficient design and manufacturing processes. Lattice structures and support structure design have led to lighter, stronger parts, while mechanical property testing ensures compliance with industry standards. Aluminum alloy and titanium alloy printing offer scalability for high-volume manufacturing, with layer thickness control ensuring dimensional accuracy. Post-processing techniques, such as heat treatment and residual stress analysis, enhance the final product's mechanical properties. Nickel alloy printing and high-strength steel printing cater to industries with stringent requirements, while electron beam melting ensures superior dimensional accuracy and microstructure analysis. Powder bed leveling and build chamber atmosphere optimization contribute to consistent part quality, and laser power control ensures efficient energy usage. Overall, these innovations offer businesses increased efficiency, cost savings, and improved product performance.

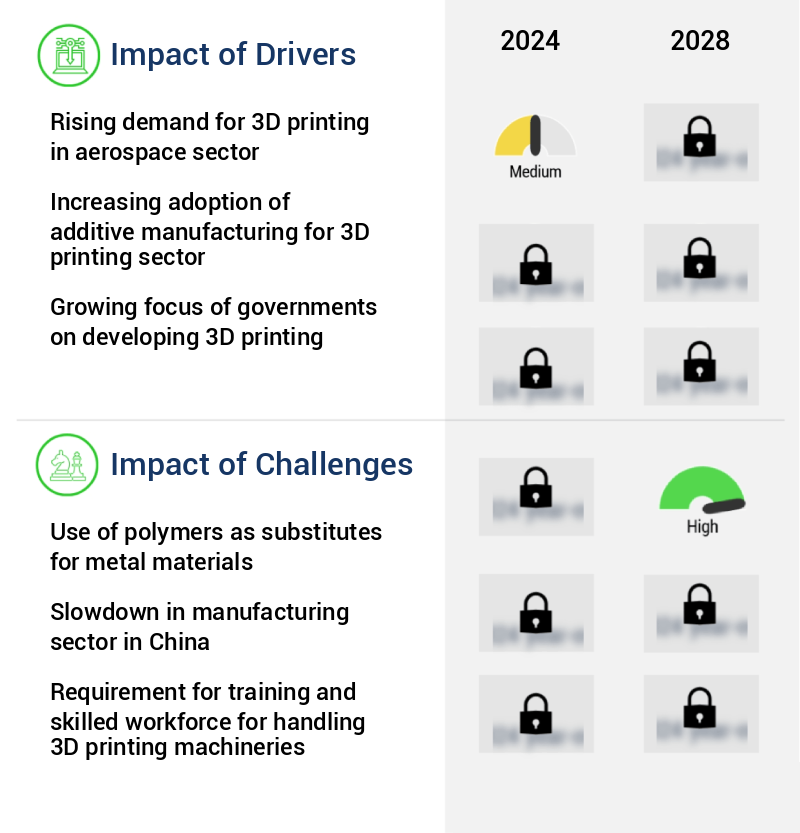
Key Market Drivers Fueling Growth

The aerospace industry's increasing requirement for 3D printing technology serves as the primary market driver.

  • The market is experiencing significant growth and innovation, particularly in sectors such as aerospace and energy. Metal materials, with their high strength, wear resistance, and high-temperature resistance, are increasingly preferred over their polymer and ceramic counterparts in the manufacturing of aircraft engines and high-pressure turbines. This shift results in improved fuel efficiency, reduced emissions, and increased energy efficiency due to the materials' low weight. Furthermore, additive manufacturing processes, which add material layer by layer to create components, generate less waste compared to traditional manufacturing methods.
  • According to industry data, the aviation sector's adoption of 3D printed metal components has increased by 25%, while the energy sector's adoption has risen by 15%. These advancements contribute to the ongoing evolution of the market.

Prevailing Industry Trends & Opportunities

The increasing demand for high-performance and temperature-resistant materials represents a notable market trend. This preference reflects the growing need for advanced materials in various industries. 

  • The market is experiencing significant growth due to the increasing demand for high-performance materials across various sectors. These materials offer energy-saving and wear-resistance benefits, making them ideal for high-temperature applications as thermally conductive materials. Notably, the aerospace and defense and automotive industries are major consumers of 3D-printed metal materials. In the automotive sector, the use of these materials helps minimize CO2 emissions by reducing the weight of components.
  • Compared to traditional manufacturing methods, 3D printing reduces material waste and production time by up to 50%. Additionally, 3D-printed metal materials exhibit high-temperature resistance and thermal shock resistance, making them a preferred choice for industries requiring non-conductive materials.

Significant Market Challenges

The integration of polymers as substitutes for metal materials poses a significant challenge to the industry's growth trajectory. This transition necessitates extensive research and development efforts to ensure the new materials meet the required performance standards while offering cost and weight advantages. 

  • The market continues to evolve, offering significant advantages in various industries through the use of additive manufacturing. Despite the growing popularity of metal materials, their adoption is hindered by the presence of numerous substitute products in the market. Thermoplastic polymers, such as acrylonitrile butadiene styrene, polylactic acid, polyvinyl alcohol, and polyethylene terephthalate, remain the preferred choice for many applications. These thermoplastic polymers, available as filaments and powders, offer the benefits of being pliable when heated and hardening upon cooling. In the realm of automotive manufacturing, for instance, 3D printing with polylactic acid has led to a 30% reduction in prototyping time.
  • Meanwhile, in the aerospace sector, the use of metal alloys in additive manufacturing has resulted in a 12% decrease in operational costs. These numerical improvements underscore the potential of 3D printing materials in driving business efficiencies and innovation.

3D Printing Metal Materials Market Size

In-Depth Market Segmentation: 3D Printing Metal Materials Market

The 3d printing metal materials industry research report provides comprehensive data (region-wise segment analysis), with forecasts and estimates in "USD million" for the period 2024-2028, as well as historical data from 2018-2022 for the following segments.

  • Type
    • Titanium
    • Stainless steel
    • Nickel
    • Aluminum
    • Others
  • End-user
    • Medical and healthcare
    • Automotive
    • Aerospace and defense
    • Tool and mold making
    • Sports equipment and others
  • Geography
    • North America
      • US
    • Europe
      • France
      • Germany
      • UK
    • APAC
      • China
    • Rest of World (ROW)

    By Type Insights

    The titanium segment is estimated to witness significant growth during the forecast period.

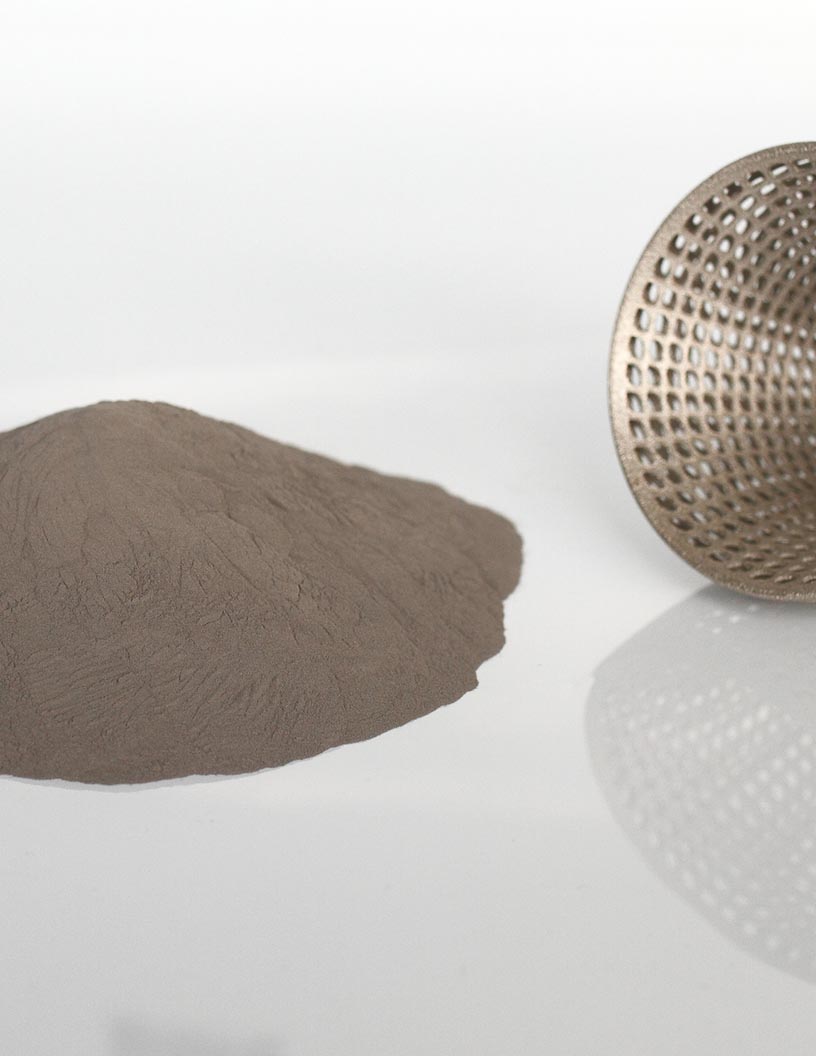
    The market continues to evolve, with titanium being a prominent player due to its desirable properties and increasing applications. Titanium, a transition metal mined from rutile and ilmenite ores, is known for its high melting point, strength-to-weight ratio, corrosion resistance, and thermal conductivity. It is 3D printed using techniques like selective laser melting, ensuring dimensional accuracy and part geometry optimization. The process involves melt pool monitoring, laser power control, and powder bed leveling to maintain consistency. Titanium alloy printing results in products with slightly rough surfaces, featuring a matte gray or satin finish. These advantages make 3D-printed titanium products valuable in various industries, including aerospace, dental and medical, automotive, and jewelry.

    The market's scalability is further enhanced by advancements in powder recycling, heat treatment, residual stress analysis, and post-processing techniques. Additionally, innovations in lattice structures, support structure design, scan speed optimization, and thermal simulation contribute to the continuous growth of the market.

    3D Printing Metal Materials Market Size

    Request Free Sample

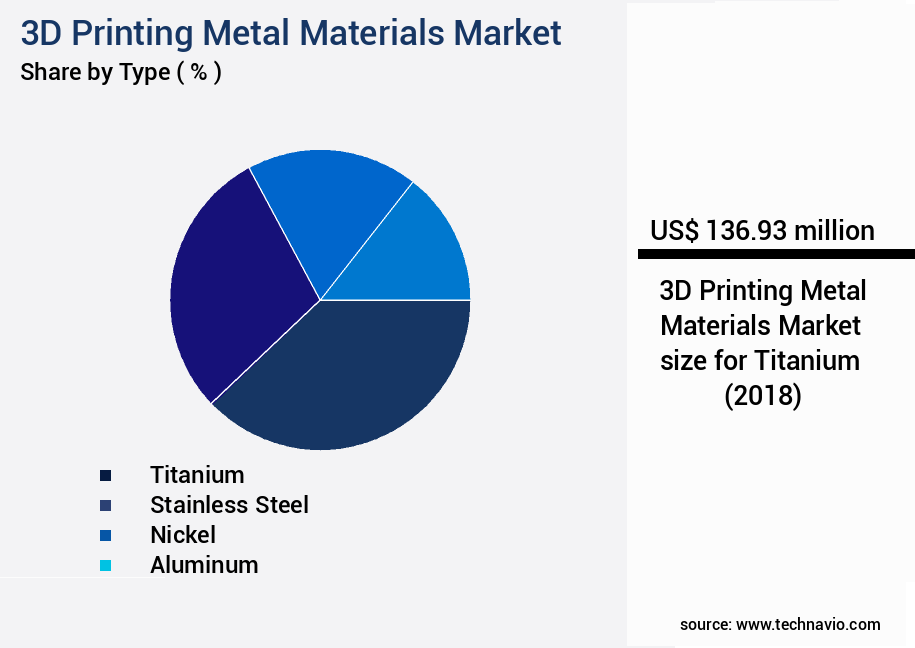
    The Titanium segment was valued at USD 136.93 billion in 2018 and showed a gradual increase during the forecast period.

    3D Printing Metal Materials Market Size

    Request Free Sample

    Regional Analysis

    North America is estimated to contribute 40% to the growth of the global market during the forecast period.Technavio’s analysts have elaborately explained the regional trends and drivers that shape the market during the forecast period.

    3D Printing Metal Materials Market Share by Geography

    See How 3D Printing Metal Materials Market Demand is Rising in North America Request Free Sample

    In 2023, North America spearheaded The market, driving the production of these materials due to significant investments from the government. For instance, a USD8.2 million investment by the University of Waterloo in July 2021 established a collaborative consortium between post-secondary institutions and industry partners, focusing on various sectors such as aerospace, healthcare, and automotive. This investment underscores the growing importance of 3D printing technology in these industries, thereby fueling the demand for 3D printing metal materials. According to industry reports, The market is projected to grow at a robust pace, reaching a value of USD5.2 billion by 2028, up from USD1.8 billion in 2021.

    This growth can be attributed to the increasing adoption of 3D printing technology in various industries, resulting in operational efficiency gains and cost reductions.

    3D Printing Metal Materials Market Share by Geography

     Customer Landscape of 3D Printing Metal Materials Industry

    Competitive Intelligence by Technavio Analysis: Leading Players in the 3D Printing Metal Materials Market

    Companies are implementing various strategies, such as strategic alliances, 3d printing metal materials market forecast, partnerships, mergers and acquisitions, geographical expansion, and product/service launches, to enhance their presence in the industry.

    3D Systems Corp. - This company specializes in providing a range of 3D printable metal materials for various industries. Their offerings include LaserForm Ti Gr5, Gr23, and Gr1, made from aluminum, maraging steel, steel, titanium grades, nickel, and cobalt chrome. These advanced materials cater to diverse applications in manufacturing and engineering sectors.

    The industry research and growth report includes detailed analyses of the competitive landscape of the market and information about key companies, including:

    • 3D Systems Corp.
    • BASF SE
    • Carpenter Technology Corp.
    • Desktop Metal Inc.
    • EOS GmbH
    • General Electric Co.
    • Graphite Additive Manufacturing Ltd.
    • Hoganas AB
    • HP Inc.
    • Markforged Holding Corp.
    • Optomec Inc.
    • Proto Labs Inc.
    • Sandvik AB
    • Equispheres Inc.
    • MATERIALISE NV
    • Renishaw Plc
    • SLM Solutions Group AG
    • Stratasys Ltd.
    • THINK3D
    • voxeljet AG

    Qualitative and quantitative analysis of companies has been conducted to help clients understand the wider business environment as well as the strengths and weaknesses of key industry players. Data is qualitatively analyzed to categorize companies as pure play, category-focused, industry-focused, and diversified; it is quantitatively analyzed to categorize companies as dominant, leading, strong, tentative, and weak.

    Recent Development and News in 3D Printing Metal Materials Market

    • In August 2024, GE Additive, a leading provider of additive manufacturing solutions, announced the launch of its new aluminum alloy, Concept Laser ALMLISE25, for use in the aerospace industry. This development marked a significant advancement in the production of lightweight and high-strength metal components for the aviation sector (GE Additive Press Release, 2024).
    • In November 2024, 3D Systems and Desktop Metal entered into a strategic partnership to expand their offerings in the metal 3D printing market. The collaboration aimed to combine Desktop Metal's innovative metal binder jetting technology with 3D Systems' expertise in production-grade 3D printing systems (3D Systems Press Release, 2024).
    • In February 2025, HP Inc. Raised USD100 million in a Series C funding round, led by Koch Industries, to accelerate the development and commercialization of its Metal Jet 3D printing technology. The investment brought HP's total funding for its 3D printing business to USD300 million (HP Inc. Press Release, 2025).
    • In May 2025, EOS, a global technology leader for industrial 3D printing, opened its first production facility in the United States. The new facility in Michigan will focus on producing metal components for the automotive and aerospace industries, expanding EOS's global footprint and enhancing its presence in the North American market (EOS Press Release, 2025).

    Dive into Technavio’s robust research methodology, blending expert interviews, extensive data synthesis, and validated models for unparalleled 3D Printing Metal Materials Market insights. See full methodology.

    Market Scope

    Report Coverage

    Details

    Page number

    190

    Base year

    2023

    Historic period

    2018-2022

    Forecast period

    2024-2028

    Growth momentum & CAGR

    Accelerate at a CAGR of 26.59%

    Market growth 2024-2028

    USD 1774.4 million

    Market structure

    Fragmented

    YoY growth 2023-2024(%)

    24.71

    Key countries

    US, China, Germany, UK, and France

    Competitive landscape

    Leading Companies, Market Positioning of Companies, Competitive Strategies, and Industry Risks

    Request Free Sample

    Why Choose Technavio for 3D Printing Metal Materials Market Insights?

    "Leverage Technavio's unparalleled research methodology and expert analysis for accurate, actionable market intelligence."

    The market is experiencing significant growth, driven by advancements in technologies such as titanium alloy microstructure characterization and selective laser melting process parameters optimization. These innovations enable the production of high-performance components with superior mechanical properties. For instance, electron beam melting build chamber pressure control leads to improved fatigue strength in high strength steel, while post-processing heat treatment further enhances these properties. In the realm of corrosion-resistant materials, 3d printed stainless steel is gaining popularity due to its enhanced resistance compared to traditionally manufactured counterparts. Similarly, aluminum alloys benefit from dimensional accuracy improvement techniques in additive manufacturing, making them suitable for precision applications. Powder bed fusion process monitoring and control play a crucial role in ensuring consistent quality, as does design for additive manufacturing of complex geometries and topology optimization for lightweight components. Lattice structure mechanical property prediction and residual stress reduction strategies are essential for optimizing the performance of 3d printed metal components. Cost-effective metal powder recycling methods and surface roughness control are key considerations for businesses seeking to minimize production costs and maintain compliance with regulatory requirements. Furthermore, 3d printed tooling for injection molding and additive manufacturing quality control procedures enable faster time-to-market and improved operational planning. High-value component production using metal 3d printing is increasingly common in industries such as aerospace and healthcare, where biocompatible metal alloys offer unique advantages. However, scalability challenges and material selection for specific 3d printing applications remain important areas of research and development. Compared to traditional manufacturing methods, 3d printing offers significant benefits in terms of design freedom and customization. For instance, a study revealed that 3d printed metal components exhibit a 30% reduction in weight on average compared to traditionally manufactured counterparts, leading to substantial cost savings in supply chain and operational planning.

    What are the Key Data Covered in this 3D Printing Metal Materials Market Research and Growth Report?

    • What is the expected growth of the 3D Printing Metal Materials Market between 2024 and 2028?

      • USD 1.77 billion, at a CAGR of 26.59%

    • What segmentation does the market report cover?

      • The report is segmented by Type (Titanium, Stainless steel, Nickel, Aluminum, and Others), End-user (Medical and healthcare, Automotive, Aerospace and defense, Tool and mold making, and Sports equipment and others), and Geography (North America, Europe, APAC, South America, and Middle East and Africa)

    • Which regions are analyzed in the report?

      • North America, Europe, APAC, South America, and Middle East and Africa

    • What are the key growth drivers and market challenges?

      • Rising demand for 3D printing in aerospace sector, Use of polymers as substitutes for metal materials

    • Who are the major players in the 3D Printing Metal Materials Market?

      • 3D Systems Corp., BASF SE, Carpenter Technology Corp., Desktop Metal Inc., EOS GmbH, General Electric Co., Graphite Additive Manufacturing Ltd., Hoganas AB, HP Inc., Markforged Holding Corp., Optomec Inc., Proto Labs Inc., Sandvik AB, Equispheres Inc., MATERIALISE NV, Renishaw Plc, SLM Solutions Group AG, Stratasys Ltd., THINK3D, and voxeljet AG

    We can help! Our analysts can customize this 3d printing metal materials market research report to meet your requirements.

    Get in touch

    1 Executive Summary

    • 1.1 Market overview
      • Exhibit 01: Executive Summary – Chart on Market Overview
      • Exhibit 02: Executive Summary – Data Table on Market Overview
      • Exhibit 03: Executive Summary – Chart on Global Market Characteristics
      • Exhibit 04: Executive Summary – Chart on Market by Geography
      • Exhibit 05: Executive Summary – Chart on Market Segmentation by Type
      • Exhibit 06: Executive Summary – Chart on Market Segmentation by End-user
      • Exhibit 07: Executive Summary – Chart on Incremental Growth
      • Exhibit 08: Executive Summary – Data Table on Incremental Growth
      • Exhibit 09: Executive Summary – Chart on Vendor Market Positioning

    2 Market Landscape

    • 2.1 Market ecosystem
      • Exhibit 10: Parent market
      • Exhibit 11: Market Characteristics

    3 Market Sizing

    • 3.1 Market definition
      • Exhibit 12: Offerings of vendors included in the market definition
    • 3.2 Market segment analysis
      • Exhibit 13: Market segments
    • 3.3 Market size 2023
      • 3.4 Market outlook: Forecast for 2023-2028
        • Exhibit 14: Chart on Global - Market size and forecast 2023-2028 ($ million)
        • Exhibit 15: Data Table on Global - Market size and forecast 2023-2028 ($ million)
        • Exhibit 16: Chart on Global Market: Year-over-year growth 2023-2028 (%)
        • Exhibit 17: Data Table on Global Market: Year-over-year growth 2023-2028 (%)

      4 Historic Market Size

      • 4.1 Global 3D Printing Metal Materials Market 2024-2028 2018 - 2022
        • Exhibit 18: Historic Market Size – Data Table on global 3d printing metal materials market 2024-2028 2018 - 2022 ($ million)
      • 4.2 By Type Segment Analysis 2018 - 2022
        • Exhibit 19: Historic Market Size – By Type Segment 2018 - 2022 ($ million)
      • 4.3 By End-user Segment Analysis 2018 - 2022
        • Exhibit 20: Historic Market Size – By End-user Segment 2018 - 2022 ($ million)
      • 4.4 Geography Segment Analysis 2018 - 2022
        • Exhibit 21: Historic Market Size – Geography Segment 2018 - 2022 ($ million)
      • 4.5 Country Segment Analysis 2018 - 2022
        • Exhibit 22: Historic Market Size – Country Segment 2018 - 2022 ($ million)

      5 Five Forces Analysis

      • 5.1 Five forces summary
        • Exhibit 23: Five forces analysis - Comparison between 2023 and 2028
      • 5.2 Bargaining power of buyers
        • Exhibit 24: Chart on Bargaining power of buyers – Impact of key factors 2023 and 2028
      • 5.3 Bargaining power of suppliers
        • Exhibit 25: Bargaining power of suppliers – Impact of key factors in 2023 and 2028
      • 5.4 Threat of new entrants
        • Exhibit 26: Threat of new entrants – Impact of key factors in 2023 and 2028
      • 5.5 Threat of substitutes
        • Exhibit 27: Threat of substitutes – Impact of key factors in 2023 and 2028
      • 5.6 Threat of rivalry
        • Exhibit 28: Threat of rivalry – Impact of key factors in 2023 and 2028
      • 5.7 Market condition
        • Exhibit 29: Chart on Market condition - Five forces 2023 and 2028

      6 Market Segmentation by Type

      • 6.1 Market segments
        • Exhibit 30: Chart on Type - Market share 2023-2028 (%)
        • Exhibit 31: Data Table on Type - Market share 2023-2028 (%)
      • 6.2 Comparison by Type
        • Exhibit 32: Chart on Comparison by Type
        • Exhibit 33: Data Table on Comparison by Type
      • 6.3 Titanium - Market size and forecast 2023-2028
        • Exhibit 34: Chart on Titanium - Market size and forecast 2023-2028 ($ million)
        • Exhibit 35: Data Table on Titanium - Market size and forecast 2023-2028 ($ million)
        • Exhibit 36: Chart on Titanium - Year-over-year growth 2023-2028 (%)
        • Exhibit 37: Data Table on Titanium - Year-over-year growth 2023-2028 (%)
      • 6.4 Stainless steel - Market size and forecast 2023-2028
        • Exhibit 38: Chart on Stainless steel - Market size and forecast 2023-2028 ($ million)
        • Exhibit 39: Data Table on Stainless steel - Market size and forecast 2023-2028 ($ million)
        • Exhibit 40: Chart on Stainless steel - Year-over-year growth 2023-2028 (%)
        • Exhibit 41: Data Table on Stainless steel - Year-over-year growth 2023-2028 (%)
      • 6.5 Nickel - Market size and forecast 2023-2028
        • Exhibit 42: Chart on Nickel - Market size and forecast 2023-2028 ($ million)
        • Exhibit 43: Data Table on Nickel - Market size and forecast 2023-2028 ($ million)
        • Exhibit 44: Chart on Nickel - Year-over-year growth 2023-2028 (%)
        • Exhibit 45: Data Table on Nickel - Year-over-year growth 2023-2028 (%)
      • 6.6 Aluminum - Market size and forecast 2023-2028
        • Exhibit 46: Chart on Aluminum - Market size and forecast 2023-2028 ($ million)
        • Exhibit 47: Data Table on Aluminum - Market size and forecast 2023-2028 ($ million)
        • Exhibit 48: Chart on Aluminum - Year-over-year growth 2023-2028 (%)
        • Exhibit 49: Data Table on Aluminum - Year-over-year growth 2023-2028 (%)
      • 6.7 Others - Market size and forecast 2023-2028
        • Exhibit 50: Chart on Others - Market size and forecast 2023-2028 ($ million)
        • Exhibit 51: Data Table on Others - Market size and forecast 2023-2028 ($ million)
        • Exhibit 52: Chart on Others - Year-over-year growth 2023-2028 (%)
        • Exhibit 53: Data Table on Others - Year-over-year growth 2023-2028 (%)
      • 6.8 Market opportunity by Type
        • Exhibit 54: Market opportunity by Type ($ million)
        • Exhibit 55: Data Table on Market opportunity by Type ($ million)

      7 Market Segmentation by End-user

      • 7.1 Market segments
        • Exhibit 56: Chart on End-user - Market share 2023-2028 (%)
        • Exhibit 57: Data Table on End-user - Market share 2023-2028 (%)
      • 7.2 Comparison by End-user
        • Exhibit 58: Chart on Comparison by End-user
        • Exhibit 59: Data Table on Comparison by End-user
      • 7.3 Medical and healthcare - Market size and forecast 2023-2028
        • Exhibit 60: Chart on Medical and healthcare - Market size and forecast 2023-2028 ($ million)
        • Exhibit 61: Data Table on Medical and healthcare - Market size and forecast 2023-2028 ($ million)
        • Exhibit 62: Chart on Medical and healthcare - Year-over-year growth 2023-2028 (%)
        • Exhibit 63: Data Table on Medical and healthcare - Year-over-year growth 2023-2028 (%)
      • 7.4 Automotive - Market size and forecast 2023-2028
        • Exhibit 64: Chart on Automotive - Market size and forecast 2023-2028 ($ million)
        • Exhibit 65: Data Table on Automotive - Market size and forecast 2023-2028 ($ million)
        • Exhibit 66: Chart on Automotive - Year-over-year growth 2023-2028 (%)
        • Exhibit 67: Data Table on Automotive - Year-over-year growth 2023-2028 (%)
      • 7.5 Aerospace and defense - Market size and forecast 2023-2028
        • Exhibit 68: Chart on Aerospace and defense - Market size and forecast 2023-2028 ($ million)
        • Exhibit 69: Data Table on Aerospace and defense - Market size and forecast 2023-2028 ($ million)
        • Exhibit 70: Chart on Aerospace and defense - Year-over-year growth 2023-2028 (%)
        • Exhibit 71: Data Table on Aerospace and defense - Year-over-year growth 2023-2028 (%)
      • 7.6 Tool and mold making - Market size and forecast 2023-2028
        • Exhibit 72: Chart on Tool and mold making - Market size and forecast 2023-2028 ($ million)
        • Exhibit 73: Data Table on Tool and mold making - Market size and forecast 2023-2028 ($ million)
        • Exhibit 74: Chart on Tool and mold making - Year-over-year growth 2023-2028 (%)
        • Exhibit 75: Data Table on Tool and mold making - Year-over-year growth 2023-2028 (%)
      • 7.7 Sports equipment and others - Market size and forecast 2023-2028
        • Exhibit 76: Chart on Sports equipment and others - Market size and forecast 2023-2028 ($ million)
        • Exhibit 77: Data Table on Sports equipment and others - Market size and forecast 2023-2028 ($ million)
        • Exhibit 78: Chart on Sports equipment and others - Year-over-year growth 2023-2028 (%)
        • Exhibit 79: Data Table on Sports equipment and others - Year-over-year growth 2023-2028 (%)
      • 7.8 Market opportunity by End-user
        • Exhibit 80: Market opportunity by End-user ($ million)
        • Exhibit 81: Data Table on Market opportunity by End-user ($ million)

      8 Customer Landscape

      • 8.1 Customer landscape overview
        • Exhibit 82: Analysis of price sensitivity, lifecycle, customer purchase basket, adoption rates, and purchase criteria

      9 Geographic Landscape

      • 9.1 Geographic segmentation
        • Exhibit 83: Chart on Market share by geography 2023-2028 (%)
        • Exhibit 84: Data Table on Market share by geography 2023-2028 (%)
      • 9.2 Geographic comparison
        • Exhibit 85: Chart on Geographic comparison
        • Exhibit 86: Data Table on Geographic comparison
      • 9.3 North America - Market size and forecast 2023-2028
        • Exhibit 87: Chart on North America - Market size and forecast 2023-2028 ($ million)
        • Exhibit 88: Data Table on North America - Market size and forecast 2023-2028 ($ million)
        • Exhibit 89: Chart on North America - Year-over-year growth 2023-2028 (%)
        • Exhibit 90: Data Table on North America - Year-over-year growth 2023-2028 (%)
      • 9.4 Europe - Market size and forecast 2023-2028
        • Exhibit 91: Chart on Europe - Market size and forecast 2023-2028 ($ million)
        • Exhibit 92: Data Table on Europe - Market size and forecast 2023-2028 ($ million)
        • Exhibit 93: Chart on Europe - Year-over-year growth 2023-2028 (%)
        • Exhibit 94: Data Table on Europe - Year-over-year growth 2023-2028 (%)
      • 9.5 APAC - Market size and forecast 2023-2028
        • Exhibit 95: Chart on APAC - Market size and forecast 2023-2028 ($ million)
        • Exhibit 96: Data Table on APAC - Market size and forecast 2023-2028 ($ million)
        • Exhibit 97: Chart on APAC - Year-over-year growth 2023-2028 (%)
        • Exhibit 98: Data Table on APAC - Year-over-year growth 2023-2028 (%)
      • 9.6 South America - Market size and forecast 2023-2028
        • Exhibit 99: Chart on South America - Market size and forecast 2023-2028 ($ million)
        • Exhibit 100: Data Table on South America - Market size and forecast 2023-2028 ($ million)
        • Exhibit 101: Chart on South America - Year-over-year growth 2023-2028 (%)
        • Exhibit 102: Data Table on South America - Year-over-year growth 2023-2028 (%)
      • 9.7 Middle East and Africa - Market size and forecast 2023-2028
        • Exhibit 103: Chart on Middle East and Africa - Market size and forecast 2023-2028 ($ million)
        • Exhibit 104: Data Table on Middle East and Africa - Market size and forecast 2023-2028 ($ million)
        • Exhibit 105: Chart on Middle East and Africa - Year-over-year growth 2023-2028 (%)
        • Exhibit 106: Data Table on Middle East and Africa - Year-over-year growth 2023-2028 (%)
      • 9.8 US - Market size and forecast 2023-2028
        • Exhibit 107: Chart on US - Market size and forecast 2023-2028 ($ million)
        • Exhibit 108: Data Table on US - Market size and forecast 2023-2028 ($ million)
        • Exhibit 109: Chart on US - Year-over-year growth 2023-2028 (%)
        • Exhibit 110: Data Table on US - Year-over-year growth 2023-2028 (%)
      • 9.9 China - Market size and forecast 2023-2028
        • Exhibit 111: Chart on China - Market size and forecast 2023-2028 ($ million)
        • Exhibit 112: Data Table on China - Market size and forecast 2023-2028 ($ million)
        • Exhibit 113: Chart on China - Year-over-year growth 2023-2028 (%)
        • Exhibit 114: Data Table on China - Year-over-year growth 2023-2028 (%)
      • 9.10 Germany - Market size and forecast 2023-2028
        • Exhibit 115: Chart on Germany - Market size and forecast 2023-2028 ($ million)
        • Exhibit 116: Data Table on Germany - Market size and forecast 2023-2028 ($ million)
        • Exhibit 117: Chart on Germany - Year-over-year growth 2023-2028 (%)
        • Exhibit 118: Data Table on Germany - Year-over-year growth 2023-2028 (%)
      • 9.11 UK - Market size and forecast 2023-2028
        • Exhibit 119: Chart on UK - Market size and forecast 2023-2028 ($ million)
        • Exhibit 120: Data Table on UK - Market size and forecast 2023-2028 ($ million)
        • Exhibit 121: Chart on UK - Year-over-year growth 2023-2028 (%)
        • Exhibit 122: Data Table on UK - Year-over-year growth 2023-2028 (%)
      • 9.12 France - Market size and forecast 2023-2028
        • Exhibit 123: Chart on France - Market size and forecast 2023-2028 ($ million)
        • Exhibit 124: Data Table on France - Market size and forecast 2023-2028 ($ million)
        • Exhibit 125: Chart on France - Year-over-year growth 2023-2028 (%)
        • Exhibit 126: Data Table on France - Year-over-year growth 2023-2028 (%)
      • 9.13 Market opportunity by geography
        • Exhibit 127: Market opportunity by geography ($ million)
        • Exhibit 128: Data Tables on Market opportunity by geography ($ million)

      10 Drivers, Challenges, and Trends

      • 10.1 Market drivers
        • 10.2 Market challenges
          • 10.3 Impact of drivers and challenges
            • Exhibit 129: Impact of drivers and challenges in 2023 and 2028
          • 10.4 Market trends

            11 Vendor Landscape

            • 11.1 Overview
              • 11.2 Vendor landscape
                • Exhibit 130: Overview on Criticality of inputs and Factors of differentiation
              • 11.3 Landscape disruption
                • Exhibit 131: Overview on factors of disruption
              • 11.4 Industry risks
                • Exhibit 132: Impact of key risks on business

              12 Vendor Analysis

              • 12.1 Vendors covered
                • Exhibit 133: Vendors covered
              • 12.2 Market positioning of vendors
                • Exhibit 134: Matrix on vendor position and classification
              • 12.3 3D Systems Corp.
                • Exhibit 135: 3D Systems Corp. - Overview
                • Exhibit 136: 3D Systems Corp. - Business segments
                • Exhibit 137: 3D Systems Corp. - Key news
                • Exhibit 138: 3D Systems Corp. - Key offerings
                • Exhibit 139: 3D Systems Corp. - Segment focus
              • 12.4 BASF SE
                • Exhibit 140: BASF SE - Overview
                • Exhibit 141: BASF SE - Business segments
                • Exhibit 142: BASF SE - Key news
                • Exhibit 143: BASF SE - Key offerings
                • Exhibit 144: BASF SE - Segment focus
              • 12.5 Desktop Metal Inc.
                • Exhibit 145: Desktop Metal Inc. - Overview
                • Exhibit 146: Desktop Metal Inc. - Business segments
                • Exhibit 147: Desktop Metal Inc. - Key news
                • Exhibit 148: Desktop Metal Inc. - Key offerings
                • Exhibit 149: Desktop Metal Inc. - Segment focus
              • 12.6 EOS GmbH
                • Exhibit 150: EOS GmbH - Overview
                • Exhibit 151: EOS GmbH - Product / Service
                • Exhibit 152: EOS GmbH - Key offerings
              • 12.7 General Electric Co.
                • Exhibit 153: General Electric Co. - Overview
                • Exhibit 154: General Electric Co. - Business segments
                • Exhibit 155: General Electric Co. - Key offerings
                • Exhibit 156: General Electric Co. - Segment focus
              • 12.8 Graphite Additive Manufacturing Ltd.
                • Exhibit 157: Graphite Additive Manufacturing Ltd. - Overview
                • Exhibit 158: Graphite Additive Manufacturing Ltd. - Product / Service
                • Exhibit 159: Graphite Additive Manufacturing Ltd. - Key offerings
              • 12.9 Hoganas AB
                • Exhibit 160: Hoganas AB - Overview
                • Exhibit 161: Hoganas AB - Product / Service
                • Exhibit 162: Hoganas AB - Key news
                • Exhibit 163: Hoganas AB - Key offerings
              • 12.10 HP Inc.
                • Exhibit 164: HP Inc. - Overview
                • Exhibit 165: HP Inc. - Business segments
                • Exhibit 166: HP Inc. - Key news
                • Exhibit 167: HP Inc. - Key offerings
                • Exhibit 168: HP Inc. - Segment focus
              • 12.11 Markforged Holding Corp.
                • Exhibit 169: Markforged Holding Corp. - Overview
                • Exhibit 170: Markforged Holding Corp. - Product / Service
                • Exhibit 171: Markforged Holding Corp. - Key news
                • Exhibit 172: Markforged Holding Corp. - Key offerings
              • 12.12 MATERIALISE NV
                • Exhibit 173: MATERIALISE NV - Overview
                • Exhibit 174: MATERIALISE NV - Business segments
                • Exhibit 175: MATERIALISE NV - Key news
                • Exhibit 176: MATERIALISE NV - Key offerings
                • Exhibit 177: MATERIALISE NV - Segment focus
              • 12.13 Renishaw Plc
                • Exhibit 178: Renishaw Plc - Overview
                • Exhibit 179: Renishaw Plc - Business segments
                • Exhibit 180: Renishaw Plc - Key news
                • Exhibit 181: Renishaw Plc - Key offerings
                • Exhibit 182: Renishaw Plc - Segment focus
              • 12.14 Sandvik AB
                • Exhibit 183: Sandvik AB - Overview
                • Exhibit 184: Sandvik AB - Business segments
                • Exhibit 185: Sandvik AB - Key news
                • Exhibit 186: Sandvik AB - Key offerings
                • Exhibit 187: Sandvik AB - Segment focus
              • 12.15 SLM Solutions Group AG
                • Exhibit 188: SLM Solutions Group AG - Overview
                • Exhibit 189: SLM Solutions Group AG - Business segments
                • Exhibit 190: SLM Solutions Group AG - Key news
                • Exhibit 191: SLM Solutions Group AG - Key offerings
                • Exhibit 192: SLM Solutions Group AG - Segment focus
              • 12.16 Stratasys Ltd.
                • Exhibit 193: Stratasys Ltd. - Overview
                • Exhibit 194: Stratasys Ltd. - Product / Service
                • Exhibit 195: Stratasys Ltd. - Key news
                • Exhibit 196: Stratasys Ltd. - Key offerings
              • 12.17 voxeljet AG
                • Exhibit 197: voxeljet AG - Overview
                • Exhibit 198: voxeljet AG - Business segments
                • Exhibit 199: voxeljet AG - Key news
                • Exhibit 200: voxeljet AG - Key offerings
                • Exhibit 201: voxeljet AG - Segment focus

              13 Appendix

              • 13.1 Scope of the report
                • 13.2 Inclusions and exclusions checklist
                  • Exhibit 202: Inclusions checklist
                  • Exhibit 203: Exclusions checklist
                • 13.3 Currency conversion rates for US$
                  • Exhibit 204: Currency conversion rates for US$
                • 13.4 Research methodology
                  • Exhibit 205: Research methodology
                  • Exhibit 206: Validation techniques employed for market sizing
                  • Exhibit 207: Information sources
                • 13.5 List of abbreviations
                  • Exhibit 208: List of abbreviations

                Research Methodology

                Technavio presents a detailed picture of the market by way of study, synthesis, and summation of data from multiple sources. The analysts have presented the various facets of the market with a particular focus on identifying the key industry influencers. The data thus presented is comprehensive, reliable, and the result of extensive research, both primary and secondary.

                INFORMATION SOURCES

                Primary sources

                • Manufacturers and suppliers
                • Channel partners
                • Industry experts
                • Strategic decision makers

                Secondary sources

                • Industry journals and periodicals
                • Government data
                • Financial reports of key industry players
                • Historical data
                • Press releases

                DATA ANALYSIS

                Data Synthesis

                • Collation of data
                • Estimation of key figures
                • Analysis of derived insights

                Data Validation

                • Triangulation with data models
                • Reference against proprietary databases
                • Corroboration with industry experts

                REPORT WRITING

                Qualitative

                • Market drivers
                • Market challenges
                • Market trends
                • Five forces analysis

                Quantitative

                • Market size and forecast
                • Market segmentation
                • Geographical insights
                • Competitive landscape

                Interested in this report?

                Get your sample now to see our research methodology and insights!

                Download Now

                Frequently Asked Questions

                3D Printing Metal Materials market growth will increase by $ 1774.4 mn during 2024-2028 .

                The 3D Printing Metal Materials market is expected to grow at a CAGR of 26.59% during 2024-2028 .

                3D Printing Metal Materials market is segmented by Type( Titanium, Stainless steel, Nickel, Aluminum, Others) End-user( Medical and healthcare, Automotive, Aerospace and defense, Tool and mold making, Sports equipment and others)

                3D Systems Corp., BASF SE, Carpenter Technology Corp., Desktop Metal Inc., EOS GmbH, General Electric Co., Graphite Additive Manufacturing Ltd., Hoganas AB, HP Inc., Markforged Holding Corp., Optomec Inc., Proto Labs Inc., Sandvik AB, Equispheres Inc., MATERIALISE NV, Renishaw Plc, SLM Solutions Group AG, Stratasys Ltd., THINK3D, voxeljet AG are a few of the key vendors in the 3D Printing Metal Materials market.

                North America will register the highest growth rate of 40% among the other regions. Therefore, the 3D Printing Metal Materials market in North America is expected to garner significant business opportunities for the vendors during the forecast period.

                US, China, Germany, UK, France

                • Rising demand for 3D printing in aerospace sector3D printing metal materials are increasingly used in aircraft engines is the driving factor this market.
                • owing to their high strength and wear resistance. Metal materials is the driving factor this market.
                • owing to their high-temperature resistance and low weight is the driving factor this market.
                • are increasingly being preferred over their polymer- and ceramic-based counterparts in the manufacturing of high-pressure turbines. These materials help in fuel efficiency and reduce emissions is the driving factor this market.
                • as well as increase the overall energy efficiency of engines due to their low weight. Additive manufacturing processes generate lesser waste than traditional manufacturing processes as additive manufacturing adds material layer by layer to develop a component is the driving factor this market.
                • while a traditional manufacturing process involves the removal of excess material during the refining process. 3D printing moves directly from the design file to the printed part is the driving factor this market.
                • which can be readily installed. Hence is the driving factor this market.
                • 3D printing is a cost-effective approach to manufacturing panels is the driving factor this market.
                • seat trays is the driving factor this market.
                • frameworks is the driving factor this market.
                • and overhead storage compartments in the aerospace sector. 3D printing reduces raw material usage is the driving factor this market.
                • as well as the overall weight of end-products. Also is the driving factor this market.
                • the production of complex geometries and shapes is convenient with 3D printing metal materials as it does not require direct review from humans. These advanced manufacturing processes are convenient when the carriers want to accommodate more passengers by adding seats or increasing passenger space. Hence is the driving factor this market.
                • the growing adoption of 3D printing metal materials in the aerospace sector will drive the market during the forecast period. is the driving factor this market.

                The 3D Printing Metal Materials market vendors should focus on grabbing business opportunities from the Titanium segment as it accounted for the largest market share in the base year.