Binder Jetting Market Analysis North America, Europe, APAC, South America, Middle East and Africa - US, UK, Germany, China, Canada, France, India, Japan, The Netherlands, Brazil - Size and Forecast 2024-2028

Binder Jetting Market Analysis North America, Europe, APAC, South America, Middle East and Africa - US, UK, Germany, China, Canada, France, India, Japan, The Netherlands, Brazil - Size and Forecast 2024-2028

Published: Nov 2024 212 Pages SKU: IRTNTR80365

Market Overview at a Glance

$1.11 B
Market Opportunity
21.4%
CAGR
20.0
YoY growth 2023-2024(%)

Binder Jetting Market Size 2024-2028

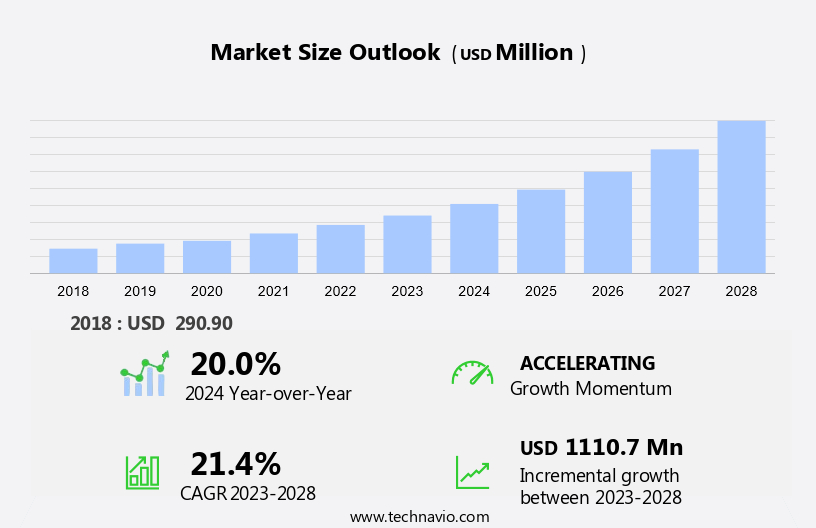
The binder jetting market size is forecast to increase by USD 1.11 billion at a CAGR of 21.4% between 2023 and 2028.

  • The market is experiencing significant growth due to several key trends. One of the primary drivers is the increasing defense budgetary allocations towards advanced manufacturing technologies. Another trend is the continuous product innovations In the field of binder jetting, leading to the development of more efficient and cost-effective systems. The market is experiencing significant growth, driven by the increasing adoption of digital manufacturing technologies and the shift towards sustainable and eco-friendly manufacturing processes. Industry 4.0 initiatives, such as smart factories and automation, are fueling the demand for advanced materials and cost-effective production methods. However, the high cost of systems remains a challenge for market growth. Despite this, the market is expected to witness steady progress due to the advantages offered by technology, such as its ability to produce complex geometries and high-quality parts in a short time frame. Overall, the market holds immense potential for growth, driven by these trends and the continuous advancements In the technology.

What will be the Size of the Binder Jetting Market During the Forecast Period?

Binder Jetting Market Size

 Request Free Sample

  • Binder jetting technology, a key component of additive manufacturing, is gaining traction due to its ability to produce complex geometries and large-scale parts. Moreover, the market is witnessing a trend towards the use of recyclable, biodegradable, and eco-friendly materials, aligning with the circular economy and renewable energy initiatives. The healthcare sector, particularly patient-centric healthcare and medical device innovation, is also adopting the production of customized and biocompatible implants and prosthetics.
  • Government investment in research and development, as well as the increasing focus on lean manufacturing, supply chain optimization, and data-driven manufacturing, are further driving the growth of the market. The construction industry is also exploring the potential for sustainable design and waste reduction, while the dental technology sector is benefiting from advancements for cost-effective and precise production of dental restoratives. Overall, the market is poised for continued growth, driven by the convergence of digital manufacturing, sustainability, and advanced materials.

How is this Binder Jetting Industry segmented and which is the largest segment?

The report provides comprehensive data (region-wise segment analysis), with forecasts and estimates in "USD billion" for the period 2024-2028, as well as historical data from 2018-2022 for the following segments.

  • Material
    • Metal powders
    • Ceramics
    • Sand
  • End-user
    • Aerospace and defense
    • Automotive
    • Healthcare
    • Consumer goods
    • Others
  • Geography
    • North America
      • Canada
      • US
    • Europe
      • Germany
      • UK
      • France
    • APAC
      • China
      • India
      • Japan
    • South America
      • Brazil
    • Middle East and Africa

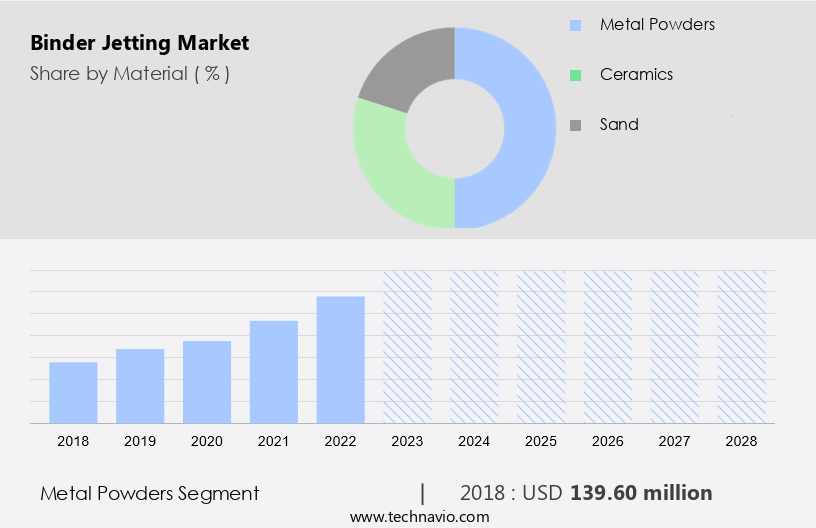
By Material Insights

  • The metal powders segment is estimated to witness significant growth during the forecast period.

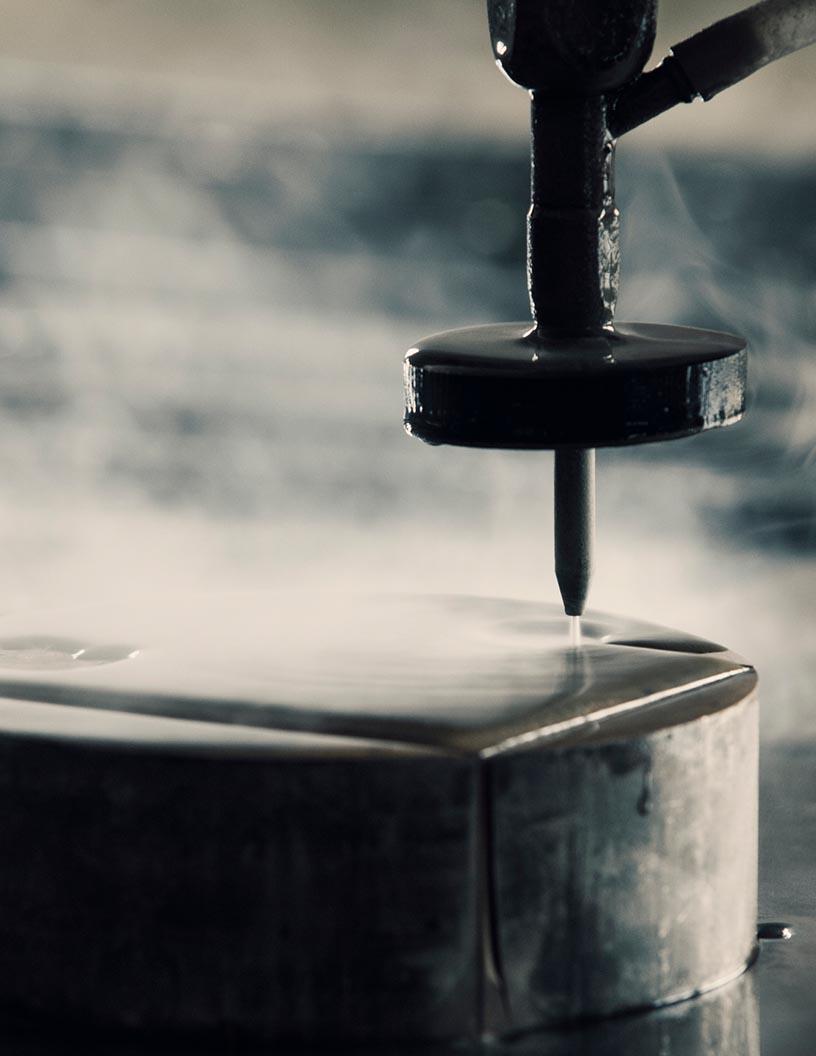
Binder jetting is a metal 3D printing technology that utilizes a liquid binder to selectively join metal powder particles, creating intricate structures layer by layer. The process begins with spreading a thin layer of metal powder onto a build platform, followed by the precise deposition of binder droplets by printheads. This sequence repeats as the platform lowers and fresh powder is spread, resulting In the gradual formation of the part. Notably, approximately 95% of the unused powder is recycled, contributing to the process's efficiency. Post-processing steps, including sintering and infiltration, are necessary to achieve the desired strength and durability for the final product.

This versatile technology is applicable to various industries, including aerospace, dental, and consumer goods, offering customizable designs, reduced lead times, and lower production costs compared to traditional manufacturing methods. The adoption of eco-friendly binder materials and the recycling of unused powder contribute to sustainability, making it an environmentally sustainable solution for manufacturing industrial parts, architectural objects, and full-color 3D printing of consumer products.

Binder Jetting Market Size

Get a glance at the market report of share of various segments Request Free Sample

The metal powders segment was valued at USD 139.60 million in 2018 and showed a gradual increase during the forecast period.

Regional Analysis

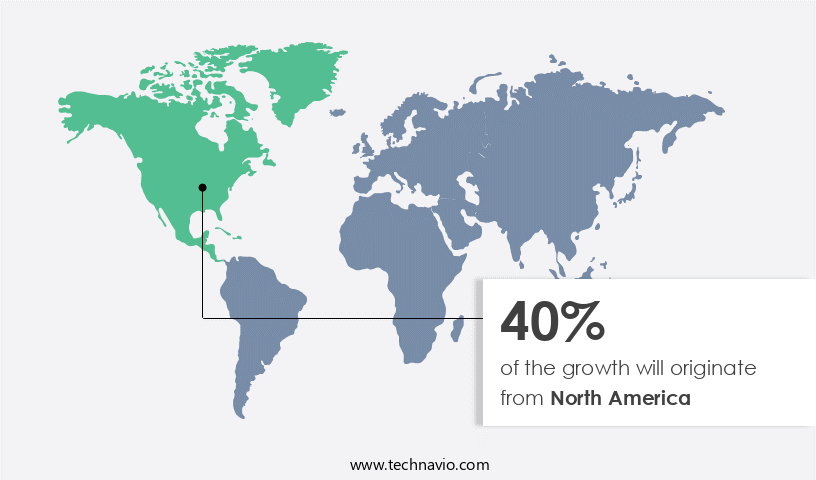
  • North America is estimated to contribute 40% to the growth of the global market during the forecast period.

Technavio's analysts have elaborately explained the regional trends and drivers that shape the market during the forecast period.

Binder Jetting Market Share by Geography

For more insights on the market size of various regions, Request Free Sample

The North American market, specifically the United States, plays a pivotal role In the global binder jetting industry, fueled by continuous innovations and commercializations In the additive manufacturing (AM) sector. Notably, Colibrium Additive launched the full commercial availability of its Series 3 metal binder jet system in September 2024. This large-scale metal binder jet system, one of the biggest In the market, signifies a significant achievement for the company following a rigorous development process. The Series 3 system is poised to revolutionize the AM industry by delivering advanced capabilities for producing metal parts on a large scale. In May 2024, Desktop Metal unveiled a Reactive Safety Kit for its Production System P-1. These developments underscore the growing importance of eco-friendly, customizable, and efficient solutions in various industries, including patient-specific dental applications, urbanization, and consumer goods manufacturing. The adoption of technology, which involves the selective binding of powder particles using a liquid binder, is increasingly gaining traction due to its versatility and ability to produce intricate structures with minimal material waste. This technology is also known for its potential to reduce production lead times, assembly time, and finishing costs compared to traditional manufacturing methods.

Furthermore, the integration of ecologically friendly materials and design changes, such as biodegradable binders and recycled metal powders, is a key trend driving market growth. The market is expected to witness substantial innovations in binder materials,  printers, and post-processing techniques, leading to full-scale production capabilities and increased accessibility for small-scale enterprises and pattern shops. Despite the high initial investment and production costs, the benefits of binder jetting, such as precision engineering, customizable designs, and shorter project requirements, are compelling. The technology's ability to produce high-quality metal prints with minimal material waste and efficient production methods makes it an environmentally sustainable solution for various industries. Thus, the market is poised for growth, driven by advancements in technology, eco-friendly innovations, and the increasing demand for customizable and efficient manufacturing solutions.

Market Dynamics

Our researchers analyzed the data with 2023 as the base year, along with the key drivers, trends, and challenges. A holistic analysis of drivers will help companies refine their marketing strategies to gain a competitive advantage.

What are the key market drivers leading to the rise In the adoption of Binder Jetting Industry?

  • Increased defense budgetary allocations are a major driver of the binder jetting market. The U.S. Department of Defense's FY 2024 budget stands at USD 849.8 billion up from USD 816.7 billion in FY 2023 highlighting strong investment in advanced manufacturing technologies. Similarly, India's 2024–25 defense budget rose 4.78% to USD 74.78 billion, signaling a global shift toward innovation and sustainability.
  • These investments are accelerating the adoption of binder jetting for producing intricate metal components, dental implants, and surgical instruments. The technology supports lightweight, high-strength parts in aerospace and defense with lower assembly time, finishing costs, and material waste.
  • As demand for customized, sustainable solutions grows, binder jetting is transforming pre-series manufacturing, pattern shops, and consumer goods production driving efficiency, precision, and full-scale adoption.

What are the market trends shaping the Binder Jetting Industry?

  • Product innovation is a key trend shaping the binder jetting market. Growing demand for eco-friendly products and patient-specific solutions especially in dental and aerospace is fueling market expansion. Recent innovations include sustainable binder materials, low-waste printing, and full-color 3D printing, making the technology ideal for complex, customizable parts.
  • Binder jetting is increasingly used by small enterprises to produce items like surgical instruments, shop fittings, and architectural components. Its ability to create complex geometries without support structures cuts production time and costs, while streamlined post-processing reduces lead times and finishing expenses.
  • Adoption is rising in pre-series manufacturing and pattern shops, as the technology supports rapid design adjustments. With continued investment in metal 3D printers and material innovation, binder jetting is proving to be a sustainable, high-precision alternative to traditional methods.

What challenges does the Binder Jetting Industry face during its growth?

  • The binder jetting market faces a major hurdle: high system costs. Basic machines start at over USD 100,000, while advanced models can exceed USD 500,000, making them out of reach for many small businesses. This steep entry cost limits adoption despite the technology's clear benefits such as the ability to produce complex, customizable parts with high precision.
  • Industries like aerospace, dental, consumer goods, and architecture value binder jetting for its versatility and speed. To offset costs, innovations in binder materials, post-processing, and production methods are helping reduce expenses and improve efficiency. Eco-friendly binders, faster assembly, and lower finishing costs are making the technology more accessible.Though costly, binder jetting remains a compelling solution for producing intricate, high-quality parts with shorter lead times.

Exclusive Customer Landscape

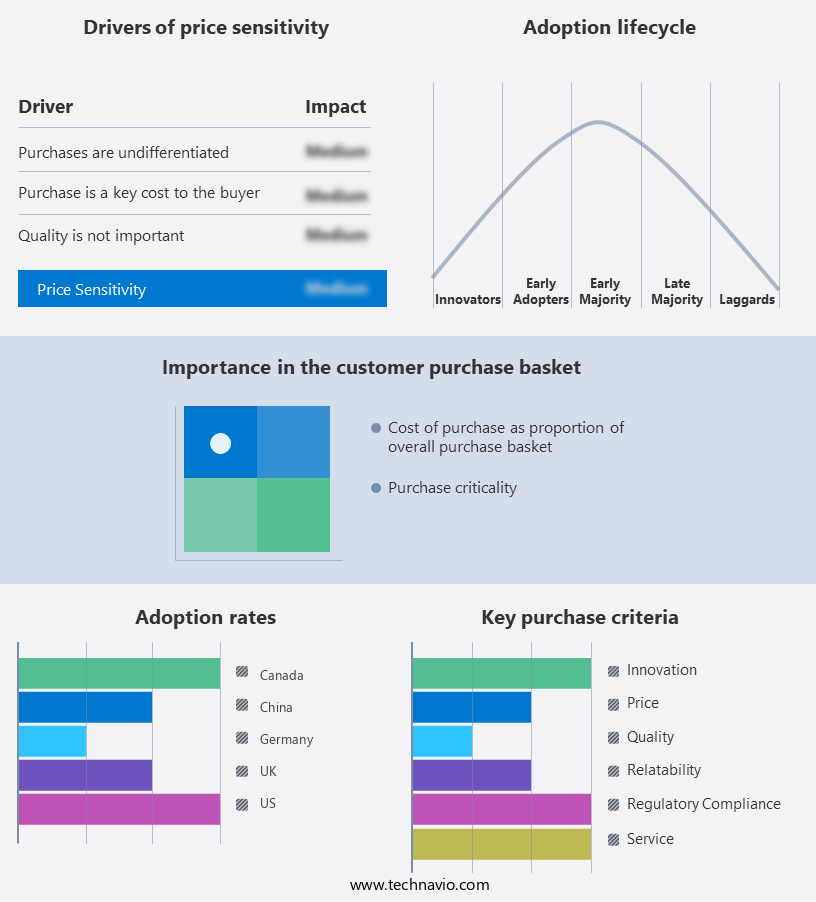
The binder jetting market forecasting report includes the adoption lifecycle of the market, market growth and forecasting, covering from the innovator's stage to the laggard's stage. It focuses on adoption rates in different regions based on penetration. Furthermore, the binder jetting market report also includes key purchase criteria and drivers of price sensitivity to help companies evaluate and develop their market growth analysis strategies.

Binder Jetting Market Share by Geography

 Customer Landscape

Key Companies & Market Insights

Companies are implementing various strategies, such as strategic alliances, binder jetting market forecast, partnerships, mergers and acquisitions, geographical expansion, and product/service launches, to enhance their presence In the industry.

The industry research and growth report includes detailed analyses of the competitive landscape of the market and information about key companies, including:

  • Dassault Systemes SE
  • Desktop Metal Inc.
  • EPTAM Precision
  • General Electric Co.
  • Hoganas AB
  • HP Inc.
  • Markforged Holding Corp.
  • MATERIALISE NV
  • Optomec Inc.
  • Proto3000 Inc.
  • Roland DG Corp.
  • Sandvik AB
  • Sculpteo Inc.
  • Stratasys Ltd.
  • voxeljet AG
  • Xjet Ltd.
  • Xometry Inc.

Qualitative and quantitative analysis of companies has been conducted to help clients understand the wider business environment as well as the strengths and weaknesses of key industry players. Data is qualitatively analyzed to categorize companies as pure play, category-focused, industry-focused, and diversified; it is quantitatively analyzed to categorize companies as dominant, leading, strong, tentative, and weak.

Research Analyst Overview

The Binder Jetting Market is at the forefront of the future of manufacturing, enabling rapid prototyping, mass customization, and on-demand manufacturing. With advances in binder jetting advancements, material advancements, and hardware advancements, the technology supports 3D printing medical devices, custom manufacturing, and digital fabrication using biocompatible, bio-based, biodegradable, and recyclable materials. It aligns with low-carbon manufacturing, green manufacturing, and sustainable manufacturing goals. Key trends include smart manufacturing, agile manufacturing, digital transformation, and manufacturing automation, enhanced by industrial robotics and software advancements.

Binder jetting enables precision manufacturing for dental technology advancements, construction industries, retail design, and architectural design, producing robust structures and personalized products. With benefits like time savings, cost analysis 3D printing, and scalability through scalable materials, this additive manufacturing solution supports tooling with 3D printing, product prototyping, digital twins, powder metallurgy, and design for manufacturing. 3D printing applications, including 3D printing case studies, showcase its impact on personalized medicine, building design, and manufacturing optimization. Demand for efficient, sustainable materials continues to drive growth in 3D printing services and additive manufacturing trends, fueled by increasing environmental consciousness.

Market Scope

Report Coverage

Details

Page number

212

Base year

2023

Historic period

2018-2022

Forecast period

2024-2028

Growth momentum & CAGR

Accelerate at a CAGR of 21.4%

Market growth 2024-2028

USD 11.11 billion

Market structure

Fragmented

YoY growth 2023-2024(%)

20.0

Key countries

US, UK, Germany, China, Canada, France, India, Japan, The Netherlands, and Brazil

Competitive landscape

Leading Companies, Market Positioning of Companies, Competitive Strategies, and Industry Risks

Request Free Sample

What are the Key Data Covered in this Binder Jetting Market Research and Growth Report?

  • CAGR of the Binder Jetting industry during the forecast period
  • Detailed information on factors that will drive the growth and forecasting between 2024 and 2028
  • Precise estimation of the size of the market and its contribution of the industry in focus to the parent market
  • Accurate predictions about upcoming growth and trends and changes in consumer behaviour
  • Growth of the market across North America, Europe, APAC, South America, and Middle East and Africa
  • Thorough analysis of the market's competitive landscape and detailed information about companies
  • Comprehensive analysis of factors that will challenge the binder jetting market growth of industry companies

We can help! Our analysts can customize this binder jetting market research report to meet your requirements.

Get in touch

1 Executive Summary

  • 1.1 Market overview
    • Executive Summary - Chart on Market Overview
    • Executive Summary - Data Table on Market Overview
    • Executive Summary - Chart on Global Market Characteristics
    • Executive Summary - Chart on Market by Geography
    • Executive Summary - Chart on Market Segmentation by Material
    • Executive Summary - Chart on Market Segmentation by End-user
    • Executive Summary - Chart on Incremental Growth
    • Executive Summary - Data Table on Incremental Growth
    • Executive Summary - Chart on Company Market Positioning

2 Technavio Analysis

  • 2.1 Analysis of price sensitivity, lifecycle, customer purchase basket, adoption rates, and purchase criteria
    • Analysis of price sensitivity, lifecycle, customer purchase basket, adoption rates, and purchase criteria
  • 2.2 Criticality of inputs and Factors of differentiation
    • Overview on criticality of inputs and factors of differentiation
  • 2.3 Factors of disruption
    • Overview on factors of disruption
  • 2.4 Impact of drivers and challenges
    • Impact of drivers and challenges in 2023 and 2028

3 Market Landscape

  • 3.1 Market ecosystem
    • Parent Market
    • Data Table on - Parent Market
  • 3.2 Market characteristics
    • Market characteristics analysis
  • 3.3 Value chain analysis
    • Value Chain Analysis

4 Market Sizing

  • 4.1 Market definition
    • Offerings of companies included in the market definition
  • 4.2 Market segment analysis
    • Market segments
  • 4.3 Market size 2023
    • 4.4 Market outlook: Forecast for 2023-2028
      • Chart on Global - Market size and forecast 2023-2028 ($ million)
      • Data Table on Global - Market size and forecast 2023-2028 ($ million)
      • Chart on Global Market: Year-over-year growth 2023-2028 (%)
      • Data Table on Global Market: Year-over-year growth 2023-2028 (%)

    5 Historic Market Size

    • 5.1 Global Binder Jetting Market 2018 - 2022
      • Historic Market Size - Data Table on Global Binder Jetting Market 2018 - 2022 ($ million)
    • 5.2 Material segment analysis 2018 - 2022
      • Historic Market Size - Material Segment 2018 - 2022 ($ million)
    • 5.3 End-user segment analysis 2018 - 2022
      • Historic Market Size - End-user Segment 2018 - 2022 ($ million)
    • 5.4 Geography segment analysis 2018 - 2022
      • Historic Market Size - Geography Segment 2018 - 2022 ($ million)
    • 5.5 Country segment analysis 2018 - 2022
      • Historic Market Size - Country Segment 2018 - 2022 ($ million)

    6 Qualitative Analysis

    • 6.1 Impact of AI on the Global Binder Jetting Market

      7 Five Forces Analysis

      • 7.1 Five forces summary
        • Five forces analysis - Comparison between 2023 and 2028
      • 7.2 Bargaining power of buyers
        • Bargaining power of buyers - Impact of key factors 2023 and 2028
      • 7.3 Bargaining power of suppliers
        • Bargaining power of suppliers - Impact of key factors in 2023 and 2028
      • 7.4 Threat of new entrants
        • Threat of new entrants - Impact of key factors in 2023 and 2028
      • 7.5 Threat of substitutes
        • Threat of substitutes - Impact of key factors in 2023 and 2028
      • 7.6 Threat of rivalry
        • Threat of rivalry - Impact of key factors in 2023 and 2028
      • 7.7 Market condition
        • Chart on Market condition - Five forces 2023 and 2028

      8 Market Segmentation by Material

      • 8.1 Market segments
        • Chart on Material - Market share 2023-2028 (%)
        • Data Table on Material - Market share 2023-2028 (%)
      • 8.2 Comparison by Material
        • Chart on Comparison by Material
        • Data Table on Comparison by Material
      • 8.3 Metal powders - Market size and forecast 2023-2028
        • Chart on Metal powders - Market size and forecast 2023-2028 ($ million)
        • Data Table on Metal powders - Market size and forecast 2023-2028 ($ million)
        • Chart on Metal powders - Year-over-year growth 2023-2028 (%)
        • Data Table on Metal powders - Year-over-year growth 2023-2028 (%)
      • 8.4 Ceramics - Market size and forecast 2023-2028
        • Chart on Ceramics - Market size and forecast 2023-2028 ($ million)
        • Data Table on Ceramics - Market size and forecast 2023-2028 ($ million)
        • Chart on Ceramics - Year-over-year growth 2023-2028 (%)
        • Data Table on Ceramics - Year-over-year growth 2023-2028 (%)
      • 8.5 Sand - Market size and forecast 2023-2028
        • Chart on Sand - Market size and forecast 2023-2028 ($ million)
        • Data Table on Sand - Market size and forecast 2023-2028 ($ million)
        • Chart on Sand - Year-over-year growth 2023-2028 (%)
        • Data Table on Sand - Year-over-year growth 2023-2028 (%)
      • 8.6 Market opportunity by Material
        • Market opportunity by Material ($ million)
        • Data Table on Market opportunity by Material ($ million)

      9 Market Segmentation by End-user

      • 9.1 Market segments
        • Chart on End-user - Market share 2023-2028 (%)
        • Data Table on End-user - Market share 2023-2028 (%)
      • 9.2 Comparison by End-user
        • Chart on Comparison by End-user
        • Data Table on Comparison by End-user
      • 9.3 Aerospace and defense - Market size and forecast 2023-2028
        • Chart on Aerospace and defense - Market size and forecast 2023-2028 ($ million)
        • Data Table on Aerospace and defense - Market size and forecast 2023-2028 ($ million)
        • Chart on Aerospace and defense - Year-over-year growth 2023-2028 (%)
        • Data Table on Aerospace and defense - Year-over-year growth 2023-2028 (%)
      • 9.4 Automotive - Market size and forecast 2023-2028
        • Chart on Automotive - Market size and forecast 2023-2028 ($ million)
        • Data Table on Automotive - Market size and forecast 2023-2028 ($ million)
        • Chart on Automotive - Year-over-year growth 2023-2028 (%)
        • Data Table on Automotive - Year-over-year growth 2023-2028 (%)
      • 9.5 Healthcare - Market size and forecast 2023-2028
        • Chart on Healthcare - Market size and forecast 2023-2028 ($ million)
        • Data Table on Healthcare - Market size and forecast 2023-2028 ($ million)
        • Chart on Healthcare - Year-over-year growth 2023-2028 (%)
        • Data Table on Healthcare - Year-over-year growth 2023-2028 (%)
      • 9.6 Consumer goods - Market size and forecast 2023-2028
        • Chart on Consumer goods - Market size and forecast 2023-2028 ($ million)
        • Data Table on Consumer goods - Market size and forecast 2023-2028 ($ million)
        • Chart on Consumer goods - Year-over-year growth 2023-2028 (%)
        • Data Table on Consumer goods - Year-over-year growth 2023-2028 (%)
      • 9.7 Others - Market size and forecast 2023-2028
        • Chart on Others - Market size and forecast 2023-2028 ($ million)
        • Data Table on Others - Market size and forecast 2023-2028 ($ million)
        • Chart on Others - Year-over-year growth 2023-2028 (%)
        • Data Table on Others - Year-over-year growth 2023-2028 (%)
      • 9.8 Market opportunity by End-user
        • Market opportunity by End-user ($ million)
        • Data Table on Market opportunity by End-user ($ million)

      10 Customer Landscape

      • 10.1 Customer landscape overview
        • Analysis of price sensitivity, lifecycle, customer purchase basket, adoption rates, and purchase criteria

      11 Geographic Landscape

      • 11.1 Geographic segmentation
        • Chart on Market share by geography 2023-2028 (%)
        • Data Table on Market share by geography 2023-2028 (%)
      • 11.2 Geographic comparison
        • Chart on Geographic comparison
        • Data Table on Geographic comparison
      • 11.3 North America - Market size and forecast 2023-2028
        • Chart on North America - Market size and forecast 2023-2028 ($ million)
        • Data Table on North America - Market size and forecast 2023-2028 ($ million)
        • Chart on North America - Year-over-year growth 2023-2028 (%)
        • Data Table on North America - Year-over-year growth 2023-2028 (%)
      • 11.4 Europe - Market size and forecast 2023-2028
        • Chart on Europe - Market size and forecast 2023-2028 ($ million)
        • Data Table on Europe - Market size and forecast 2023-2028 ($ million)
        • Chart on Europe - Year-over-year growth 2023-2028 (%)
        • Data Table on Europe - Year-over-year growth 2023-2028 (%)
      • 11.5 APAC - Market size and forecast 2023-2028
        • Chart on APAC - Market size and forecast 2023-2028 ($ million)
        • Data Table on APAC - Market size and forecast 2023-2028 ($ million)
        • Chart on APAC - Year-over-year growth 2023-2028 (%)
        • Data Table on APAC - Year-over-year growth 2023-2028 (%)
      • 11.6 South America - Market size and forecast 2023-2028
        • Chart on South America - Market size and forecast 2023-2028 ($ million)
        • Data Table on South America - Market size and forecast 2023-2028 ($ million)
        • Chart on South America - Year-over-year growth 2023-2028 (%)
        • Data Table on South America - Year-over-year growth 2023-2028 (%)
      • 11.7 Middle East and Africa - Market size and forecast 2023-2028
        • Chart on Middle East and Africa - Market size and forecast 2023-2028 ($ million)
        • Data Table on Middle East and Africa - Market size and forecast 2023-2028 ($ million)
        • Chart on Middle East and Africa - Year-over-year growth 2023-2028 (%)
        • Data Table on Middle East and Africa - Year-over-year growth 2023-2028 (%)
      • 11.8 US - Market size and forecast 2023-2028
        • Chart on US - Market size and forecast 2023-2028 ($ million)
        • Data Table on US - Market size and forecast 2023-2028 ($ million)
        • Chart on US - Year-over-year growth 2023-2028 (%)
        • Data Table on US - Year-over-year growth 2023-2028 (%)
      • 11.9 UK - Market size and forecast 2023-2028
        • Chart on UK - Market size and forecast 2023-2028 ($ million)
        • Data Table on UK - Market size and forecast 2023-2028 ($ million)
        • Chart on UK - Year-over-year growth 2023-2028 (%)
        • Data Table on UK - Year-over-year growth 2023-2028 (%)
      • 11.10 China - Market size and forecast 2023-2028
        • Chart on China - Market size and forecast 2023-2028 ($ million)
        • Data Table on China - Market size and forecast 2023-2028 ($ million)
        • Chart on China - Year-over-year growth 2023-2028 (%)
        • Data Table on China - Year-over-year growth 2023-2028 (%)
      • 11.11 Germany - Market size and forecast 2023-2028
        • Chart on Germany - Market size and forecast 2023-2028 ($ million)
        • Data Table on Germany - Market size and forecast 2023-2028 ($ million)
        • Chart on Germany - Year-over-year growth 2023-2028 (%)
        • Data Table on Germany - Year-over-year growth 2023-2028 (%)
      • 11.12 Canada - Market size and forecast 2023-2028
        • Chart on Canada - Market size and forecast 2023-2028 ($ million)
        • Data Table on Canada - Market size and forecast 2023-2028 ($ million)
        • Chart on Canada - Year-over-year growth 2023-2028 (%)
        • Data Table on Canada - Year-over-year growth 2023-2028 (%)
      • 11.13 France - Market size and forecast 2023-2028
        • Chart on France - Market size and forecast 2023-2028 ($ million)
        • Data Table on France - Market size and forecast 2023-2028 ($ million)
        • Chart on France - Year-over-year growth 2023-2028 (%)
        • Data Table on France - Year-over-year growth 2023-2028 (%)
      • 11.14 India - Market size and forecast 2023-2028
        • Chart on India - Market size and forecast 2023-2028 ($ million)
        • Data Table on India - Market size and forecast 2023-2028 ($ million)
        • Chart on India - Year-over-year growth 2023-2028 (%)
        • Data Table on India - Year-over-year growth 2023-2028 (%)
      • 11.15 Japan - Market size and forecast 2023-2028
        • Chart on Japan - Market size and forecast 2023-2028 ($ million)
        • Data Table on Japan - Market size and forecast 2023-2028 ($ million)
        • Chart on Japan - Year-over-year growth 2023-2028 (%)
        • Data Table on Japan - Year-over-year growth 2023-2028 (%)
      • 11.16 Brazil - Market size and forecast 2023-2028
        • Chart on Brazil - Market size and forecast 2023-2028 ($ million)
        • Data Table on Brazil - Market size and forecast 2023-2028 ($ million)
        • Chart on Brazil - Year-over-year growth 2023-2028 (%)
        • Data Table on Brazil - Year-over-year growth 2023-2028 (%)
      • 11.17 The Netherlands - Market size and forecast 2023-2028
        • Chart on The Netherlands - Market size and forecast 2023-2028 ($ million)
        • Data Table on The Netherlands - Market size and forecast 2023-2028 ($ million)
        • Chart on The Netherlands - Year-over-year growth 2023-2028 (%)
        • Data Table on The Netherlands - Year-over-year growth 2023-2028 (%)
      • 11.18 Market opportunity by geography
        • Market opportunity by geography ($ million)
        • Data Tables on Market opportunity by geography ($ million)

      12 Drivers, Challenges, and Opportunity/Restraints

      • 12.1 Market drivers
        • 12.2 Market challenges
          • 12.3 Impact of drivers and challenges
            • Impact of drivers and challenges in 2023 and 2028
          • 12.4 Market opportunities/restraints

            13 Competitive Landscape

            • 13.1 Overview
              • 13.2 Competitive Landscape
                • Overview on criticality of inputs and factors of differentiation
              • 13.3 Landscape disruption
                • Overview on factors of disruption
              • 13.4 Industry risks
                • Impact of key risks on business

              14 Competitive Analysis

              • 14.1 Companies profiled
                • Companies covered
              • 14.2 Company ranking index
                • Company ranking index
              • 14.3 Market positioning of companies
                • Matrix on companies position and classification
              • 14.4 Dassault Systemes SE
                • Dassault Systemes SE - Overview
                • Dassault Systemes SE - Product / Service
                • Dassault Systemes SE - Key news
                • Dassault Systemes SE - Key offerings
                • SWOT
              • 14.5 Desktop Metal Inc.
                • Desktop Metal Inc. - Overview
                • Desktop Metal Inc. - Business segments
                • Desktop Metal Inc. - Key news
                • Desktop Metal Inc. - Key offerings
                • Desktop Metal Inc. - Segment focus
                • SWOT
              • 14.6 General Electric Co.
                • General Electric Co. - Overview
                • General Electric Co. - Business segments
                • General Electric Co. - Key news
                • General Electric Co. - Key offerings
                • General Electric Co. - Segment focus
                • SWOT
              • 14.7 HP Inc.
                • HP Inc. - Overview
                • HP Inc. - Business segments
                • HP Inc. - Key news
                • HP Inc. - Key offerings
                • HP Inc. - Segment focus
                • SWOT
              • 14.8 Markforged Holding Corp.
                • Markforged Holding Corp. - Overview
                • Markforged Holding Corp. - Product / Service
                • Markforged Holding Corp. - Key offerings
                • SWOT
              • 14.9 MATERIALISE NV
                • MATERIALISE NV - Overview
                • MATERIALISE NV - Business segments
                • MATERIALISE NV - Key news
                • MATERIALISE NV - Key offerings
                • MATERIALISE NV - Segment focus
                • SWOT
              • 14.10 Optomec Inc.
                • Optomec Inc. - Overview
                • Optomec Inc. - Product / Service
                • Optomec Inc. - Key offerings
                • SWOT
              • 14.11 Proto3000 Inc.
                • Proto3000 Inc. - Overview
                • Proto3000 Inc. - Product / Service
                • Proto3000 Inc. - Key offerings
                • SWOT
              • 14.12 Roland DG Corp.
                • Roland DG Corp. - Overview
                • Roland DG Corp. - Product / Service
                • Roland DG Corp. - Key offerings
                • SWOT
              • 14.13 Sandvik AB
                • Sandvik AB - Overview
                • Sandvik AB - Business segments
                • Sandvik AB - Key news
                • Sandvik AB - Key offerings
                • Sandvik AB - Segment focus
                • SWOT
              • 14.14 Sculpteo Inc.
                • Sculpteo Inc. - Overview
                • Sculpteo Inc. - Product / Service
                • Sculpteo Inc. - Key offerings
                • SWOT
              • 14.15 Stratasys Ltd.
                • Stratasys Ltd. - Overview
                • Stratasys Ltd. - Product / Service
                • Stratasys Ltd. - Key news
                • Stratasys Ltd. - Key offerings
                • SWOT
              • 14.16 voxeljet AG
                • voxeljet AG - Overview
                • voxeljet AG - Business segments
                • voxeljet AG - Key news
                • voxeljet AG - Key offerings
                • voxeljet AG - Segment focus
                • SWOT
              • 14.17 Xjet Ltd.
                • Xjet Ltd. - Overview
                • Xjet Ltd. - Product / Service
                • Xjet Ltd. - Key offerings
                • SWOT
              • 14.18 Xometry Inc.
                • Xometry Inc. - Overview
                • Xometry Inc. - Product / Service
                • Xometry Inc. - Key offerings
                • SWOT

              15 Appendix

              • 15.1 Scope of the report
                • 15.2 Inclusions and exclusions checklist
                  • Inclusions checklist
                  • Exclusions checklist
                • 15.3 Currency conversion rates for US$
                  • Currency conversion rates for US$
                • 15.4 Research methodology
                  • Research methodology
                • 15.5 Data procurement
                  • Information sources
                • 15.6 Data validation
                  • Data validation
                • 15.7 Validation techniques employed for market sizing
                  • Validation techniques employed for market sizing
                • 15.8 Data synthesis
                  • Data synthesis
                • 15.9 360 degree market analysis
                  • 360 degree market analysis
                • 15.10 List of abbreviations
                  • List of abbreviations

                Research Methodology

                Technavio presents a detailed picture of the market by way of study, synthesis, and summation of data from multiple sources. The analysts have presented the various facets of the market with a particular focus on identifying the key industry influencers. The data thus presented is comprehensive, reliable, and the result of extensive research, both primary and secondary.

                INFORMATION SOURCES

                Primary sources

                • Manufacturers and suppliers
                • Channel partners
                • Industry experts
                • Strategic decision makers

                Secondary sources

                • Industry journals and periodicals
                • Government data
                • Financial reports of key industry players
                • Historical data
                • Press releases

                DATA ANALYSIS

                Data Synthesis

                • Collation of data
                • Estimation of key figures
                • Analysis of derived insights

                Data Validation

                • Triangulation with data models
                • Reference against proprietary databases
                • Corroboration with industry experts

                REPORT WRITING

                Qualitative

                • Market drivers
                • Market challenges
                • Market trends
                • Five forces analysis

                Quantitative

                • Market size and forecast
                • Market segmentation
                • Geographical insights
                • Competitive landscape

                Interested in this report?

                Get your sample now to see our research methodology and insights!

                Download Now

                Frequently Asked Questions

                Binder Jetting market growth will increase by $ 1110.7 mn during 2024-2028 .

                The Binder Jetting market is expected to grow at a CAGR of 21.4% during 2024-2028 .

                Binder Jetting market is segmented by Material( Metal powders, Ceramics, Sand) End-user( Aerospace and defense, Automotive, Healthcare, Consumer goods, Others)

                Dassault Systemes SE, Desktop Metal Inc., EPTAM Precision, General Electric Co., Hoganas AB, HP Inc., Markforged Holding Corp., MATERIALISE NV, Optomec Inc., Proto3000 Inc., Roland DG Corp., Sandvik AB, Sculpteo Inc., Stratasys Ltd., voxeljet AG, Xjet Ltd., Xometry Inc. are a few of the key vendors in the Binder Jetting market.

                North America will register the highest growth rate of 40% among the other regions. Therefore, the Binder Jetting market in North America is expected to garner significant business opportunities for the vendors during the forecast period.

                US, UK, Germany, China, Canada, France, India, Japan, The Netherlands, Brazil

                • Increased defense budgetary allocationsThe global binder jetting market is poised for significant growth is the driving factor this market.
                • driven by increased defense budgetary allocations in major economies. The United States Department of Defense has outlined a substantial budget request of $849.8 billion for fiscal year 2024 is the driving factor this market.
                • reflecting a notable increase from the $816.7 billion allocated in the Fiscal 2023 National Defense Authorization Act. This surge in funding underscores the commitment of the U.S. government to enhancing its defense capabilities is the driving factor this market.
                • which includes investments in advanced manufacturing technologies such as binder jetting.Similarly is the driving factor this market.
                • the defense budget of India for 2024–25 has been set at $74.78 billion is the driving factor this market.
                • marking a 4.78% increase over the allocation of the previous fiscal year. This upward trend in defense spending is indicative of a broader global movement towards strengthening military infrastructure and capabilities. As nations prioritize defense modernization is the driving factor this market.
                • there is a growing demand for innovative manufacturing solutions that can produce high-quality is the driving factor this market.
                • complex components efficiently and cost-effectively.Binder jetting technology is the driving factor this market.
                • with its ability to create intricate metal parts with high precision is the driving factor this market.
                • is particularly well-suited to meet the needs of the defense sector. The increased budgetary allocations provide a fertile ground for the adoption and integration of binder jetting in defense manufacturing processes. This technology not only enhances the production of critical components but also supports the development of new materials and applications tailored to defense requirements.The rise in defense budgets across key markets is a significant driver for the global binder jetting market. As defense departments seek to leverage cutting-edge technologies to maintain strategic advantages is the driving factor this market.
                • binder jetting is set to play a crucial role in the future of defense manufacturing. is the driving factor this market.

                The Binder Jetting market vendors should focus on grabbing business opportunities from the Metal powders segment as it accounted for the largest market share in the base year.