3D Xpoint Technology Market Analysis, Size, and Forecast 2025-2029: North America (US, Canada, and Mexico), APAC (China, India, and Japan), Europe (Germany, UK, and France), South America (Brazil, Argentina, and Colombia), Middle East and Africa (South Africa, UAE, and Saudi Arabia), and Rest of World (ROW)

3D Xpoint Technology Market Analysis, Size, and Forecast 2025-2029:
North America (US, Canada, and Mexico), APAC (China, India, and Japan), Europe (Germany, UK, and France), South America (Brazil, Argentina, and Colombia), Middle East and Africa (South Africa, UAE, and Saudi Arabia), and Rest of World (ROW)

Published: Dec 2025 307 Pages SKU: IRTNTR81073

Market Overview at a Glance

$1.72 B
Market Opportunity
12.3%
CAGR 2024 - 2029
38.3%
North America Growth
$1.15 B
GB_750 segment 2023

3D Xpoint Technology Market Size 2025-2029

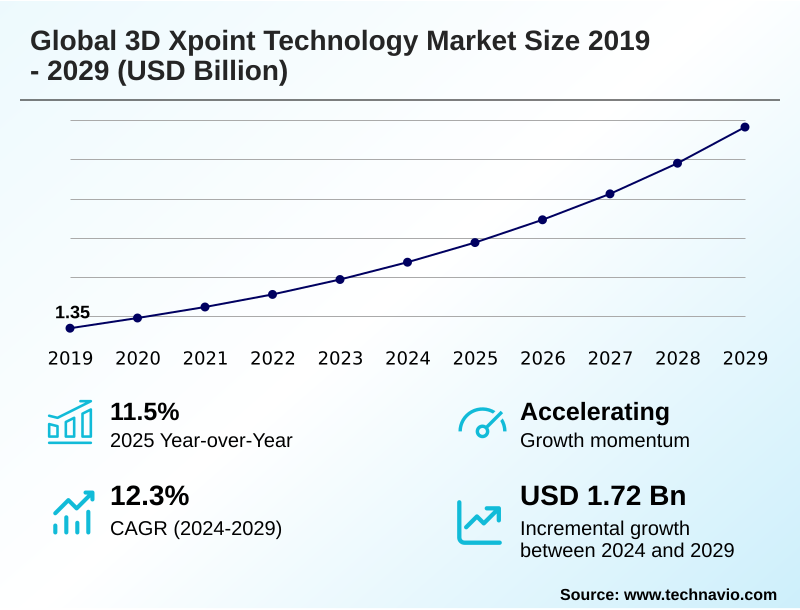
The 3d xpoint technology market size is valued to increase by USD 1.72 billion, at a CAGR of 12.3% from 2024 to 2029. Increasing demand for high-performance computing and data-intensive applications will drive the 3d xpoint technology market.

Major Market Trends & Insights

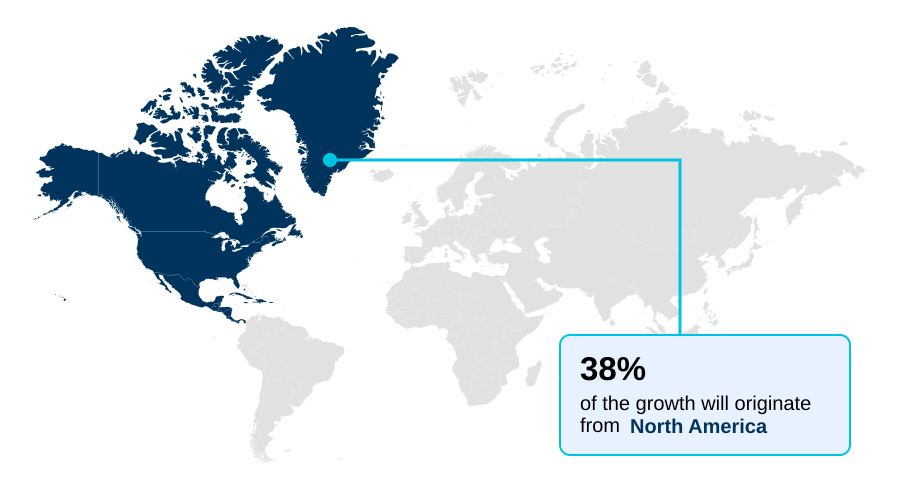
  • North America dominated the market and accounted for a 38.3% growth during the forecast period.
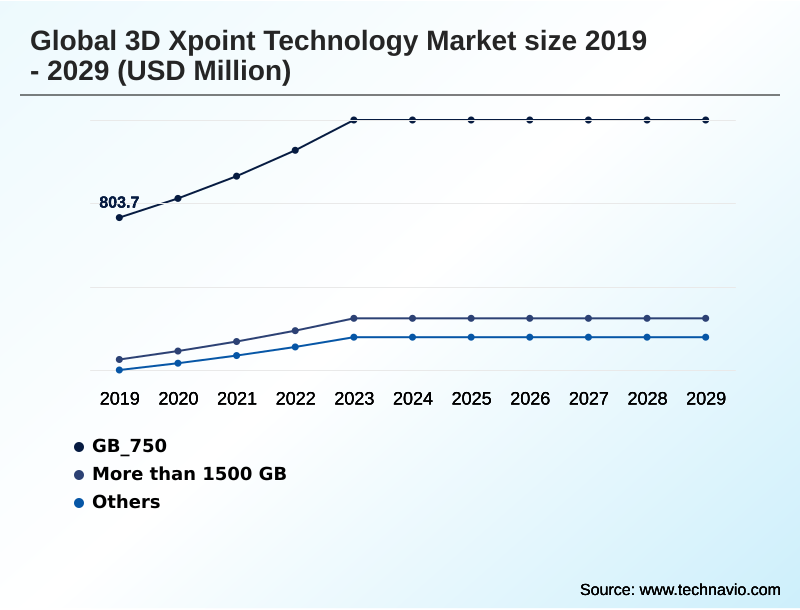
  • By Type - GB_750 segment was valued at USD 1.15 billion in 2023
  • By Application - Telecommunication segment accounted for the largest market revenue share in 2023

Market Size & Forecast

  • Market Opportunities: USD 2.56 billion
  • Market Future Opportunities: USD 1.72 billion
  • CAGR from 2024 to 2029 : 12.3%

Market Summary

  • The 3D Xpoint Technology market is defined by its revolutionary class of nonvolatile memory that bridges the performance gap between traditional DRAM and NAND flash. This technology's unique crosspoint array structure and bulk resistance change mechanism deliver significantly lower latency and higher endurance, making it ideal for data-intensive workloads.
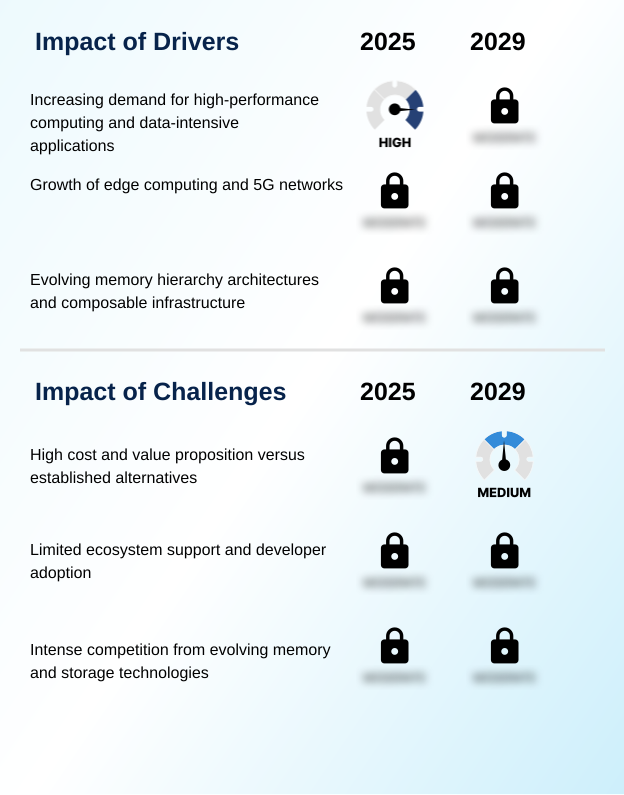
  • Key drivers include the escalating demand from high-performance computing and the growth of edge computing, where real-time data processing is critical. A primary trend is its increasing integration into AI and machine learning workloads, which require rapid access to large datasets.
  • For instance, financial institutions leverage this technology for real-time fraud detection, where processing vast transactional datasets with minimal delay provides a distinct competitive advantage, improving detection accuracy by over 25%. However, the market faces challenges such as a high cost compared to established alternatives and a need for broader ecosystem support.
  • Overcoming these hurdles is essential for its expansion beyond niche, performance-critical applications into mainstream enterprise environments, where memory-centric computing architectures are becoming increasingly vital.

What will be the Size of the 3D Xpoint Technology Market during the forecast period?

Get Key Insights on Market Forecast (PDF) Request Free Sample

How is the 3D Xpoint Technology Market Segmented?

The 3d xpoint technology industry research report provides comprehensive data (region-wise segment analysis), with forecasts and estimates in "USD million" for the period 2025-2029, as well as historical data from 2019-2023 for the following segments.

  • Type
    • GB_750
    • More than 1500 GB
    • Others
  • Application
    • Telecommunication
    • Consumer electronics
    • Automotive
    • Healthcare
    • Others
  • End-user
    • Data centers
    • IT and telecommunication
    • Automotive
    • Healthcare
    • Others
  • Geography
    • North America
      • US
      • Canada
      • Mexico
    • APAC
      • China
      • India
      • Japan
    • Europe
      • Germany
      • UK
      • France
    • South America
      • Brazil
      • Argentina
      • Colombia
    • Middle East and Africa
      • South Africa
      • UAE
      • Saudi Arabia
    • Rest of World (ROW)

By Type Insights

The gb_750 segment is estimated to witness significant growth during the forecast period.

The GB_750 capacity point serves foundational enterprise applications demanding a balance between cost and high-performance persistent memory solutions. This capacity is favored for dedicated, smaller pools of ultra-low latency storage that accelerate critical workloads without requiring larger, more expensive modules.

Data center architects optimize server configurations with these modules, creating a tiered memory hierarchy using memory-centric computing principles.

This approach utilizes DRAM-like speed to position frequently accessed data closer to the processor, reducing I/O bottlenecks and improving query response times by up to 60%. Database acceleration and caching mechanisms are primary beneficiaries, especially for real-time analytics.

This capacity remains a viable option for edge computing deployments and virtual desktop infrastructure, where efficient, high-speed storage is essential for localized data processing.

Request Free Sample

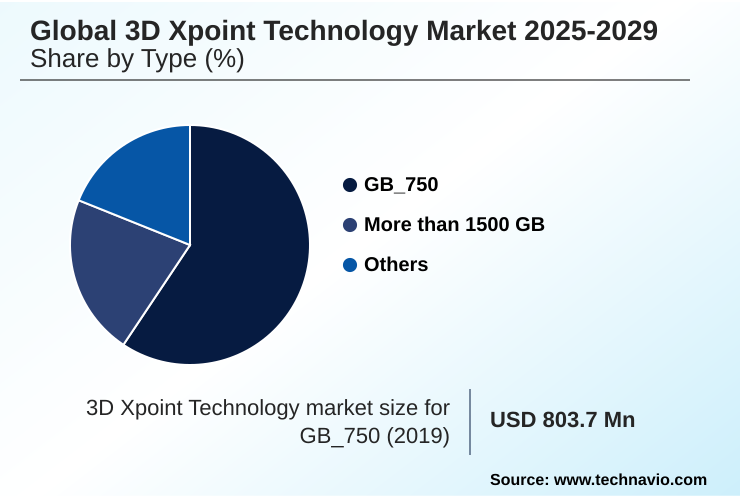
The GB_750 segment was valued at USD 1.15 billion in 2023 and showed a gradual increase during the forecast period.

Request Free Sample

Regional Analysis

North America is estimated to contribute 38.3% to the growth of the global market during the forecast period.Technavio’s analysts have elaborately explained the regional trends and drivers that shape the market during the forecast period.

See How 3D Xpoint Technology Market Demand is Rising in North America Request Free Sample

The geographic landscape of the market is led by North America, which is projected to contribute 38.3% of the incremental growth.

This dominance is fueled by a robust ecosystem of hyperscale data centers, advanced research in AI, and high adoption in the financial sector.

In this region, high-frequency trading platforms have seen latency reductions of up to 15% by integrating persistent memory. APAC is the fastest-growing region, driven by massive investments in 5G, data center infrastructure, and manufacturing automation, particularly in China and India.

Europe shows steady adoption, focused on industrial applications and HPC, with Germany's Industry 4.0 initiatives leveraging the technology for real-time control in smart factories.

The use of memory pooling techniques and advanced packaging technologies is becoming more prevalent globally, supporting broader adoption across diverse applications such as in-vehicle infotainment and customer relationship management systems.

Market Dynamics

Our researchers analyzed the data with 2024 as the base year, along with the key drivers, trends, and challenges. A holistic analysis of drivers will help companies refine their marketing strategies to gain a competitive advantage.

  • The global 3D Xpoint technology market is evolving to meet sophisticated demands for high-performance persistent memory for AI and low latency storage for edge computing. Enterprises are implementing memory tiering strategies in data centers to accelerate workflows, with a notable focus on persistent memory for real-time analytics. In financial services, 3D XPoint for high-frequency trading is becoming a key differentiator.
  • The technology's unique crosspoint array for in-memory databases enables businesses to optimize databases with persistent memory, significantly improving performance. This is critical as organizations focus on reducing latency with memory-centric computing. The enterprise SSD for data center applications continues to be a major segment, while hybrid memory architectures for HPC are gaining traction for complex computational tasks.
  • Solutions like NVMe-oF for networked storage latency are also shaping the competitive environment. The rise of advanced memory for software-defined vehicles highlights a key growth vector, alongside the need for resilient memory for industrial IoT.
  • In one business function, supply chain logistics platforms that integrated these advanced memory solutions reported a 20% improvement in real-time inventory tracking accuracy compared to legacy systems.
  • This demonstrates the tangible benefits of accelerating analytics with persistent memory and using high endurance memory for data logging, which enables real-time decision-making with low latency memory and secure data processing in edge devices, ultimately improving query response times with 3d xpoint.

What are the key market drivers leading to the rise in the adoption of 3D Xpoint Technology Industry?

  • The market is primarily driven by the escalating demand for high-performance computing and data-intensive applications that require memory technologies capable of bridging the performance gap between DRAM and NAND flash.

  • The escalating demand for high-performance computing (HPC) and data-intensive applications is a primary driver for the market. Modern environments, including AI, machine learning, and real-time analytics, face performance bottlenecks with traditional memory hierarchies.
  • Persistent memory solutions bridge this gap by offering significantly lower latency than NAND and higher density than DRAM.
  • In financial services, firms leverage this technology to accelerate real-time fraud detection and high-frequency trading platforms, where it can reduce data access latency by over 50%. This advantage is crucial for processing large transactional datasets.
  • Furthermore, advancements in scientific research and engineering simulations increasingly rely on HPC clusters enhanced with persistent memory to handle complex calculations.
  • The sheer volume and velocity of data in these applications underscore the critical need for memory technologies that can keep pace with demanding computational requirements in scientific research simulations.

What are the market trends shaping the 3D Xpoint Technology Industry?

  • A significant trend influencing the market is the increasing integration with artificial intelligence and machine learning workloads, which demand memory solutions offering high bandwidth, low latency, and persistence.

  • A significant trend shaping the market is the evolution of memory tiering strategies and the adoption of composable infrastructure. As workloads diversify, traditional two-tier memory architectures are proving insufficient, driving demand for persistent memory solutions to bridge performance gaps. Enterprises are implementing sophisticated memory tiering that improves application performance by over 30%.
  • This optimization, which leverages DRAM-like speed, also enhances real-time analytics. Composable infrastructure provides an ideal environment, enabling flexible provisioning of memory resources for applications like in-memory databases and high-performance computing.
  • This shift toward memory-centric computing, particularly for AI model training, is supported by ongoing developments in operating systems and hypervisors, which are making it easier to leverage new memory tiers and accelerate integration into enterprise IT. These advancements reduce reliance on constant cloud connectivity, enhancing responsiveness by 25% in certain edge AI applications.

What challenges does the 3D Xpoint Technology Industry face during its growth?

  • A key challenge affecting industry growth is the technology's high cost and the difficulty in articulating a clear value proposition against more established and cost-effective alternatives like NAND flash.

  • A foremost challenge for the market is its high cost compared to established alternatives like NAND flash, with the price per gigabyte being up to three times higher in some cases. This creates a significant adoption barrier, especially for cost-sensitive applications.
  • While the performance benefits for high-performance computing and real-time analytics are clear, many general-purpose workloads do not fully saturate the technology's capabilities, making the investment difficult to justify. The continuous advancements in NAND flash technology, offering increasing densities at a lower cost, further pressure the price-performance ratio.
  • Moreover, the ecosystem requires specialized software optimization to fully leverage persistent memory, which can increase implementation costs by 15-20%. This need for a clear, quantifiable advantage that justifies the premium price remains a critical hurdle for market penetration beyond specialized, performance-critical applications like autonomous driving systems.

Exclusive Technavio Analysis on Customer Landscape

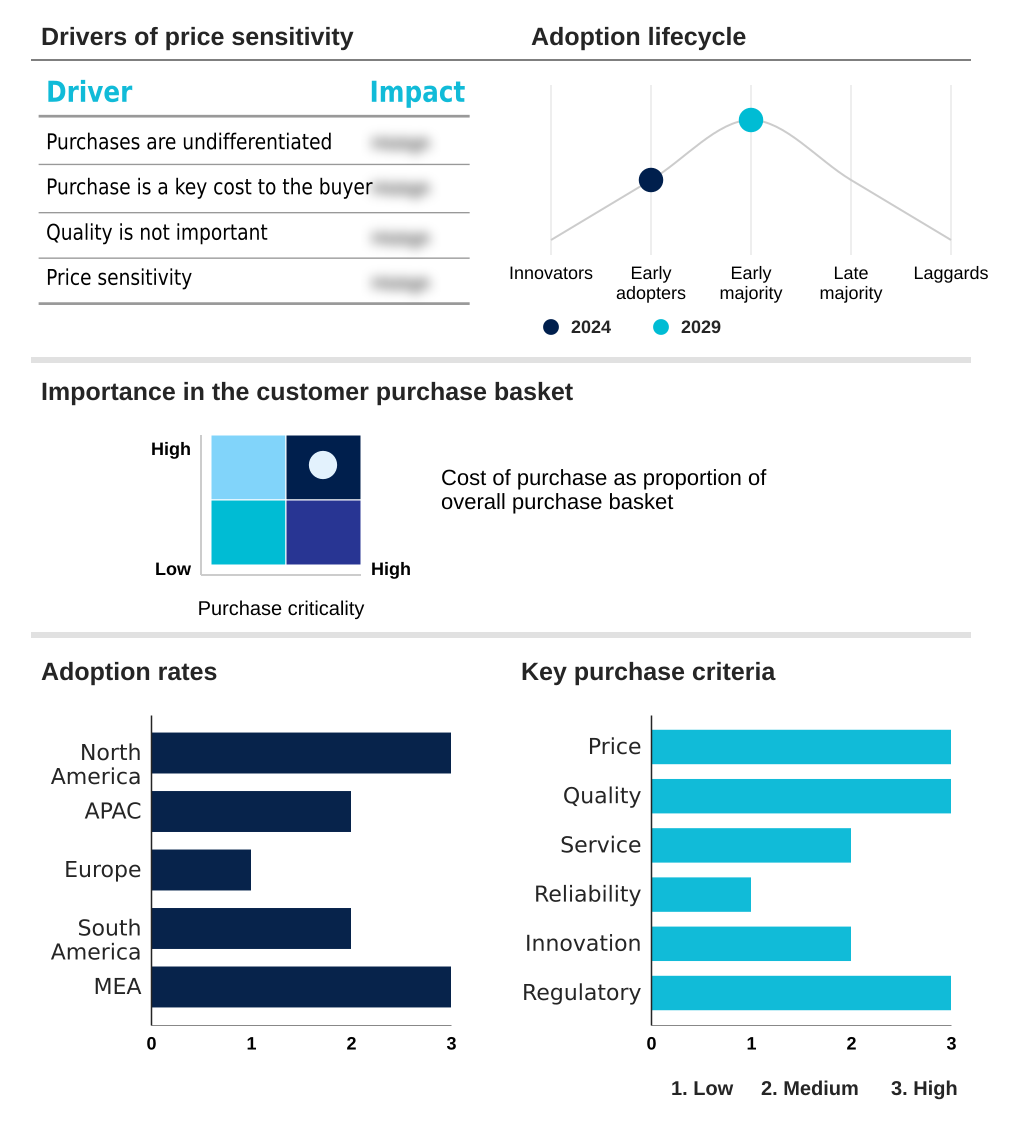
The 3d xpoint technology market forecasting report includes the adoption lifecycle of the market, covering from the innovator’s stage to the laggard’s stage. It focuses on adoption rates in different regions based on penetration. Furthermore, the 3d xpoint technology market report also includes key purchase criteria and drivers of price sensitivity to help companies evaluate and develop their market growth analysis strategies.

Customer Landscape of 3D Xpoint Technology Industry

Competitive Landscape

Companies are implementing various strategies, such as strategic alliances, 3d xpoint technology market forecast, partnerships, mergers and acquisitions, geographical expansion, and product/service launches, to enhance their presence in the industry.

Broadcom Inc. - Key offerings focus on high-speed non-volatile memory solutions, including controller chips and integrated server storage, engineered for superior endurance and low-latency access in data centers.

The industry research and growth report includes detailed analyses of the competitive landscape of the market and information about key companies, including:

  • Broadcom Inc.
  • CrossBar Inc.
  • Dell Technologies Inc.
  • Everspin Technologies Inc.
  • Hewlett Packard
  • IBM Corp.
  • Kingston Technology Co. Inc.
  • Lenovo Group Ltd.
  • NetApp Inc.
  • Phison Electronics Corp.
  • Pure Storage Inc.
  • Samsung Electronics Co. Ltd.
  • Silicon Motion Technology Corp.
  • SK hynix Co. Ltd.
  • Super Micro Computer Inc.
  • Viking Technology
  • Western Digital Corp

Qualitative and quantitative analysis of companies has been conducted to help clients understand the wider business environment as well as the strengths and weaknesses of key industry players. Data is qualitatively analyzed to categorize companies as pure play, category-focused, industry-focused, and diversified; it is quantitatively analyzed to categorize companies as dominant, leading, strong, tentative, and weak.

Recent Development and News in 3d xpoint technology market

  • In August 2024, Broadcom Inc. announced the release of its next-generation controller chip designed to optimize 3D XPoint technology for high-throughput AI storage systems, increasing data pipeline efficiency by 30%.
  • In November 2024, Dell Technologies Inc. launched a new line of PowerEdge servers featuring integrated 3D XPoint technology as a standard option, targeting enterprise analytics and real-time database workloads.
  • In February 2025, SK hynix Co. Ltd. formed a strategic partnership with a leading cloud service provider to deploy its 3DVXP persistent memory solutions in next-generation data centers, focusing on DRAM-NAND hybrid applications for AI.
  • In May 2025, Hewlett Packard Enterprise announced an expansion of its GreenLake for HPC portfolio, incorporating server persistent memory in ProLiant systems to accelerate scientific research and AI model training for enterprise clients.

Dive into Technavio’s robust research methodology, blending expert interviews, extensive data synthesis, and validated models for unparalleled 3D Xpoint Technology Market insights. See full methodology.

Market Scope
Page number 307
Base year 2024
Historic period 2019-2023
Forecast period 2025-2029
Growth momentum & CAGR Accelerate at a CAGR of 12.3%
Market growth 2025-2029 USD 1723.2 million
Market structure Fragmented
YoY growth 2024-2025(%) 11.5%
Key countries US, Canada, Mexico, China, India, Japan, Australia, South Korea, Indonesia, Germany, UK, France, The Netherlands, Italy, Spain, Brazil, Argentina, Colombia, South Africa, UAE, Saudi Arabia, Israel and Turkey
Competitive landscape Leading Companies, Market Positioning of Companies, Competitive Strategies, and Industry Risks

Request Free Sample

Research Analyst Overview

  • The 3D Xpoint Technology market is characterized by its unique position as a high-performance, nonvolatile memory solution that bridges the critical gap between DRAM and NAND. Its crosspoint array structure enables DRAM-like speed and NAND-like persistence, making it integral to memory tiering strategies within modern data centers.
  • The technology's adoption is driven by the demands of data-intensive workloads in sectors requiring low latency memory and high endurance memory. A key trend is its integration into composable infrastructure and memory-centric computing paradigms, which is influencing boardroom-level budgeting for IT modernization.
  • For instance, enterprises are reallocating funds toward systems with persistent memory solutions after seeing demonstrations of a 40% reduction in data processing times for analytics workloads. The ecosystem continues to evolve with advancements in persistent memory programming and software-defined memory.
  • While competition from emerging nonvolatile memory like MRAM and ReRAM exists, the ongoing development of advanced packaging technologies and disaggregated memory architectures reinforces its role in future computing.

What are the Key Data Covered in this 3D Xpoint Technology Market Research and Growth Report?

  • What is the expected growth of the 3D Xpoint Technology Market between 2025 and 2029?

    • USD 1.72 billion, at a CAGR of 12.3%

  • What segmentation does the market report cover?

    • The report is segmented by Type (GB_750, More than 1500 GB, and Others), Application (Telecommunication, Consumer electronics, Automotive, Healthcare, and Others), End-user (Data centers, IT and telecommunication, Automotive, Healthcare, and Others) and Geography (North America, APAC, Europe, South America, Middle East and Africa)

  • Which regions are analyzed in the report?

    • North America, APAC, Europe, South America and Middle East and Africa

  • What are the key growth drivers and market challenges?

    • Increasing demand for high-performance computing and data-intensive applications, High cost and value proposition versus established alternatives

  • Who are the major players in the 3D Xpoint Technology Market?

    • Broadcom Inc., CrossBar Inc., Dell Technologies Inc., Everspin Technologies Inc., Hewlett Packard, IBM Corp., Kingston Technology Co. Inc., Lenovo Group Ltd., NetApp Inc., Phison Electronics Corp., Pure Storage Inc., Samsung Electronics Co. Ltd., Silicon Motion Technology Corp., SK hynix Co. Ltd., Super Micro Computer Inc., Viking Technology and Western Digital Corp

Market Research Insights

  • The market's dynamics are shaped by the critical need for advanced memory solutions in high-performance computing and real-time analytics. Adoption in enterprise resource planning systems has been shown to reduce database query times by up to 40%, directly enhancing operational efficiency.
  • The expansion into edge AI applications and industrial IoT deployments is creating new demand, with persistent memory enabling on-device inference that is 25% faster than cloud-dependent models. Furthermore, its use in scientific research simulations for applications like virtual desktop infrastructure and deep learning platforms accelerates discovery by improving data access speeds.
  • In financial services, high-frequency trading platforms utilizing this technology can achieve latency reductions that provide a measurable competitive edge. This is complemented by its role in intelligent transportation systems and smart city initiatives, where immediate data processing is essential for public safety and operational reliability.

We can help! Our analysts can customize this 3d xpoint technology market research report to meet your requirements.

Get in touch

1. Executive Summary

1.1 Market overview

Executive Summary - Chart on Market Overview
Executive Summary - Data Table on Market Overview
Executive Summary - Chart on Global Market Characteristics
Executive Summary - Chart on Market by Geography
Executive Summary - Chart on Market Segmentation by Type
Executive Summary - Chart on Market Segmentation by Application
Executive Summary - Chart on Market Segmentation by End-user
Executive Summary - Chart on Incremental Growth
Executive Summary - Data Table on Incremental Growth
Executive Summary - Chart on Company Market Positioning

2. Technavio Analysis

2.1 Analysis of price sensitivity, lifecycle, customer purchase basket, adoption rates, and purchase criteria

2.2 Criticality of inputs and Factors of differentiation

Chart on Overview on criticality of inputs and factors of differentiation

2.3 Factors of disruption

Chart on Overview on factors of disruption

2.4 Impact of drivers and challenges

Chart on Impact of drivers and challenges in 2024 and 2029

3. Market Landscape

3.1 Market ecosystem

Chart on Parent Market
Data Table on - Parent Market

3.2 Market characteristics

Chart on Market characteristics analysis

3.3 Value chain analysis

Chart on Value chain analysis

4. Market Sizing

4.1 Market definition

Data Table on Offerings of companies included in the market definition

4.2 Market segment analysis

Market segments

4.3 Market size 2024

4.4 Market outlook: Forecast for 2024-2029

Chart on Global - Market size and forecast 2024-2029 ($ million)
Data Table on Global - Market size and forecast 2024-2029 ($ million)
Chart on Global Market: Year-over-year growth 2024-2029 (%)
Data Table on Global Market: Year-over-year growth 2024-2029 (%)

5. Historic Market Size

5.1 Global 3D Xpoint Technology Market 2019 - 2023

Historic Market Size - Data Table on Global 3D Xpoint Technology Market 2019 - 2023 ($ million)

5.2 Type segment analysis 2019 - 2023

Historic Market Size - Type Segment 2019 - 2023 ($ million)

5.3 Application segment analysis 2019 - 2023

Historic Market Size - Application Segment 2019 - 2023 ($ million)

5.4 End-user segment analysis 2019 - 2023

Historic Market Size - End-user Segment 2019 - 2023 ($ million)

5.5 Geography segment analysis 2019 - 2023

Historic Market Size - Geography Segment 2019 - 2023 ($ million)

5.6 Country segment analysis 2019 - 2023

Historic Market Size - Country Segment 2019 - 2023 ($ million)

6. Five Forces Analysis

6.1 Five forces summary

Five forces analysis - Comparison between 2024 and 2029

6.2 Bargaining power of buyers

Bargaining power of buyers - Impact of key factors 2024 and 2029

6.3 Bargaining power of suppliers

Bargaining power of suppliers - Impact of key factors in 2024 and 2029

6.4 Threat of new entrants

Threat of new entrants - Impact of key factors in 2024 and 2029

6.5 Threat of substitutes

Threat of substitutes - Impact of key factors in 2024 and 2029

6.6 Threat of rivalry

Threat of rivalry - Impact of key factors in 2024 and 2029

6.7 Market condition

Chart on Market condition - Five forces 2024 and 2029

7. Market Segmentation by Type

7.1 Market segments

Chart on Type - Market share 2024-2029 (%)
Data Table on Type - Market share 2024-2029 (%)

7.2 Comparison by Type

Chart on Comparison by Type
Data Table on Comparison by Type

7.3 GB_750 - Market size and forecast 2024-2029

Chart on GB_750 - Market size and forecast 2024-2029 ($ million)
Data Table on GB_750 - Market size and forecast 2024-2029 ($ million)
Chart on GB_750 - Year-over-year growth 2024-2029 (%)
Data Table on GB_750 - Year-over-year growth 2024-2029 (%)

7.4 More than 1500 GB - Market size and forecast 2024-2029

Chart on More than 1500 GB - Market size and forecast 2024-2029 ($ million)
Data Table on More than 1500 GB - Market size and forecast 2024-2029 ($ million)
Chart on More than 1500 GB - Year-over-year growth 2024-2029 (%)
Data Table on More than 1500 GB - Year-over-year growth 2024-2029 (%)

7.5 Others - Market size and forecast 2024-2029

Chart on Others - Market size and forecast 2024-2029 ($ million)
Data Table on Others - Market size and forecast 2024-2029 ($ million)
Chart on Others - Year-over-year growth 2024-2029 (%)
Data Table on Others - Year-over-year growth 2024-2029 (%)

7.6 Market opportunity by Type

Market opportunity by Type ($ million)
Data Table on Market opportunity by Type ($ million)

8. Market Segmentation by Application

8.1 Market segments

Chart on Application - Market share 2024-2029 (%)
Data Table on Application - Market share 2024-2029 (%)

8.2 Comparison by Application

Chart on Comparison by Application
Data Table on Comparison by Application

8.3 Telecommunication - Market size and forecast 2024-2029

Chart on Telecommunication - Market size and forecast 2024-2029 ($ million)
Data Table on Telecommunication - Market size and forecast 2024-2029 ($ million)
Chart on Telecommunication - Year-over-year growth 2024-2029 (%)
Data Table on Telecommunication - Year-over-year growth 2024-2029 (%)

8.4 Consumer electronics - Market size and forecast 2024-2029

Chart on Consumer electronics - Market size and forecast 2024-2029 ($ million)
Data Table on Consumer electronics - Market size and forecast 2024-2029 ($ million)
Chart on Consumer electronics - Year-over-year growth 2024-2029 (%)
Data Table on Consumer electronics - Year-over-year growth 2024-2029 (%)

8.5 Automotive - Market size and forecast 2024-2029

Chart on Automotive - Market size and forecast 2024-2029 ($ million)
Data Table on Automotive - Market size and forecast 2024-2029 ($ million)
Chart on Automotive - Year-over-year growth 2024-2029 (%)
Data Table on Automotive - Year-over-year growth 2024-2029 (%)

8.6 Healthcare - Market size and forecast 2024-2029

Chart on Healthcare - Market size and forecast 2024-2029 ($ million)
Data Table on Healthcare - Market size and forecast 2024-2029 ($ million)
Chart on Healthcare - Year-over-year growth 2024-2029 (%)
Data Table on Healthcare - Year-over-year growth 2024-2029 (%)

8.7 Others - Market size and forecast 2024-2029

Chart on Others - Market size and forecast 2024-2029 ($ million)
Data Table on Others - Market size and forecast 2024-2029 ($ million)
Chart on Others - Year-over-year growth 2024-2029 (%)
Data Table on Others - Year-over-year growth 2024-2029 (%)

8.8 Market opportunity by Application

Market opportunity by Application ($ million)
Data Table on Market opportunity by Application ($ million)

9. Market Segmentation by End-user

9.1 Market segments

Chart on End-user - Market share 2024-2029 (%)
Data Table on End-user - Market share 2024-2029 (%)

9.2 Comparison by End-user

Chart on Comparison by End-user
Data Table on Comparison by End-user

9.3 Data centers - Market size and forecast 2024-2029

Chart on Data centers - Market size and forecast 2024-2029 ($ million)
Data Table on Data centers - Market size and forecast 2024-2029 ($ million)
Chart on Data centers - Year-over-year growth 2024-2029 (%)
Data Table on Data centers - Year-over-year growth 2024-2029 (%)

9.4 IT and telecommunication - Market size and forecast 2024-2029

Chart on IT and telecommunication - Market size and forecast 2024-2029 ($ million)
Data Table on IT and telecommunication - Market size and forecast 2024-2029 ($ million)
Chart on IT and telecommunication - Year-over-year growth 2024-2029 (%)
Data Table on IT and telecommunication - Year-over-year growth 2024-2029 (%)

9.5 Automotive - Market size and forecast 2024-2029

Chart on Automotive - Market size and forecast 2024-2029 ($ million)
Data Table on Automotive - Market size and forecast 2024-2029 ($ million)
Chart on Automotive - Year-over-year growth 2024-2029 (%)
Data Table on Automotive - Year-over-year growth 2024-2029 (%)

9.6 Healthcare - Market size and forecast 2024-2029

Chart on Healthcare - Market size and forecast 2024-2029 ($ million)
Data Table on Healthcare - Market size and forecast 2024-2029 ($ million)
Chart on Healthcare - Year-over-year growth 2024-2029 (%)
Data Table on Healthcare - Year-over-year growth 2024-2029 (%)

9.7 Others - Market size and forecast 2024-2029

Chart on Others - Market size and forecast 2024-2029 ($ million)
Data Table on Others - Market size and forecast 2024-2029 ($ million)
Chart on Others - Year-over-year growth 2024-2029 (%)
Data Table on Others - Year-over-year growth 2024-2029 (%)

9.8 Market opportunity by End-user

Market opportunity by End-user ($ million)
Data Table on Market opportunity by End-user ($ million)

10. Customer Landscape

10.1 Customer landscape overview

Analysis of price sensitivity, lifecycle, customer purchase basket, adoption rates, and purchase criteria

11. Geographic Landscape

11.1 Geographic segmentation

Chart on Market share by geography 2024-2029 (%)
Data Table on Market share by geography 2024-2029 (%)

11.2 Geographic comparison

Chart on Geographic comparison
Data Table on Geographic comparison

11.3 North America - Market size and forecast 2024-2029

Chart on North America - Market size and forecast 2024-2029 ($ million)
Data Table on North America - Market size and forecast 2024-2029 ($ million)
Chart on North America - Year-over-year growth 2024-2029 (%)
Data Table on North America - Year-over-year growth 2024-2029 (%)
Chart on Regional Comparison - North America
Data Table on Regional Comparison - North America

11.3.1 US - Market size and forecast 2024-2029

Chart on US - Market size and forecast 2024-2029 ($ million)
Data Table on US - Market size and forecast 2024-2029 ($ million)
Chart on US - Year-over-year growth 2024-2029 (%)
Data Table on US - Year-over-year growth 2024-2029 (%)

11.3.2 Canada - Market size and forecast 2024-2029

Chart on Canada - Market size and forecast 2024-2029 ($ million)
Data Table on Canada - Market size and forecast 2024-2029 ($ million)
Chart on Canada - Year-over-year growth 2024-2029 (%)
Data Table on Canada - Year-over-year growth 2024-2029 (%)

11.3.3 Mexico - Market size and forecast 2024-2029

Chart on Mexico - Market size and forecast 2024-2029 ($ million)
Data Table on Mexico - Market size and forecast 2024-2029 ($ million)
Chart on Mexico - Year-over-year growth 2024-2029 (%)
Data Table on Mexico - Year-over-year growth 2024-2029 (%)

11.4 APAC - Market size and forecast 2024-2029

Chart on APAC - Market size and forecast 2024-2029 ($ million)
Data Table on APAC - Market size and forecast 2024-2029 ($ million)
Chart on APAC - Year-over-year growth 2024-2029 (%)
Data Table on APAC - Year-over-year growth 2024-2029 (%)
Chart on Regional Comparison - APAC
Data Table on Regional Comparison - APAC

11.4.1 China - Market size and forecast 2024-2029

Chart on China - Market size and forecast 2024-2029 ($ million)
Data Table on China - Market size and forecast 2024-2029 ($ million)
Chart on China - Year-over-year growth 2024-2029 (%)
Data Table on China - Year-over-year growth 2024-2029 (%)

11.4.2 India - Market size and forecast 2024-2029

Chart on India - Market size and forecast 2024-2029 ($ million)
Data Table on India - Market size and forecast 2024-2029 ($ million)
Chart on India - Year-over-year growth 2024-2029 (%)
Data Table on India - Year-over-year growth 2024-2029 (%)

11.4.3 Japan - Market size and forecast 2024-2029

Chart on Japan - Market size and forecast 2024-2029 ($ million)
Data Table on Japan - Market size and forecast 2024-2029 ($ million)
Chart on Japan - Year-over-year growth 2024-2029 (%)
Data Table on Japan - Year-over-year growth 2024-2029 (%)

11.4.4 Australia - Market size and forecast 2024-2029

Chart on Australia - Market size and forecast 2024-2029 ($ million)
Data Table on Australia - Market size and forecast 2024-2029 ($ million)
Chart on Australia - Year-over-year growth 2024-2029 (%)
Data Table on Australia - Year-over-year growth 2024-2029 (%)

11.4.5 South Korea - Market size and forecast 2024-2029

Chart on South Korea - Market size and forecast 2024-2029 ($ million)
Data Table on South Korea - Market size and forecast 2024-2029 ($ million)
Chart on South Korea - Year-over-year growth 2024-2029 (%)
Data Table on South Korea - Year-over-year growth 2024-2029 (%)

11.4.6 Indonesia - Market size and forecast 2024-2029

Chart on Indonesia - Market size and forecast 2024-2029 ($ million)
Data Table on Indonesia - Market size and forecast 2024-2029 ($ million)
Chart on Indonesia - Year-over-year growth 2024-2029 (%)
Data Table on Indonesia - Year-over-year growth 2024-2029 (%)

11.5 Europe - Market size and forecast 2024-2029

Chart on Europe - Market size and forecast 2024-2029 ($ million)
Data Table on Europe - Market size and forecast 2024-2029 ($ million)
Chart on Europe - Year-over-year growth 2024-2029 (%)
Data Table on Europe - Year-over-year growth 2024-2029 (%)
Chart on Regional Comparison - Europe
Data Table on Regional Comparison - Europe

11.5.1 Germany - Market size and forecast 2024-2029

Chart on Germany - Market size and forecast 2024-2029 ($ million)
Data Table on Germany - Market size and forecast 2024-2029 ($ million)
Chart on Germany - Year-over-year growth 2024-2029 (%)
Data Table on Germany - Year-over-year growth 2024-2029 (%)

11.5.2 UK - Market size and forecast 2024-2029

Chart on UK - Market size and forecast 2024-2029 ($ million)
Data Table on UK - Market size and forecast 2024-2029 ($ million)
Chart on UK - Year-over-year growth 2024-2029 (%)
Data Table on UK - Year-over-year growth 2024-2029 (%)

11.5.3 France - Market size and forecast 2024-2029

Chart on France - Market size and forecast 2024-2029 ($ million)
Data Table on France - Market size and forecast 2024-2029 ($ million)
Chart on France - Year-over-year growth 2024-2029 (%)
Data Table on France - Year-over-year growth 2024-2029 (%)

11.5.4 The Netherlands - Market size and forecast 2024-2029

Chart on The Netherlands - Market size and forecast 2024-2029 ($ million)
Data Table on The Netherlands - Market size and forecast 2024-2029 ($ million)
Chart on The Netherlands - Year-over-year growth 2024-2029 (%)
Data Table on The Netherlands - Year-over-year growth 2024-2029 (%)

11.5.5 Italy - Market size and forecast 2024-2029

Chart on Italy - Market size and forecast 2024-2029 ($ million)
Data Table on Italy - Market size and forecast 2024-2029 ($ million)
Chart on Italy - Year-over-year growth 2024-2029 (%)
Data Table on Italy - Year-over-year growth 2024-2029 (%)

11.5.6 Spain - Market size and forecast 2024-2029

Chart on Spain - Market size and forecast 2024-2029 ($ million)
Data Table on Spain - Market size and forecast 2024-2029 ($ million)
Chart on Spain - Year-over-year growth 2024-2029 (%)
Data Table on Spain - Year-over-year growth 2024-2029 (%)

11.6 South America - Market size and forecast 2024-2029

Chart on South America - Market size and forecast 2024-2029 ($ million)
Data Table on South America - Market size and forecast 2024-2029 ($ million)
Chart on South America - Year-over-year growth 2024-2029 (%)
Data Table on South America - Year-over-year growth 2024-2029 (%)
Chart on Regional Comparison - South America
Data Table on Regional Comparison - South America

11.6.1 Brazil - Market size and forecast 2024-2029

Chart on Brazil - Market size and forecast 2024-2029 ($ million)
Data Table on Brazil - Market size and forecast 2024-2029 ($ million)
Chart on Brazil - Year-over-year growth 2024-2029 (%)
Data Table on Brazil - Year-over-year growth 2024-2029 (%)

11.6.2 Argentina - Market size and forecast 2024-2029

Chart on Argentina - Market size and forecast 2024-2029 ($ million)
Data Table on Argentina - Market size and forecast 2024-2029 ($ million)
Chart on Argentina - Year-over-year growth 2024-2029 (%)
Data Table on Argentina - Year-over-year growth 2024-2029 (%)

11.6.3 Colombia - Market size and forecast 2024-2029

Chart on Colombia - Market size and forecast 2024-2029 ($ million)
Data Table on Colombia - Market size and forecast 2024-2029 ($ million)
Chart on Colombia - Year-over-year growth 2024-2029 (%)
Data Table on Colombia - Year-over-year growth 2024-2029 (%)

11.7 Middle East and Africa - Market size and forecast 2024-2029

Chart on Middle East and Africa - Market size and forecast 2024-2029 ($ million)
Data Table on Middle East and Africa - Market size and forecast 2024-2029 ($ million)
Chart on Middle East and Africa - Year-over-year growth 2024-2029 (%)
Data Table on Middle East and Africa - Year-over-year growth 2024-2029 (%)
Chart on Regional Comparison - Middle East and Africa
Data Table on Regional Comparison - Middle East and Africa

11.7.1 South Africa - Market size and forecast 2024-2029

Chart on South Africa - Market size and forecast 2024-2029 ($ million)
Data Table on South Africa - Market size and forecast 2024-2029 ($ million)
Chart on South Africa - Year-over-year growth 2024-2029 (%)
Data Table on South Africa - Year-over-year growth 2024-2029 (%)

11.7.2 UAE - Market size and forecast 2024-2029

Chart on UAE - Market size and forecast 2024-2029 ($ million)
Data Table on UAE - Market size and forecast 2024-2029 ($ million)
Chart on UAE - Year-over-year growth 2024-2029 (%)
Data Table on UAE - Year-over-year growth 2024-2029 (%)

11.7.3 Saudi Arabia - Market size and forecast 2024-2029

Chart on Saudi Arabia - Market size and forecast 2024-2029 ($ million)
Data Table on Saudi Arabia - Market size and forecast 2024-2029 ($ million)
Chart on Saudi Arabia - Year-over-year growth 2024-2029 (%)
Data Table on Saudi Arabia - Year-over-year growth 2024-2029 (%)

11.7.4 Israel - Market size and forecast 2024-2029

Chart on Israel - Market size and forecast 2024-2029 ($ million)
Data Table on Israel - Market size and forecast 2024-2029 ($ million)
Chart on Israel - Year-over-year growth 2024-2029 (%)
Data Table on Israel - Year-over-year growth 2024-2029 (%)

11.7.5 Turkey - Market size and forecast 2024-2029

Chart on Turkey - Market size and forecast 2024-2029 ($ million)
Data Table on Turkey - Market size and forecast 2024-2029 ($ million)
Chart on Turkey - Year-over-year growth 2024-2029 (%)
Data Table on Turkey - Year-over-year growth 2024-2029 (%)

11.8 Market opportunity by geography

Market opportunity by geography ($ million)
Data Tables on Market opportunity by geography ($ million)

12. Drivers, Challenges, and Opportunity

12.1 Market drivers

Increasing demand for high-performance computing and data-intensive applications
Growth of edge computing and 5G networks
Evolving memory hierarchy architectures and composable infrastructure

12.2 Market challenges

High cost and value proposition versus established alternatives
Limited ecosystem support and developer adoption
Intense competition from evolving memory and storage technologies

12.3 Impact of drivers and challenges

Impact of drivers and challenges in 2024 and 2029

12.4 Market opportunities

Integration with AI and machine learning workloads
Evolution of memory tiering and composable infrastructure
Expansion in edge computing and IoT applications

13. Competitive Landscape

13.1 Overview

13.2

Overview on criticality of inputs and factors of differentiation

13.3 Landscape disruption

Overview on factors of disruption

13.4 Industry risks

Impact of key risks on business

14. Competitive Analysis

14.1 Companies profiled

Companies covered

14.2 Company ranking index

14.3 Market positioning of companies

Matrix on companies position and classification

14.4 Broadcom Inc.

Broadcom Inc. - Overview
Broadcom Inc. - Business segments
Broadcom Inc. - Key news
Broadcom Inc. - Key offerings
Broadcom Inc. - Segment focus
SWOT

14.5 Dell Technologies Inc.

Dell Technologies Inc. - Overview
Dell Technologies Inc. - Business segments
Dell Technologies Inc. - Key news
Dell Technologies Inc. - Key offerings
Dell Technologies Inc. - Segment focus
SWOT

14.6 Everspin Technologies Inc.

Everspin Technologies Inc. - Overview
Everspin Technologies Inc. - Product / Service
Everspin Technologies Inc. - Key news
Everspin Technologies Inc. - Key offerings
SWOT

14.7 Hewlett Packard

Hewlett Packard - Overview
Hewlett Packard - Business segments
Hewlett Packard - Key news
Hewlett Packard - Key offerings
Hewlett Packard - Segment focus
SWOT

14.8 IBM Corp.

IBM Corp. - Overview
IBM Corp. - Business segments
IBM Corp. - Key news
IBM Corp. - Key offerings
IBM Corp. - Segment focus
SWOT

14.9 Kingston Technology Co. Inc.

Kingston Technology Co. Inc. - Overview
Kingston Technology Co. Inc. - Product / Service
Kingston Technology Co. Inc. - Key offerings
SWOT

14.10 Lenovo Group Ltd.

Lenovo Group Ltd. - Overview
Lenovo Group Ltd. - Business segments
Lenovo Group Ltd. - Key news
Lenovo Group Ltd. - Key offerings
Lenovo Group Ltd. - Segment focus
SWOT

14.11 NetApp Inc.

NetApp Inc. - Overview
NetApp Inc. - Product / Service
NetApp Inc. - Key news
NetApp Inc. - Key offerings
SWOT

14.12 Phison Electronics Corp.

Phison Electronics Corp. - Overview
Phison Electronics Corp. - Product / Service
Phison Electronics Corp. - Key offerings
SWOT

14.13 Pure Storage Inc.

Pure Storage Inc. - Overview
Pure Storage Inc. - Product / Service
Pure Storage Inc. - Key news
Pure Storage Inc. - Key offerings
SWOT

14.14 Samsung Electronics Co. Ltd.

Samsung Electronics Co. Ltd. - Overview
Samsung Electronics Co. Ltd. - Business segments
Samsung Electronics Co. Ltd. - Key news
Samsung Electronics Co. Ltd. - Key offerings
Samsung Electronics Co. Ltd. - Segment focus
SWOT

14.15 Silicon Motion Technology Corp.

Silicon Motion Technology Corp. - Overview
Silicon Motion Technology Corp. - Product / Service
Silicon Motion Technology Corp. - Key offerings
SWOT

14.16 SK hynix Co. Ltd.

SK hynix Co. Ltd. - Overview
SK hynix Co. Ltd. - Product / Service
SK hynix Co. Ltd. - Key news
SK hynix Co. Ltd. - Key offerings
SWOT

14.17 Super Micro Computer Inc.

Super Micro Computer Inc. - Overview
Super Micro Computer Inc. - Business segments
Super Micro Computer Inc. - Key news
Super Micro Computer Inc. - Key offerings
Super Micro Computer Inc. - Segment focus
SWOT

14.18 Western Digital Corp

Western Digital Corp - Overview
Western Digital Corp - Business segments
Western Digital Corp - Key offerings
Western Digital Corp - Segment focus
SWOT

15. Appendix

15.1 Scope of the report

Market definition
Objectives
Notes and caveats

15.2 Inclusions and exclusions checklist

Inclusions checklist
Exclusions checklist

15.3 Currency conversion rates for US$

15.4 Research methodology

15.5 Data procurement

Information sources

15.6 Data validation

15.7 Validation techniques employed for market sizing

15.8 Data synthesis

15.9 360 degree market analysis

15.10 List of abbreviations

Research Methodology

Technavio presents a detailed picture of the market by way of study, synthesis, and summation of data from multiple sources. The analysts have presented the various facets of the market with a particular focus on identifying the key industry influencers. The data thus presented is comprehensive, reliable, and the result of extensive research, both primary and secondary.

INFORMATION SOURCES

Primary sources

  • Manufacturers and suppliers
  • Channel partners
  • Industry experts
  • Strategic decision makers

Secondary sources

  • Industry journals and periodicals
  • Government data
  • Financial reports of key industry players
  • Historical data
  • Press releases

DATA ANALYSIS

Data Synthesis

  • Collation of data
  • Estimation of key figures
  • Analysis of derived insights

Data Validation

  • Triangulation with data models
  • Reference against proprietary databases
  • Corroboration with industry experts

REPORT WRITING

Qualitative

  • Market drivers
  • Market challenges
  • Market trends
  • Five forces analysis

Quantitative

  • Market size and forecast
  • Market segmentation
  • Geographical insights
  • Competitive landscape

Interested in this report?

Get your sample now to see our research methodology and insights!

Download Now

Frequently Asked Questions

3D Xpoint Technology market growth will increase by USD 1723.2 million during 2025-2029.

The 3D Xpoint Technology market is expected to grow at a CAGR of 12.3% during 2025-2029.

3D Xpoint Technology market is segmented by Type (GB_750, More than 1500 GB, Others) Application (Telecommunication, Consumer electronics, Automotive, Healthcare, Others) End-user (Data centers, IT and telecommunication, Automotive, Healthcare, Others)

Broadcom Inc., CrossBar Inc., Dell Technologies Inc., Everspin Technologies Inc., Hewlett Packard, IBM Corp., Kingston Technology Co. Inc., Lenovo Group Ltd., NetApp Inc., Phison Electronics Corp., Pure Storage Inc., Samsung Electronics Co. Ltd., Silicon Motion Technology Corp., SK hynix Co. Ltd., Super Micro Computer Inc., Viking Technology, Western Digital Corp are a few of the key vendors in the 3D Xpoint Technology market.

North America will register the highest growth rate of 38.3% among the other regions. Therefore, the 3D Xpoint Technology market in North America is expected to garner significant business opportunities for the vendors during the forecast period.

US, Canada, Mexico, China, India, Japan, Australia, South Korea, Indonesia, Germany, UK, France, The Netherlands, Italy, Spain, Brazil, Argentina, Colombia, South Africa, UAE, Saudi Arabia, Israel, Turkey

  • Increasing demand for high-performance computing and data-intensive applications is the driving factor this market.

The 3D Xpoint Technology market vendors should focus on grabbing business opportunities from the Type segment as it accounted for the largest market share in the base year.