
NAND Flash Market Size 2025-2029
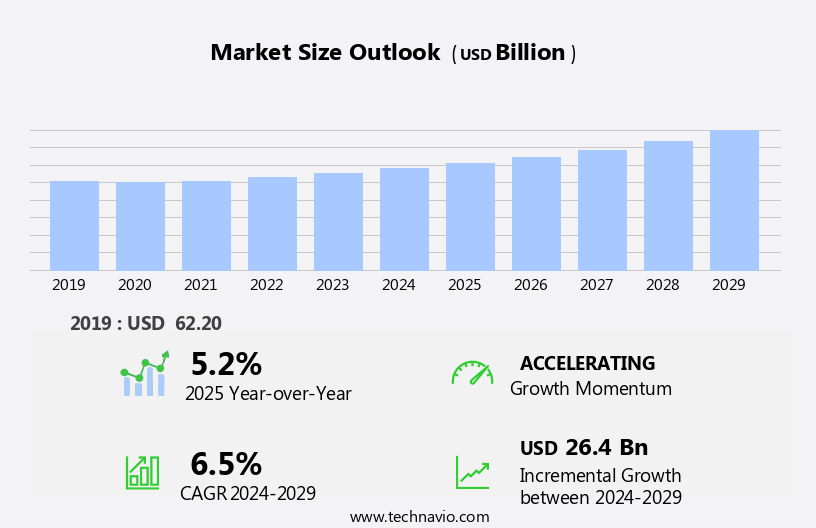
The nand flash market size is forecast to increase by USD 26.4 billion, at a CAGR of 6.5% between 2024 and 2029.
- The market is experiencing significant growth, driven by escalating investments in fabrication facilities to meet the insatiable demand for data storage. This expansion is fueled by the increasing adoption of advanced technologies, such as artificial intelligence and the Internet of Things, which necessitate larger data storage capacities. Furthermore, the market is witnessing a surge in strategic partnerships and acquisitions, as industry leaders seek to broaden their product offerings and strengthen their competitive positions. However, the market is not without challenges.
- Fluctuations in demand and supply, primarily due to seasonal trends and geopolitical tensions, pose a significant threat to market stability. Manufacturers must navigate these challenges by implementing robust supply chain management strategies and diversifying their customer base to mitigate risks. To capitalize on the market's potential, companies must remain agile, innovate, and collaborate to meet the evolving needs of their customers and stay ahead of the competition.
What will be the Size of the NAND Flash Market during the forecast period?
Explore in-depth regional segment analysis with market size data - historical 2019-2023 and forecasts 2025-2029 - in the full report.
Request Free Sample
The market continues to evolve, driven by advancements in technology and expanding applications across various sectors. Memory management techniques, such as block management and garbage collection, are essential for optimizing the performance of NAND Flash memory. Single-level cell (SLC) and multi-level cell (MLC) NAND Flash have given way to triple-level cell (TLC) and quad-level cell (QLC) technologies, offering increased capacity and cost efficiency. 3D NAND and 3D Vertical NAND have revolutionized the industry, enabling higher memory density and reduced power consumption. Emerging memory technologies, such as BICS Flash and floating-gate transistors, are poised to disrupt the market with improved data retention and performance.
Consumer Electronics and data center memory applications are major growth areas for NAND Flash, with increasing demand for high-capacity, low-power solutions. Memory capacity, die size, and memory interface are critical factors influencing market dynamics. USB flash drives and solid-state drives are popular consumer applications, while enterprise storage and data center memory require high-performance, reliable, and cost-effective solutions. Memory performance, data integrity, and data security are essential considerations for NAND Flash users. Memory controller design, error correction code, and memory bandwidth are crucial elements in achieving optimal performance and data reliability. Wafer processing, reliability testing, and failure analysis are ongoing concerns for memory manufacturers, ensuring consistent quality and addressing potential issues.
The memory supply chain, including memory chip fabrication and memory cost, is a complex and dynamic system. Memory research and innovation are essential for staying competitive and meeting the evolving demands of the market. Memory capacity, power consumption, and data storage requirements are driving the development of new technologies and applications. Automotive memory and data backup are emerging applications for NAND Flash, offering opportunities for growth and innovation. Memory cost, data security, and reliability are critical factors in these applications. Memory research and development are ongoing, with a focus on improving memory performance, reducing power consumption, and increasing memory density.
The market is a continuously evolving landscape, with ongoing advancements in technology and expanding applications. Memory capacity, power consumption, and data storage requirements are driving the development of new technologies and applications. Memory management techniques, such as wear leveling and toggle mode, are essential for optimizing performance and extending the life of NAND Flash memory. The market is poised for continued growth, with innovation and collaboration essential for meeting the evolving demands of users.
How is this NAND Flash Industry segmented?
The NAND flash industry research report provides comprehensive data (region-wise segment analysis), with forecasts and estimates in "USD billion" for the period 2025-2029, as well as historical data from 2019-2023 for the following segments.
- Application
- Smartphones
- SSDs
- Memory cards
- Others
- Type
- 3D NAND
- 2D NAND
- Technology
- TLC
- MLC
- SLC
- Geography
- North America
- US
- Europe
- France
- Germany
- Italy
- APAC
- China
- India
- Japan
- Singapore
- South Korea
- Taiwan
- Rest of World (ROW)
- North America
.
By Application Insights
The smartphones segment is estimated to witness significant growth during the forecast period.
The market is experiencing significant growth due to the increasing penetration of the Internet and the widespread adoption of smartphones. The availability of high-speed Internet connectivity and the proliferation of social media platforms are driving the generation of large volumes of data, including audio, video, text, and encrypted data blocks. Consequently, the demand for high-capacity memory modules is on the rise. Social media applications, such as Facebook, WhatsApp, and Instagram, are popular among users, necessitating the storage of vast amounts of data for each user. The popularity of social networking platforms and YouTube, in particular, is fueling the rapid adoption of smartphones worldwide.
NAND Flash memory technology is essential for mobile devices, including smartphones and tablets, due to its high storage capacity, low power consumption, and fast read and write speeds. The market trends include the adoption of 3D NAND, which offers higher storage capacity and improved reliability, and the emergence of emerging memory technologies, such as 3D vertical NAND and QLC NAND. Memory management techniques, such as block management, wear leveling, and garbage collection, are crucial for optimizing memory usage and ensuring data integrity. Memory standards, such as toggle DDR and memory interface, are evolving to support faster data transfer rates and higher memory capacity.
Memory controller technologies, such as flash translation layer and wear leveling algorithms, are essential for managing NAND Flash memory effectively. Memory chip fabrication processes, including thin film deposition and wafer processing, are continually advancing to improve memory density and reduce costs. Memory research and development are ongoing to address challenges, such as data retention, data security, and reliability testing. Memory innovation is crucial to meet the growing demand for high-capacity, low-power, and cost-effective memory solutions. The memory supply chain is also undergoing significant changes, with memory manufacturers and memory controller suppliers collaborating to optimize memory performance and reduce costs.
NAND Flash memory is used in various applications, including data centers, automotive, and consumer electronics. In data centers, NAND Flash memory is used for data storage and backup, while in automotive applications, it is used for infotainment systems, advanced driver assistance systems, and safety features. In consumer electronics, NAND Flash memory is used in solid-state drives, USB flash drives, and mobile devices. The memory market is dynamic, with new technologies and applications continually emerging. Understanding the market dynamics and trends, including memory management techniques, memory standards, memory controller technologies, and emerging memory technologies, is essential for businesses looking to leverage NAND Flash memory for their applications.
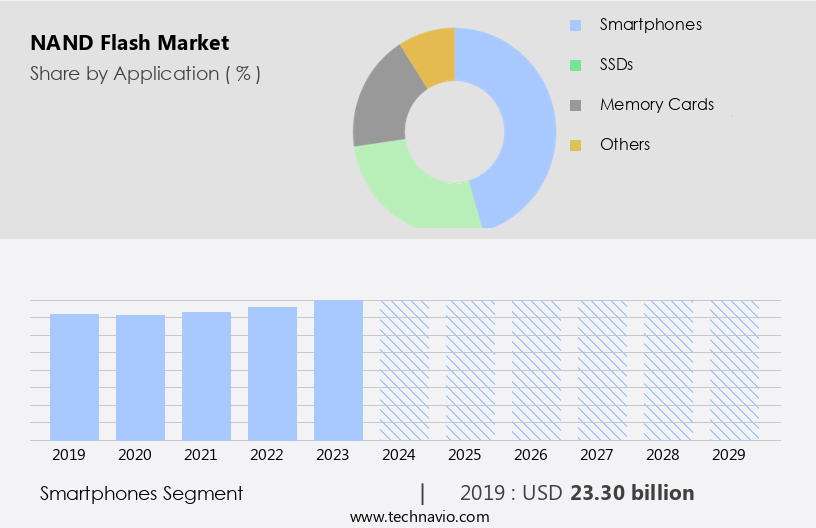
The Smartphones segment was valued at USD 23.30 billion in 2019 and showed a gradual increase during the forecast period.
Regional Analysis
APAC is estimated to contribute 61% to the growth of the global market during the forecast period. Technavio's analysts have elaborately explained the regional trends and drivers that shape the market during the forecast period.
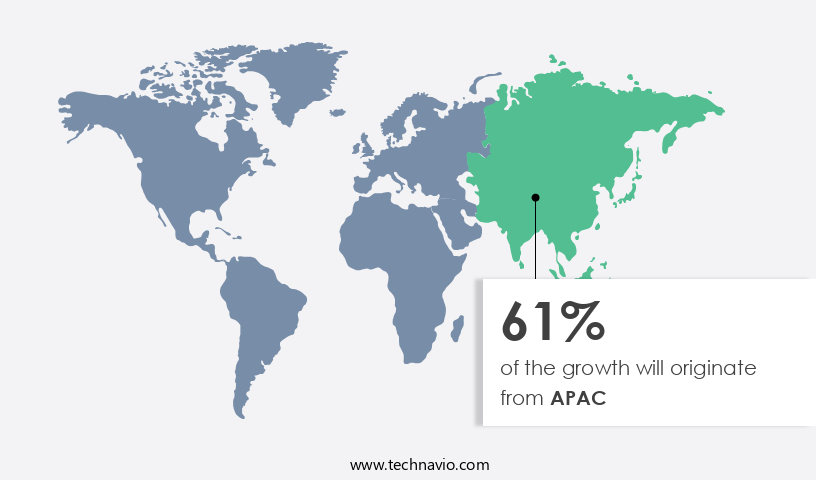
The market is characterized by the dominance of APAC, driven by the presence of numerous consumer electronic device manufacturers. This region's consumer electronics hubs, including China, Japan, South Korea, and Taiwan, significantly contribute to the sales of memory modules, such as NAND flash. The availability of raw materials and relatively low production costs have encouraged companies to establish manufacturing centers in APAC. The region's prominent consumer electronics and mobile device manufacturers, such as Huawei Technologies Co., further strengthen APAC's position in the market. Single-level cell (SLC) and multi-level cell (MLC) NAND technologies dominate the market, with 3D NAND and TLC NAND being the latest advancements.
Embedded memory and memory cards are significant applications of NAND flash. Memory standards, such as toggle DDR, are essential in ensuring compatibility and interoperability. Memory management techniques, including garbage collection and wear leveling, are crucial in maintaining the longevity and performance of NAND flash. Block management and error correction codes contribute to data integrity and reliability. Memory research and innovation continue to drive the market, with emerging memory technologies, such as 3D vertical NAND and QLC NAND, promising increased capacity and performance. Operating temperature and data retention are essential factors in NAND flash memory management. Memory cost, power consumption, and memory capacity are critical market trends.
Solid state drives (SSDs) and enterprise storage solutions are significant markets for NAND flash. NAND flash memory is also used in data centers, automotive applications, and consumer electronics. Memory chip fabrication, wafer processing, and memory interface technologies are essential components of the NAND flash supply chain. Data backup, data security, and reliability testing are crucial considerations for NAND flash users. Thin film deposition is a vital process in NAND flash memory production.
Market Dynamics
Our researchers analyzed the data with 2024 as the base year, along with the key drivers, trends, and challenges. A holistic analysis of drivers will help companies refine their marketing strategies to gain a competitive advantage.
What are the key market drivers leading to the rise in the adoption of NAND Flash Industry?
- The expansion of fabrication facilities through significant investments is the primary catalyst fueling market growth.
- The market: Key Players Invest in New Fabrication Facilities and 3D NAND Technology NAND Flash memory, a type of non-volatile memory, is a crucial component in various digital devices, including solid state drives (SSDs) and memory cards. The market for NAND Flash memory is witnessing significant growth due to the increasing demand for high-capacity storage solutions. Major memory device manufacturers, such as Samsung Electronics, Western Digital, Micron Technology, Toshiba, SK Hynix, and Intel, are investing in new fabrication facilities (fabs) to expand their production capacity and stay competitive. The rising demand for 3D NAND memory modules, which offer higher storage capacity and faster write speed, is creating opportunities for stakeholders in the supply chain.
- This includes chip makers, equipment manufacturers, and material suppliers. For instance, Micron Technology announced plans to invest over USD 150 billion worldwide in its global manufacturing operations and research and development outlays over the next decade to expand its memory chip fabrication capabilities. Error correction code (ECC) technology, flash memory controller, and memory research are essential aspects of NAND Flash memory. Operating temperature and flash memory management are critical factors affecting its performance. Data recovery and floating-gate transistor technology are other essential components. As the market evolves, memory cost and data storage requirements continue to be significant drivers.
- The competition in the NAND Flash memory market is intense, with players constantly innovating to improve memory cost, write speed, and reliability.
What are the market trends shaping the NAND Flash Industry?
- The increasing number of strategic partnerships and acquisitions represents a significant market trend. This trend reflects the industry's ongoing efforts to expand business reach and enhance competitiveness.
- The market dynamics are driven by strategic partnerships and acquisitions, which enable companies to expand their market reach and enhance technological competitence. For instance, Micron Technology's collaboration with seven industrial companies in February 2020 resulted in the Micron IQ Partner Program, aimed at delivering high-quality, robust, and long-lasting industrial solutions. This partnership promotes the joint development of 3D NAND flash memory and capital investments in line with market trends. Moreover, emerging memory technologies, such as toggle DDR and multi-level cell (MLC) and quad-level cell (QLC) NAND, continue to influence market growth. These technologies offer higher memory capacity, improved power consumption, and enhanced memory performance, making them suitable for data center memory, consumer electronics memory, enterprise storage, and USB flash drives.
- Furthermore, memory interface technologies, such as BICS Flash, ensure data integrity and high-speed data transfer, contributing to the market's growth. However, failure analysis and memory performance concerns remain critical challenges for companies in the market. To address these challenges, companies are investing in research and development to improve memory performance, reduce power consumption, and enhance data integrity.
What challenges does the NAND Flash Industry face during its growth?
- The industry's growth is significantly influenced by the volatile fluctuations in demand and supply.
- The market experiences a significant demand-supply gap due to the cyclical nature of the semiconductor industry. This market is driven by the demand for NAND flash memory in various industries, including smartphones, data centers, servers, cloud storage devices, and consumer electronics. Companies aim to match production with sales in these sectors, but unexpected shifts in demand can result in oversupply or shortages. Advancements in NAND flash technology, such as triple-level cell (TLC) and quad-level cell (QLC) designs, memory bandwidth enhancements, and the integration of flash translation layer, wear leveling algorithms, wafer processing, data backup, automotive memory, and thin film deposition, contribute to the market's growth.
- However, ensuring data security, reliability testing, and maintaining the integrity of the memory supply chain are crucial challenges. The market's continuous evolution necessitates ongoing innovation to meet the increasing demand for high-performance, cost-effective, and energy-efficient memory solutions.
Exclusive Customer Landscape
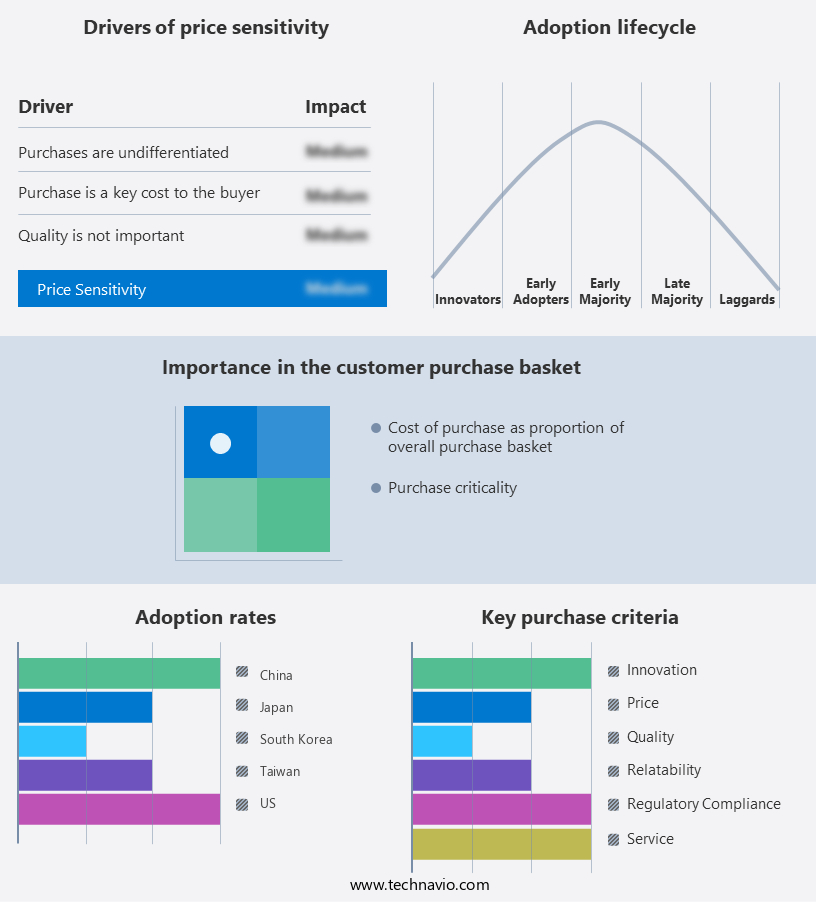
The NAND flash market forecasting report includes the adoption lifecycle of the market, covering from the innovator's stage to the laggard's stage. It focuses on adoption rates in different regions based on penetration. Furthermore, the NAND flash market report also includes key purchase criteria and drivers of price sensitivity to help companies evaluate and develop their market growth analysis strategies.
Customer Landscape
Key Companies & Market Insights
Companies are implementing various strategies, such as strategic alliances, nand flash market forecast, partnerships, mergers and acquisitions, geographical expansion, and product/service launches, to enhance their presence in the industry.
ADATA Technology Co. Ltd. - The company specializes in advanced NAND flash technology, including 112-layer BiCS5 3D NAND solid state drives.
The industry research and growth report includes detailed analyses of the competitive landscape of the market and information about key companies, including:
- ADATA Technology Co. Ltd.
- Berkshire Hathaway Inc.
- Flexxon Pte Ltd.
- Greenliant Systems
- Hyperstone GmbH
- Infineon Technologies AG
- Innodisk Corp.
- Kingston Technology Co. Inc.
- Kioxia Corp.
- Macronix International Co. Ltd.
- Micron Technology Inc.
- Renesas Electronics Corp.
- Samsung Electronics Co. Ltd.
- Semiconductor Manufacturing International Corp.
- Shenzhen Longsys Electronics Co. Ltd.
- Silicon Motion Technology Corp.
- SK hynix Co. Ltd.
- Toshiba Corp.
- Transcend Information Inc.
- UDISYS Ltd.
Qualitative and quantitative analysis of companies has been conducted to help clients understand the wider business environment as well as the strengths and weaknesses of key industry players. Data is qualitatively analyzed to categorize companies as pure play, category-focused, industry-focused, and diversified; it is quantitatively analyzed to categorize companies as dominant, leading, strong, tentative, and weak.
Recent Development and News in NAND Flash Market
- In February 2023, Intel announced the successful production of 33% larger 112-layer NAND flash chips, marking a significant technological advancement in the industry (Intel Press Release). This development is expected to increase storage capacity and efficiency, addressing the growing demand for high-density memory solutions.
- In April 2024, Samsung Electronics and Western Digital formed a strategic partnership to co-develop next-generation NAND flash technology. The collaboration aims to accelerate innovation, reduce development costs, and enhance their market positions (Samsung Newsroom). This partnership could lead to improved product offerings and increased competition in the market.
- In June 2024, SK Hynix secured a USD9 billion investment from the South Korean government to expand its NAND flash production capacity. This investment will enable SK Hynix to meet the growing demand for NAND flash memory in various applications, such as smartphones, data centers, and automotive sectors (Yonhap News Agency).
Research Analyst Overview
- The memory market, encompassing both the memory industry and data storage market, is witnessing significant activity and trends. Memory innovation strategies, such as memory performance optimization and memory design, are shaping the future of the market. Flash memory applications continue to expand, fueling the growth of the flash memory market. Next generation memory, including non-volatile memory and memory technology, is driving the memory industry outlook. Memory market segmentation reveals varying trends, with memory cost optimization and memory competitive landscape influencing market dynamics.
- Memory security is a growing concern, with memory industry leaders focusing on advanced memory solutions. Memory production is increasing to meet demand, while memory market analysis indicates a positive memory industry outlook. Emerging memory applications, such as memory solutions for artificial intelligence and memory future standards, are poised to disrupt the market. Memory technology advancements, including memory architecture and memory standardization, are crucial for memory industry progress.
Dive into Technavio's robust research methodology, blending expert interviews, extensive data synthesis, and validated models for unparalleled NAND Flash Market insights. See full methodology.
|
Market Scope |
|
|
Report Coverage |
Details |
|
Page number |
223 |
|
Base year |
2024 |
|
Historic period |
2019-2023 |
|
Forecast period |
2025-2029 |
|
Growth momentum & CAGR |
Accelerate at a CAGR of 6.5% |
|
Market growth 2025-2029 |
USD 26.4 billion |
|
Market structure |
Fragmented |
|
YoY growth 2024-2025(%) |
5.2 |
|
Key countries |
China, US, Japan, South Korea, Taiwan, Germany, Singapore, India, France, and Italy |
|
Competitive landscape |
Leading Companies, Market Positioning of Companies, Competitive Strategies, and Industry Risks |
What are the Key Data Covered in this NAND Flash Market Research and Growth Report?
- CAGR of the NAND Flash industry during the forecast period
- Detailed information on factors that will drive the growth and forecasting between 2025 and 2029
- Precise estimation of the size of the market and its contribution of the industry in focus to the parent market
- Accurate predictions about upcoming growth and trends and changes in consumer behaviour
- Growth of the market across APAC, North America, Europe, South America, and Middle East and Africa
- Thorough analysis of the market's competitive landscape and detailed information about companies
- Comprehensive analysis of factors that will challenge the nand flash market growth of industry companies
We can help! Our analysts can customize this nand flash market research report to meet your requirements.
 RIA -
RIA - 
