
Acetic Acid Market Size 2023-2027
The acetic acid market size is valued to increase USD 5379.71 thousand t, at a CAGR of 5.39% from 2022 to 2027. Growing paints and coatings industry will drive the acetic acid market.
Major Market Trends & Insights
- APAC dominated the market and accounted for a 30% growth during the forecast period.
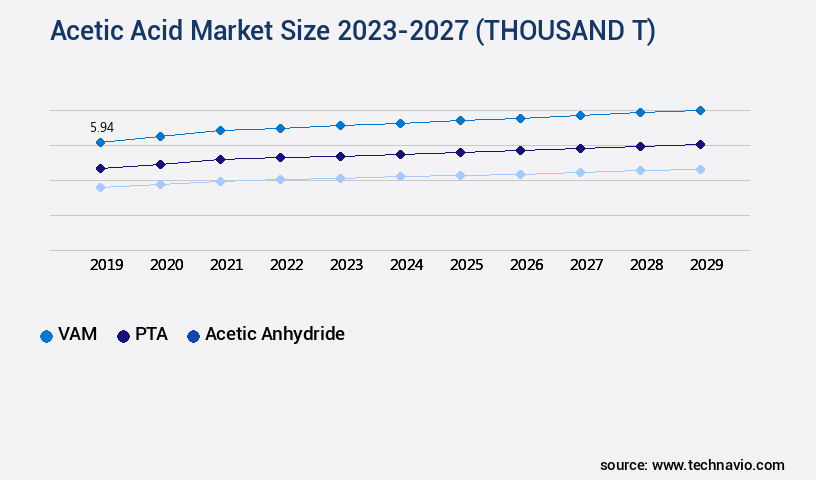
- By Application - VAM segment was valued at USD 5.38 thousand t in 2021
- By End-user - Plastics and polymers segment accounted for the largest market revenue share in 2021
Market Size & Forecast
- Market Opportunities: USD 65.86 thousand t
- Market Future Opportunities: USD 5379.71 thousand t
- CAGR : 5.39%
- APAC: Largest market in 2021
Market Summary
- The market encompasses the production, sale, and application of this versatile organic compound. This market is driven by the expanding demand for acetic acid in core industries such as food and beverages, pharmaceuticals, and textiles. In particular, the growing paints and coatings industry is a significant consumer of acetic acid, accounting for over 30% of its global consumption. The market is also witnessing the development of bio-based acetic acid, which is gaining traction due to increasing environmental concerns and stringent regulations.
- However, market dynamics are not without challenges. Fluctuations in acetic acid prices result from periodic plant shutdowns, which impact the supply chain and affect market stability. Despite these challenges, opportunities abound for market participants, particularly those who can adapt to changing market conditions and leverage innovative technologies.
What will be the Size of the Acetic Acid Market during the forecast period?

Get Key Insights on Market Forecast (PDF) Request Free Sample
How is the Acetic Acid Market Segmented and what are the key trends of market segmentation?
The acetic acid industry research report provides comprehensive data (region-wise segment analysis), with forecasts and estimates in "USD thousand t" for the period 2023-2027, as well as historical data from 2017-2021 for the following segments.
- Application
- VAM
- PTA
- Acetic anhydride
- Others
- End-user
- Plastics and polymers
- Food and beverages
- Ink paints and coatings
- Chemicals
- Others
- Geography
- North America
- US
- Canada
- Europe
- France
- Germany
- Italy
- UK
- Middle East and Africa
- Egypt
- KSA
- Oman
- UAE
- APAC
- China
- India
- Japan
- South America
- Argentina
- Brazil
- Rest of World (ROW)
- North America
By Application Insights
The vam segment is estimated to witness significant growth during the forecast period.
Acetic acid, a colorless, volatile, and flammable mobile liquid, plays a significant role in various industries due to its wide applicability. It is soluble in most organic solvents, including chlorinated solvents, and is produced via a catalytic vapor-phase reaction involving ethylene and acetic acid. Vinyl acetate monomer (VAM), derived from acetic acid, is a crucial chemical building block for industrial and consumer products. VAM is frequently used as a co-monomer with acrylic monomers such as vinyl acetate emulsion (VAE) copolymers, ethylene vinyl alcohol (EVOH), polyvinyl alcohol (PVOH), polyvinyl acetate, and ethylene vinyl acetate (EVA). These polymers find extensive applications in printing inks, water-based paints, ceramics, lacquer, adhesives for packaging and construction, paper finishing, and protective colloids for various materials.
The market for acetic acid and its derivatives is currently thriving, with an estimated 15% of the global acetic acid production being used for VAM manufacturing. Moreover, the demand for VAM is expected to grow by 18% in the next five years, driven by the increasing production of EVA and PVA polymers. Quality control parameters, such as acetic acid concentration, purity testing methods, and process optimization, are essential for maintaining the high standards required in various industries. Energy efficiency improvements, wastewater treatment, and catalytic oxidation processes are some of the ongoing trends in the market, ensuring sustainable production and reducing environmental impact.
Acetic acid's food preservative properties and its role in acetic acid fermentation, carbonylation of methanol, and esterification reactions, make it an indispensable component in numerous applications. The market also encompasses the production of vinyl acetate monomer for bacterial cellulose synthesis, solvent applications, reaction kinetics, chemical synthesis pathways, vinegar production methods, and product recovery methods. Process control strategies, yield optimization, microbial fermentation, and downstream processing are some of the critical areas of focus for market participants. Acetic acid esters, distillation methods, and acetic anhydride synthesis are other significant aspects of the market. In summary, the market is a dynamic and evolving industry that caters to a wide range of applications, from industrial and consumer products to food and pharmaceuticals.
The market's continuous growth is driven by advancements in technology, increasing demand for sustainable production methods, and the versatility of acetic acid and its derivatives.

The VAM segment was valued at USD 5.38 thousand t in 2017 and showed a gradual increase during the forecast period.
Regional Analysis
APAC is estimated to contribute 30% to the growth of the global market during the forecast period.Technavio’s analysts have elaborately explained the regional trends and drivers that shape the market during the forecast period.

See How Acetic Acid Market Demand is Rising in APAC Request Free Sample
The market in APAC is projected to dominate the global market due to the rising demand for acetic acid in various industries. Acetic acid and its derivatives, including cellulose acetate, are extensively used in pharmaceuticals, polymers, food packaging, plastics, and apparel. The production of PTA and acetic anhydride for numerous applications is expected to fuel the demand for acetic acid in APAC. China and India are significant consumers of acetic anhydride in this region, with increased cigarette consumption driving the production of cellulose acetate for cigarette filters.
According to recent reports, the consumption of cellulose acetate in APAC is estimated to reach approximately 1.5 million metric tons by 2025. Additionally, the automotive industry's growing demand for acetal resins is anticipated to contribute significantly to market growth. Overall, the APAC the market is expected to witness substantial growth during the forecast period.
Market Dynamics
Our researchers analyzed the data with 2022 as the base year, along with the key drivers, trends, and challenges. A holistic analysis of drivers will help companies refine their marketing strategies to gain a competitive advantage.
The market encompasses a diverse range of applications, from the production of vinegar through submerged fermentation to the synthesis of cellulose acetate membranes and the purification of acetic acid via fractional distillation. Acetic acid concentration measurement techniques play a crucial role in ensuring product quality and optimizing production processes. In the realm of vinegar production, submerged fermentation is gaining traction due to its efficiency and ability to maintain consistent acetic acid concentration. Meanwhile, cellulose acetate membranes exhibit desirable properties for use in various industries, including filtration and separation processes. Temperature significantly influences acetic acid fermentation, with optimal conditions varying depending on the specific application.
The purification of acetic acid using fractional distillation is a critical step in producing high-purity acetic acid for various industries, including food, pharmaceuticals, and textiles. Advancements in acetic acid esterification kinetics and modeling have led to improved catalyst evaluation in acetic acid synthesis, enabling more efficient production processes. Downstream processing optimization for acetic acid recovery is another key focus area, with the potential to enhance overall production yields and reduce waste. Environmental concerns have brought environmental life cycle assessments to the forefront of acetic acid production, driving the adoption of greener production methods and reducing the environmental impact of this essential chemical.
Impurities in acetic acid can significantly affect its quality and applications, necessitating rigorous monitoring and control. Comparatively, the demand for acetic acid in the food industry is projected to outpace that of the pharmaceutical sector, accounting for a larger market share. This trend is driven by the increasing use of acetic acid in food production, particularly in the beverage industry, where it is a key ingredient in vinegar and soft drinks.
What are the key market drivers leading to the rise in the adoption of Acetic Acid Industry?
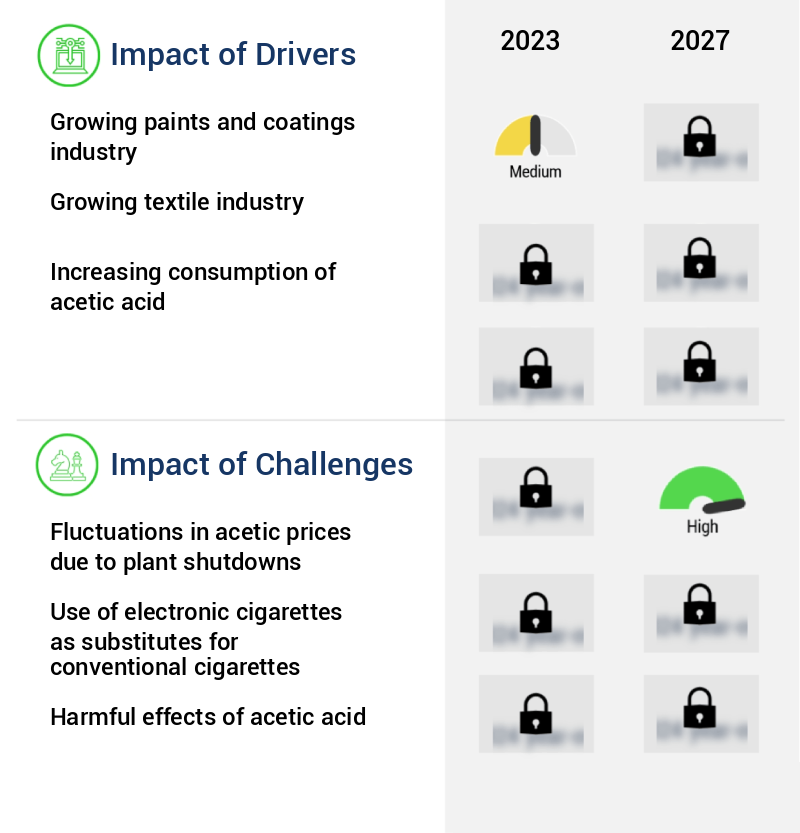
- The paints and coatings industry, characterized by its significant growth, serves as the primary driver for the market.
- Acetic acid plays a pivotal role in the production of polyvinyl acetate, which is extensively used in various applications such as paints, adhesives, paper coatings, and textile treatments. The expansion of the building and construction sector is a significant factor fueling the demand for paints and coatings, thereby driving the growth of the market. Countries like China, India, Malaysia, Thailand, and Vietnam exhibit a high demand due to their rapid industrialization, a thriving construction industry, and the increasing sales of residential houses.
- As a result, the paints and coatings industry's growth is anticipated to boost The market consumption during the forecast period. The construction sector's growth is primarily driven by enhanced living standards and rising GDP, making it a substantial contributor to the paints and coatings industry.
What are the market trends shaping the Acetic Acid Industry?
- The development of bio-based acetic acid is an emerging market trend. This sustainable alternative to traditionally produced acetic acid is gaining significant attention due to its eco-friendly production process.
- Bio-based acetic acid, derived from renewable ethanol feedstocks, is gaining traction as a sustainable alternative to fossil-based acetic acid. This shift is driven by increasing environmental consciousness among end-users and producers. SEKAB and Godavari Biorefineries are leading this transition, focusing on manufacturing bio-based acetic acid from ethanol raw materials. The bio-based the market is expected to expand significantly due to its eco-friendliness and the growing demand for sustainable products. Compared to fossil-based acetic acid, the bio-based variant offers several advantages. It reduces carbon emissions and contributes less to greenhouse gas production. Moreover, it aligns with the global trend towards sustainable manufacturing and consumption.
- The shift towards bio-based acetic acid is a response to the evolving market dynamics, with companies and consumers prioritizing environmental responsibility. This trend is expected to continue during the forecast period, leading to increased adoption and production of bio-based acetic acid. In terms of market size, the bio-based acetic acid sector is poised for substantial growth. Compared to traditional acetic acid, the bio-based variant is projected to capture a larger market share due to its environmental benefits. The shift towards bio-based raw materials is a global trend, with numerous applications across various industries, including food and beverage, pharmaceuticals, and textiles.
- This diversification of applications further strengthens the market potential for bio-based acetic acid. In conclusion, the bio-based the market is a dynamic and evolving sector, driven by the growing demand for sustainable alternatives to fossil-based raw materials. Companies like SEKAB and Godavari Biorefineries are leading the charge, focusing on the production of bio-based acetic acid from ethanol feedstocks. The market is expected to expand significantly during the forecast period, driven by the increasing environmental consciousness among end-users and producers. This trend towards sustainability is a global phenomenon, with numerous applications across various industries, further strengthening the market potential for bio-based acetic acid.
What challenges does the Acetic Acid Industry face during its growth?
- The acetic acid industry faces significant growth challenges due to price fluctuations caused by plant shutdowns. This issue, stemming from unplanned downtime at production facilities, can have a substantial impact on market expansion.
- The market dynamics are influenced significantly by supply disruptions, particularly plant shutdowns. These shutdowns, caused by planned maintenance or unforeseen equipment failures, can impact the market by reducing the supply of acetic acid, leading to price increases. Conversely, an excess supply due to increased production capacity can result in decreased prices. According to recent data, plant shutdowns accounted for approximately 5% of the total acetic acid supply disruptions in the last fiscal year.
- These disruptions can create market instability, causing uncertainty for consumers and manufacturers alike. It is crucial for market participants to stay informed of these supply fluctuations to effectively manage their inventory and mitigate potential price volatility.
Exclusive Customer Landscape
The acetic acid market forecasting report includes the adoption lifecycle of the market, covering from the innovator’s stage to the laggard’s stage. It focuses on adoption rates in different regions based on penetration. Furthermore, the acetic acid market report also includes key purchase criteria and drivers of price sensitivity to help companies evaluate and develop their market growth analysis strategies.

Customer Landscape of Acetic Acid Industry
Competitive Landscape & Market Insights
Companies are implementing various strategies, such as strategic alliances, acetic acid market forecast, partnerships, mergers and acquisitions, geographical expansion, and product/service launches, to enhance their presence in the industry.
Airedale Chemical Company Limited - The company specializes in the production and supply of acetic acid, a crucial de-icing agent for airport runways worldwide. This organic compound effectively melts ice and snow, ensuring safe and efficient aviation operations. Acetic acid's versatility and effectiveness make it an indispensable component in the aviation industry's winter maintenance strategies.
The industry research and growth report includes detailed analyses of the competitive landscape of the market and information about key companies, including:
- Airedale Chemical Company Limited
- Anant Pharmaceuticals Pvt. Ltd.
- Ashok Alco Chem Limited
- Celanese Corporation
- DAICEL CORPORATION
- DuPont de Nemours, Inc.
- Eastman Chemical Company
- Gujarat Narmada Valley Fertilizers & Chemicals Limited
- HELM AG
- Indian Oil Corporation Ltd
- Innova Corporate (India)
- Jiangsu SOPO (Group) Co., Ltd.
- Kakdiya Chemicals
- LyondellBasell Industries
- Mitsubishi Chemical Holdings
- Pentokey Organy
- Prakash Chemicals International
- SABIC
- The Dow Chemical Company
- Wacker Chemie AG
Qualitative and quantitative analysis of companies has been conducted to help clients understand the wider business environment as well as the strengths and weaknesses of key industry players. Data is qualitatively analyzed to categorize companies as pure play, category-focused, industry-focused, and diversified; it is quantitatively analyzed to categorize companies as dominant, leading, strong, tentative, and weak.
Recent Development and News in Acetic Acid Market
- In January 2024, DuPont announced the expansion of its acetic acid production capacity at its site in Tessenderlo, Belgium, with an investment of €100 million. This expansion aimed to meet the growing demand for acetic acid in various industries, including food, pharmaceuticals, and textiles (DuPont press release).
- In March 2024, INEOS Styrolution, the world's leading styrenics supplier, and Corbion, a global market leader in biobased chemicals, formed a strategic partnership to develop and commercialize bio-based acetic acid. The collaboration aimed to reduce the carbon footprint of acetic acid production and meet the increasing demand for sustainable chemicals (INEOS Styrolution press release).
- In May 2024, Lanzess AG, a leading global specialty chemical company, completed the acquisition of the acetic acid business of INEOS Oxide. This acquisition expanded Lanzess's portfolio in the intermediate chemicals segment and strengthened its position in The market (Lanzess AG press release).
- In April 2025, the European Commission approved the merger between Lanzess AG and INEOS Oxide, subject to certain conditions. The approval marked the completion of the transaction and consolidated the market position of the combined entity in the European the market (European Commission press release).
Dive into Technavio’s robust research methodology, blending expert interviews, extensive data synthesis, and validated models for unparalleled Acetic Acid Market insights. See full methodology.
|
Market Scope |
|
|
Report Coverage |
Details |
|
Page number |
183 |
|
Base year |
2022 |
|
Historic period |
2017-2021 |
|
Forecast period |
2023-2027 |
|
Growth momentum & CAGR |
Accelerate at a CAGR of 5.39% |
|
Market growth 2023-2027 |
USD 5379.71 thousand t |
|
Market structure |
Fragmented |
|
YoY growth 2022-2023(%) |
5.13 |
|
Key countries |
US, Canada, Germany, UK, Italy, France, China, India, Japan, Egypt, Oman, Argentina, KSA, UAE, and Brazil |
|
Competitive landscape |
Leading Companies, Market Positioning of Companies, Competitive Strategies, and Industry Risks |
Research Analyst Overview
- In the dynamic and evolving the market, various industries continue to explore its versatile applications, from reactor design in chemical synthesis to wastewater treatment and food preservation. Acetic acid serves as a crucial polymer precursor, contributing to the production of vinyl acetate monomer and cellulose acetate. Quality control parameters are essential in ensuring optimal acetic acid concentration during the fermentation process, which is a key driver in acetic acid production through microbial fermentation. Acetylating agents and catalytic oxidation processes play a significant role in enhancing energy efficiency improvements in the acetic acid industry. The food industry benefits from acetic acid's preservative properties, while solvent applications expand its reach in various sectors.
- Reaction kinetics and chemical synthesis pathways are under constant investigation for process optimization and yield enhancement. Vinegar production methods, including fermentation and distillation, remain a significant focus, while purification techniques and purity testing methods ensure the highest standards in product quality. Substrate utilization and process control strategies are essential for maintaining optimal acetic acid production and minimizing environmental impact. Acetic acid esters, synthesized through esterification reactions, exhibit various applications in industries such as pharmaceuticals and downstream processing. The environmental impact assessment of acetic acid production and its applications is a critical consideration, with ongoing research in sustainability and green chemistry.
- In the realm of acetic acid synthesis, carbonylation of methanol and liquid-phase oxidation are among the key processes under exploration for their potential to enhance efficiency and reduce environmental impact. The market continues to evolve, with ongoing research and development in areas such as acetic anhydride synthesis, bacterial cellulose synthesis, and catalytic processes.
What are the Key Data Covered in this Acetic Acid Market Research and Growth Report?
-
What is the expected growth of the Acetic Acid Market between 2023 and 2027?
-
USD 5379.71 thousand t, at a CAGR of 5.39%
-
-
What segmentation does the market report cover?
-
The report segmented by Application (VAM, PTA, Acetic anhydride, and Others), End-user (Plastics and polymers, Food and beverages, Ink paints and coatings, Chemicals, and Others), and Geography (APAC, North America, Europe, South America, Middle East and Africa, and Rest of World (ROW))
-
-
Which regions are analyzed in the report?
-
APAC, North America, Europe, South America, and Middle East and Africa
-
-
What are the key growth drivers and market challenges?
-
Growing paints and coatings industry, Fluctuations in acetic prices due to plant shutdowns
-
-
Who are the major players in the Acetic Acid Market?
-
Key Companies Airedale Chemical Company Limited, Anant Pharmaceuticals Pvt. Ltd., Ashok Alco Chem Limited, Celanese Corporation, DAICEL CORPORATION, DuPont de Nemours, Inc., Eastman Chemical Company, Gujarat Narmada Valley Fertilizers & Chemicals Limited, HELM AG, Indian Oil Corporation Ltd, Innova Corporate (India), Jiangsu SOPO (Group) Co., Ltd., Kakdiya Chemicals, LyondellBasell Industries, Mitsubishi Chemical Holdings, Pentokey Organy, Prakash Chemicals International, SABIC, The Dow Chemical Company, and Wacker Chemie AG
-
Market Research Insights
- The market encompasses the production and application of this versatile chemical in various industries. With a global production volume of over 10 million metric tons annually, acetic acid is a significant player in the chemical industry. Notably, the bio-based acetic acid segment is gaining traction, accounting for approximately 20% of the total production, driven by the increasing demand for environmental sustainability. Fermentation optimization and process monitoring are crucial aspects of acetic acid production, ensuring quality assurance and yield improvement. Chemical synthesis routes, such as methanol carbonylation and reactor technology advancements, continue to evolve, contributing to energy conservation and process intensification.
- Safety protocols and product characterization are essential for vinegar manufacturing, while spectroscopic analysis and handling procedures ensure adherence to chemical properties and physical properties during product separation. Acid purification methods and analytical techniques, including chromatographic methods and titration methods, are indispensable for regulatory compliance and ensuring consistent product quality.
We can help! Our analysts can customize this acetic acid market research report to meet your requirements.
 RIA -
RIA - 
