
Advanced Building Materials Market Size 2025-2029
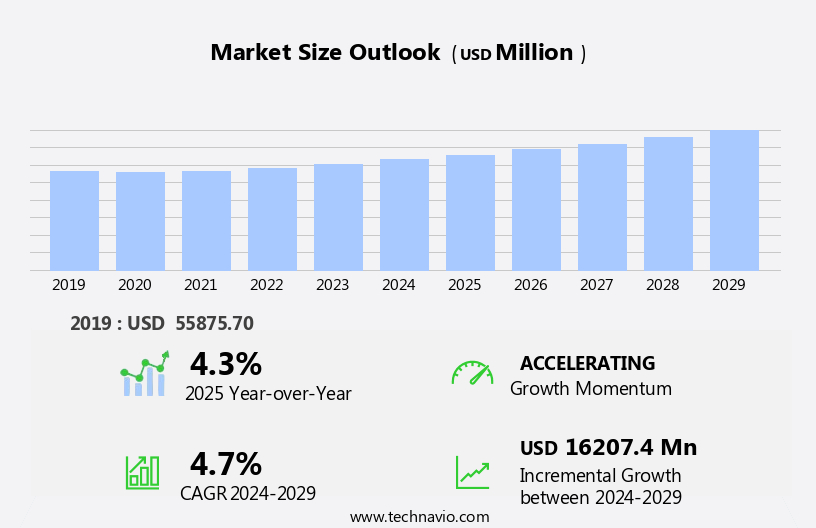
The advanced building materials market size is forecast to increase by USD 16.21 billion at a CAGR of 4.7% between 2024 and 2029.
- Advanced building materials continue to gain traction in the construction industry due to several key trends. The rise in the number of smart cities is driving the demand for advanced building materials such as smart glass, solar panels, and digital technologies for energy efficiency and sustainability. Additionally, there is a growing preference for eco-friendly and recycled materials, including insulation, sealants, and greenhouse gases-absorbing concrete. Uncertain macroeconomic conditions have also led to an increased focus on cost-effective and durable construction materials such as Structural Insulated Panels (SIPs), ready-mix concrete, and steel. Furthermore, the trend towards green buildings and energy-efficient residential real estate is expected to continue, with a focus on reducing carbon footprints and improving indoor air quality. Boron-based materials, such as boron nitride nanotubes, are also gaining attention for their potential to enhance the properties of cement and roofing materials. Overall, the market in the US is poised for significant growth, driven by these trends and the need for sustainable, cost-effective, and energy-efficient solutions.
What will be the Size of the Advanced Building Materials Market During the Forecast Period?
- The market encompasses a broad range of innovative and high-performance materials that are transforming the construction industry. These materials, which include cross-laminated timber, structural insulated panels, sealants, ready-mix concrete, precast products and elements, Ondura, advanced cement, and various green materials, are driving the sector's growth through their ability to reduce construction time, enhance energy efficiency, and offer cost-effective solutions. The market's size is significant, with continued expansion expected due to the global focus on decarbonization and the circular economy. Key trends include the increasing adoption of green materials, such as those derived from renewable sources, and the integration of smart technologies into building materials.
- Traditional construction materials, such as cement and concrete, are also undergoing advancements to improve their sustainability and performance. Energy-efficient buildings and infrastructure are major applications for these advanced materials, with high-performance windows, insulation materials, and smart glass playing crucial roles. Companies are at the forefront of this innovation, developing and implementing new materials and technologies to meet the evolving needs of the construction industry.
How is this Advanced Building Materials Industry segmented and which is the largest segment?
The advanced building materials industry research report provides comprehensive data (region-wise segment analysis), with forecasts and estimates in "USD million" for the period 2025-2029, as well as historical data from 2019-2023 for the following segments.
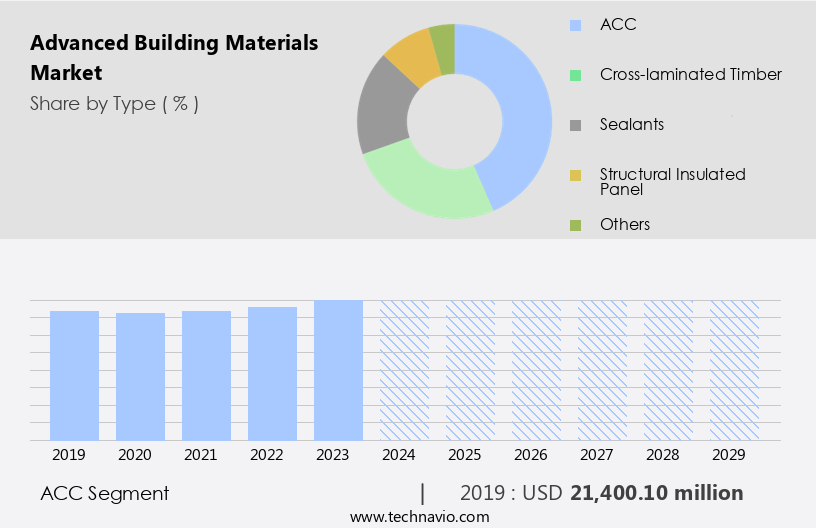
- Type
- ACC
- Cross-laminated timber
- Sealants
- Structural insulated panel
- Others
- End-user
- Commercial
- Industrial
- Residential
- Product Type
- Green materials
- Composite materials
- Smart materials
- Nanomaterials
- Geography
- APAC
- China
- India
- Japan
- Europe
- Germany
- UK
- France
- Italy
- North America
- Canada
- US
- Middle East and Africa
- South America
- Brazil
- APAC
By Type Insights
- The ACC segment is estimated to witness significant growth during the forecast period.
The advanced cement and concrete market is experiencing significant innovations, transforming the construction industry with materials offering superior durability, strength, and environmental benefits. Technologies such as photocatalytic cement, self-healing concrete, and high-performance additives are gaining popularity. Governments and organizations worldwide support the adoption of modern cement and concrete to reduce carbon emissions and enhance infrastructure durability. Notable advancements include Ultra-High-Performance Concrete (UHPC), which provides exceptional strength and longevity, reducing the need for bulky reinforcements and lowering maintenance costs. Cross-laminated timber, structural insulated panels, insulated concrete forms, energy-efficient windows, engineered lumber, and other green materials are also revolutionizing the building construction sector.
Companies are at the forefront of these innovations, focusing on sustainable construction practices and decarbonization. Infrastructure projects and urbanization in sectors such as residential, commercial, and infrastructure benefit from these high-performance materials, which offer energy efficiency, soundproofing, moisture resistance, and resistance to fire, and earthquakes. Product innovation and strategic collaborations drive market growth, although high initial costs and regulatory hurdles remain challenges. Green retrofitting and smart buildings are key trends, with a focus on eco-friendly paints, thermal insulation, and aesthetic appeal.
Get a glance at the market report of various segments Request Free Sample
The ACC segment was valued at USD 21.4 billion in 2019 and showed a gradual increase during the forecast period.
Regional Analysis
- APAC is estimated to contribute 54% to the growth of the global market during the forecast period.
Technavio's analysts have elaborately explained the regional trends and drivers that shape the market during the forecast period.

For more insights on the market share of various regions, Request Free Sample
The market in APAC is experiencing significant growth due to the increasing construction activity in emerging economies like India. The construction sector is projected to expand steadily in the region, fueling the demand for innovative and high-performance materials to construct residential and commercial infrastructure. APAC was the leading consumer of advanced building materials worldwide in 2024. The region's growth is driven by the rise in construction projects for both residential and non-residential buildings. Key innovations, product development, and quality improvements are notable in APAC, with companies leading the way. The market is influenced by the circular economy, decarbonization, and sustainable construction practices.
Furthermore, advanced materials like cross-laminated timber, insulated concrete forms, energy-efficient windows, engineered lumber, and structural insulated panels are gaining popularity for their energy efficiency, cost-effectiveness, and resistance to natural disasters. Building construction and infrastructure sectors are the primary end-users, with construction companies prioritizing energy efficiency, indoor environments, soundproofing, moisture resistance, resistance to fire, and resistance to earthquakes. Key materials include sealants, ready-mix concrete, precast products & elements, Ondura, green materials, advanced cement, and smart glass. Product innovation and strategic collaborations are essential for market growth, despite high initial costs, availability of alternatives, and regulatory hurdles. Green retrofitting and smart buildings are also emerging trends in the market.
Market Dynamics
Our researchers analyzed the data with 2024 as the base year, along with the key drivers, trends, and challenges. A holistic analysis of drivers will help companies refine their marketing strategies to gain a competitive advantage.
What are the key market drivers leading to the rise in the adoption of Advanced Building Materials Industry?
An increase in several smart cities is the key driver of the market.
- The market is witnessing significant growth due to the increasing focus on sustainable construction practices and decarbonization in the construction industry. The use of cost-effective, energy-efficient, and eco-friendly products such as cross-laminated timber, structural insulated panels, insulated concrete forms, energy-efficient windows, engineered lumber, and sealants is on the rise. Companies are leading the way in new product releases, including advanced cement and high-performance materials. Construction projects in the infrastructure sector are adopting these innovative materials to reduce construction time, enhance energy efficiency, and improve indoor environments. The demand for green materials is increasing due to their aesthetic appeal, moisture resistance, resistance to fire, resistance to earthquakes, and soundproofing properties.
- Construction companies are investing in product innovation and strategic collaborations to meet the growing demand for sustainable building materials. However, high initial costs and regulatory hurdles are challenges that need to be addressed to accelerate the adoption of advanced building materials. The availability of alternatives and green retrofitting are also crucial factors influencing the market's growth. The market is expected to continue growing as the focus on sustainable construction practices and energy-efficient buildings intensifies, driven by the need to reduce operational costs and mitigate the impact of natural disasters on urbanization.
What are the market trends shaping the Advanced Building Materials Industry?
The rise in the use of eco-friendly and recycled materials is the upcoming market trend.
- The market is witnessing a shift towards eco-friendly and cost-effective solutions. Sustainability is a key focus in the construction industry, leading to the increased usage of recycled materials, such as bamboo-based composites, recycled plastic building blocks, and hempcrete. These materials offer benefits like lower energy consumption, reduced greenhouse gas emissions, and less waste production. Traditional building materials, like concrete and steel, are being replaced with sustainable alternatives, such as recycled concrete aggregate, reclaimed wood, and recycled steel. Additionally, innovative materials like cross-laminated timber, structural insulated panels, sealants, insulated concrete forms, energy-efficient windows, engineered lumber, and green insulation materials are gaining popularity due to their high performance and aesthetic appeal.
- Companies are leading the way in product innovation and strategic collaborations to meet the demand for sustainable construction practices. However, high initial costs and regulatory hurdles remain challenges in the market. Despite these challenges, the market is expected to grow as the infrastructure pipeline in sectors like commercial and residential continues to expand in the Shandong Province and other regions, driving the need for energy-efficient buildings and infrastructure. Smart buildings, soundproofing, moisture resistance, resistance to fire, resistance to earthquakes, and thermal insulation are some of the key areas of focus in the market.
What challenges does the Advanced Building Materials Industry face during its growth?
Uncertain macroeconomic conditions are a key challenge affecting industry growth.
- The market dynamics are influenced by various factors, including construction time, cost-effectiveness, and the adoption of sustainable construction practices. The construction industry is affected by global and regional economic conditions, which can impact demand for advanced building materials. Moderate to slow economic growth and volatility can lead to customers postponing spending due to tighter credit, declining income or asset values, and negative financial news. Non-residential real estate markets, labor and healthcare costs, and access to credit are additional factors that could influence demand. The shift towards decarbonization and the circular economy is driving the demand for green building materials.
- Companies are investing in new product releases, such as cross-laminated timber, structural insulated panels, sealants, insulated concrete forms, energy-efficient windows, engineered lumber, and high-performance windows. These innovative materials offer advantages like moisture resistance, resistance to fire, resistance to earthquakes, soundproofing, and thermal insulation, enhancing the aesthetic appeal of buildings. Product innovation and strategic collaborations are crucial in the market. Companies are focusing on high initial costs, availability of alternatives, and regulatory hurdles to develop cost-effective and sustainable solutions. Green retrofitting and smart buildings are emerging trends, with a growing emphasis on energy efficiency and operational costs in indoor environments.
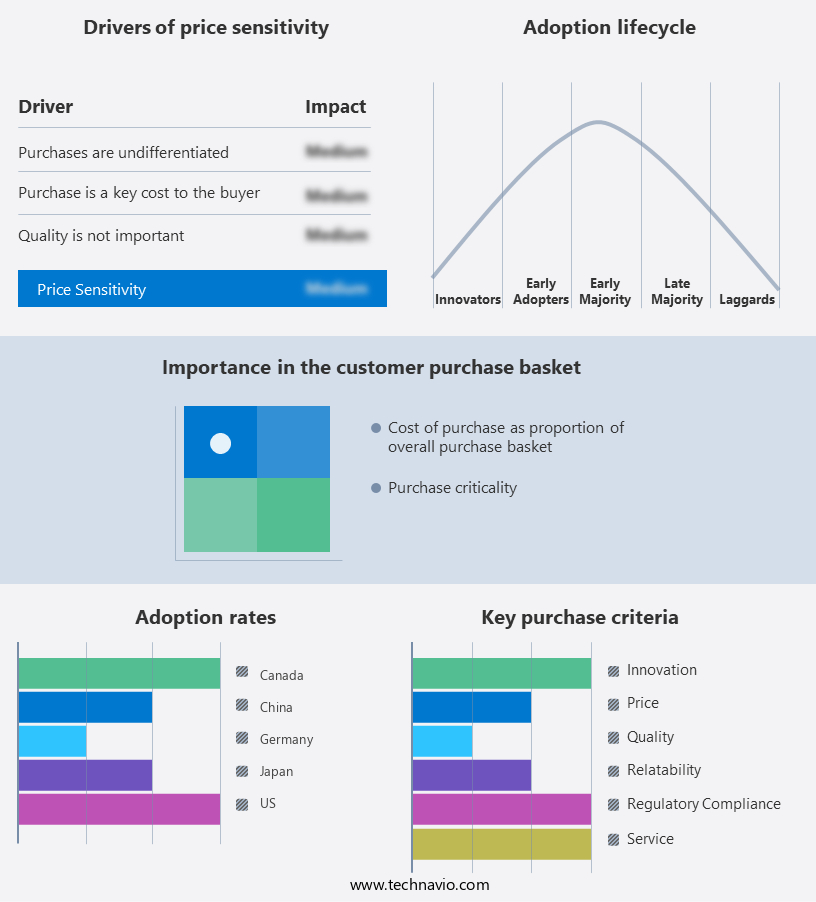
Exclusive Customer Landscape
The market forecasting report includes the adoption lifecycle of the market, covering from the innovator's stage to the laggard's stage. It focuses on adoption rates in different regions based on penetration. Furthermore, the market report also includes key purchase criteria and drivers of price sensitivity to help companies evaluate and develop their market growth analysis strategies.
Customer Landscape
Key Companies & Market Insights
Companies are implementing various strategies, such as strategic alliances, advanced building materials market forecast, partnerships, mergers and acquisitions, geographical expansion, and product/service launches, to enhance their presence in the industry.
APV Engineered Coatings LLC: The company offers advanced building materials such as TPO PrimeKote. Also, they offer products such as water-based and solvent-based adhesives.
The industry research and growth report includes detailed analyses of the competitive landscape of the market and information about key companies, including:
- 3M Co.
- Aditya Birla Management Corp. Pvt. Ltd.
- APV Engineered Coatings LLC
- BASF
- Boral Ltd.
- CEMEX SAB de CV
- Compagnie de Saint-Gobain SA
- CRH Plc
- Daikin Industries Ltd.
- DuPont de Nemours Inc.
- Heidelberg Materials AG
- Holcim Ltd.
- Huntsman Corp.
- Kingspan Group Plc
- Knauf Digital GmbH
- OC Oerlikon Corp. AG
- Owens Corning
- PPG Industries Inc.
- Sika AG
- The Sherwin Williams Co.
Qualitative and quantitative analysis of companies has been conducted to help clients understand the wider business environment as well as the strengths and weaknesses of key industry players. Data is qualitatively analyzed to categorize companies as pure play, category-focused, industry-focused, and diversified; it is quantitatively analyzed to categorize companies as dominant, leading, strong, tentative, and weak.
Research Analyst Overview
The market continues to evolve, driven by the need for cost-effective solutions, energy efficiency, and sustainable practices. One trend gaining momentum is the adoption of materials that align with the circular economy and decarbonization initiatives. Cross-laminated timber (CLT) and structural insulated panels (SIPs) are two innovative materials that offer significant benefits in terms of energy efficiency and sustainability. CLT is a type of engineered wood product, manufactured by gluing layers of lumber in a specific way to create panels with exceptional strength and insulation properties. SIPs, on the other hand, consist of insulation sandwiched between two structural facings, creating a high-performance building envelope.
Moreover, sealants play a crucial role in ensuring the energy efficiency of buildings, as they help prevent air leakage and moisture intrusion. Advanced sealants offer improved performance, longevity, and compatibility with various building materials. Both residential and commercial sectors are embracing these advanced materials, as they offer numerous advantages over traditional construction materials. Energy-efficient windows, insulated concrete forms, and high-performance windows are some other examples of materials that contribute to the reduction of operational costs and improvement of indoor environments. The infrastructure sector is also adopting advanced building materials to enhance the durability and resilience of buildings and infrastructure projects.
Furthermore, materials that offer resistance to natural disasters, such as earthquakes and hurricanes, are particularly important in this context. The use of green materials, such as eco-friendly paints and thermal insulation, is another trend gaining traction in the building construction industry. These materials not only contribute to energy efficiency but also offer aesthetic appeal and improved indoor air quality. Product innovation and strategic collaborations are key drivers in the market. Companies are investing in research and development to create new products and improve existing ones.
|
Market Scope |
|
|
Report Coverage |
Details |
|
Page number |
222 |
|
Base year |
2024 |
|
Historic period |
2019-2023 |
|
Forecast period |
2025-2029 |
|
Growth momentum & CAGR |
Accelerate at a CAGR of 4.7% |
|
Market growth 2025-2029 |
USD 16.21 billion |
|
Market structure |
Fragmented |
|
YoY growth 2024-2025(%) |
4.3 |
|
Key countries |
China, US, Japan, Germany, Canada, UK, France, Italy, Brazil, and India |
|
Competitive landscape |
Leading Companies, Market Positioning of Companies, Competitive Strategies, and Industry Risks |
What are the Key Data Covered in this Advanced Building Materials Market Research and Growth Report?
- CAGR of the Advanced Building Materials industry during the forecast period
- Detailed information on factors that will drive the growth and forecasting between 2025 and 2029
- Precise estimation of the size of the market and its contribution of the industry in focus to the parent market
- Accurate predictions about upcoming growth and trends and changes in consumer behaviour
- Growth of the market across APAC, Europe, North America, Middle East and Africa, and South America
- Thorough analysis of the market's competitive landscape and detailed information about companies
- Comprehensive analysis of factors that will challenge the advanced building materials market growth of industry companies
We can help! Our analysts can customize this advanced building materials market research report to meet your requirements.
 RIA -
RIA - 
