
Advanced Drug Delivery Systems Market Size 2024-2028
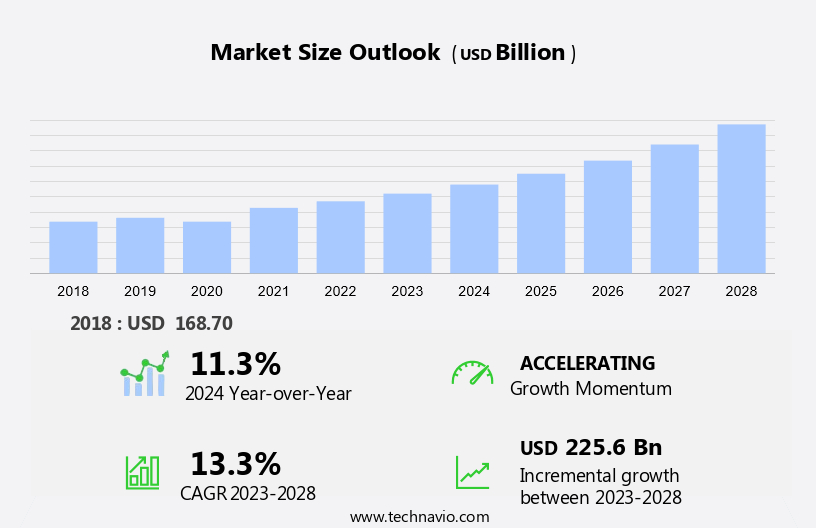
The advanced drug delivery systems market size is forecast to increase by USD 225.6 billion at a CAGR of 13.3% between 2023 and 2028.
- The Advanced Drug Delivery Systems (ADDS) market is experiencing significant growth due to the rising prevalence of chronic diseases and the need for improved patient compliance. Innovations in nanotechnology are playing a pivotal role in the development of novel ADDS, enabling targeted drug delivery to specific cell membrane structures.
- However, stringent regulations pose a challenge to market growth, requiring rigorous testing and approval processes. In the US, cardiovascular diseases are a major focus area for ADDS, with a high unmet medical need for effective and safe drug delivery solutions. The market is expected to continue growing, driven by the potential of ADDS to address complex health issues and improve patient outcomes. Risk factors for CAD include an unhealthy lifestyle, an aging population, excessive consumption of saturated and trans-fat foods, tobacco use, high blood pressure, smoking, high cholesterol, diabetes, obesity, physical inactivity, and a family history of CVD.
What will be the Size of the Market During the Forecast Period?
- Advanced drug delivery systems have emerged as a crucial area of research and development in the pharmaceutical industry. These systems aim to enhance the efficacy, safety, and patient compliance of drug therapies by employing innovative drug delivery mechanisms and strategies. Drug delivery optimization is a significant aspect of pharmaceutical research, as it can lead to improved patient outcomes and reduced healthcare costs. Biocompatible nanoparticles are among the most promising drug delivery platforms, enabling targeted drug delivery and enhanced absorption of hydrophobic drugs. Nanoparticle drug delivery systems offer several benefits, including controlled release, increased bioavailability, and reduced side effects.
- Furthermore, the impact of these systems on drug therapy is substantial, as they allow for more precise dosing and improved patient compliance. Drug delivery innovations continue to emerge, with a focus on developing safer and more effective delivery mechanisms. For instance, drug delivery platforms that utilize advanced polymers and lipid-based nanocarriers offer enhanced drug stability and stability in vivo. Safety is a critical consideration in drug delivery development, and advanced systems are designed to minimize potential adverse effects.
- For example, drug delivery mechanisms that utilize pH-sensitive polymers can release drugs in specific areas of the body, reducing exposure to healthy tissues. Oral drug absorption is a significant challenge in pharmaceutical research, and advanced drug delivery systems offer potential solutions. For instance, nanoparticle-based systems can improve the bioavailability of orally administered drugs, leading to more consistent and effective therapy. In conclusion, advanced drug delivery systems represent a vital area of research and development in the pharmaceutical industry. These systems offer numerous benefits, including improved drug efficacy, enhanced patient safety, and increased patient compliance. As research in this field continues to advance, we can expect to see even more innovative drug delivery mechanisms and strategies that will transform the way we approach drug therapy.
How is this market segmented and which is the largest segment?
The market research report provides comprehensive data (region-wise segment analysis), with forecasts and estimates in "USD billion" for the period 2024-2028, as well as historical data from 2018-2022 for the following segments.
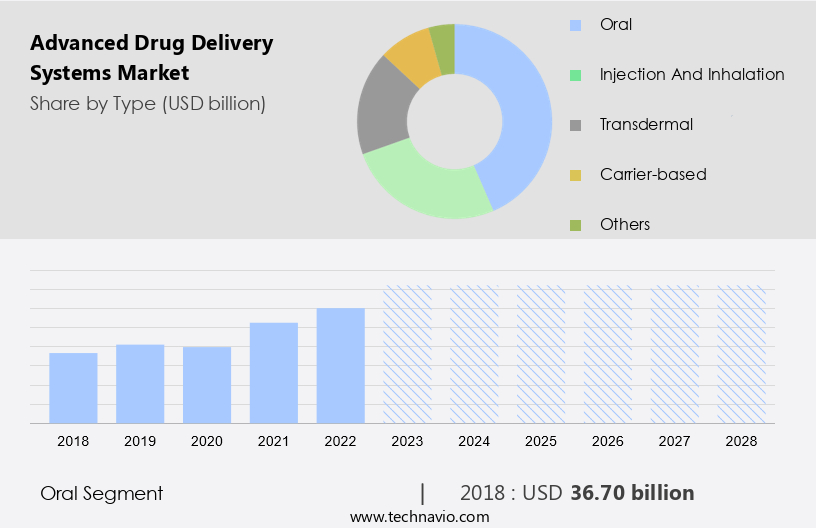
- Type
- Oral
- Injection and inhalation
- Transdermal
- Carrier-based
- Others
- Geography
- North America
- Canada
- US
- Europe
- Germany
- UK
- France
- Asia
- China
- India
- Japan
- Rest of World (ROW)
- North America
By Type Insights
- The oral segment is estimated to witness significant growth during the forecast period.
Advanced drug delivery systems have gained significant attention in the pharmaceutical industry due to their ability to improve the efficacy and safety of hydrophilic drugs, particularly those that are unstable in the gastrointestinal tract. Controlled release drug delivery systems allow for self-administration, enhancing patient compliance and convenience. However, the development of these systems comes with challenges, including the complexity and costs involved in research, development, patenting, and marketing. Despite these hurdles, pharmaceutical companies continue to invest in the advancement of oral release drug delivery systems to expand the therapeutic potential of hydrophilic drugs and reduce the risk of toxicity and side effects associated with traditional oral dosage forms. This trend is expected to continue as the demand for personalized and patient-centric healthcare solutions grows.
Get a glance at the market report of share of various segments Request Free Sample
The oral segment was valued at USD 36.70 billion in 2018 and showed a gradual increase during the forecast period.
Regional Analysis
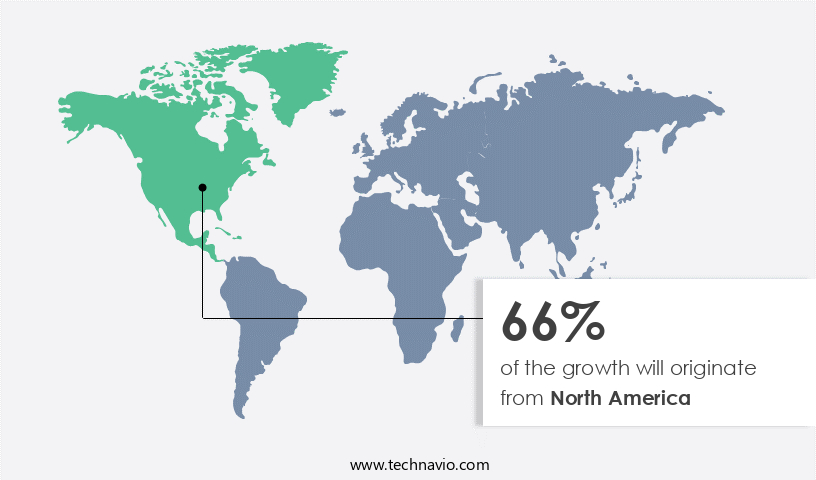
- North America is estimated to contribute 66% to the growth of the global market during the forecast period.
Technavio's analysts have elaborately explained the regional trends and drivers that shape the market during the forecast period.
For more insights on the market share of various regions Request Free Sample
The North American market holds the largest share in the global Advanced Drug Delivery Systems (ADDS) market in 2023. The region's dominance can be attributed to the increasing adoption of advanced drug delivery solutions and innovative treatment methods in healthcare. The US is the frontrunner in the North American market. Self-administration of drugs, technological advancements in injectable drug delivery systems, and the high acceptance of new healthcare technologies are the primary growth drivers for the North American ADDS market.
Moreover, the prevalence of chronic diseases is on the rise in North American countries, including the US. Lipid vesicles, such as liposomes and nanoliposomes, are gaining popularity in the ADDS market due to their precision in drug delivery and ability to improve drug solubility and bioavailability. These vesicles can encapsulate both hydrophilic and lipophilic drugs, making them suitable for a wide range of applications. The increasing research and development activities in the pharmaceutical industry, coupled with government initiatives to promote the adoption of advanced drug delivery systems, further fuel the market growth. With the continuous advancements in technology and the increasing focus on personalized medicine, the North American ADDS market is expected to witness significant growth in the coming years.
Market Dynamics
Our researchers analyzed the data with 2023 as the base year, along with the key drivers, trends, and challenges. A holistic analysis of drivers will help companies refine their marketing strategies to gain a competitive advantage.
What are the key market drivers leading to the rise in adoption of Advanced Drug Delivery Systems Market ?
Rising chronic disease is the key driver of the market.
- Chronic diseases, including coronary artery disease (CAD) and hypertension, are on the rise in the US population, leading to a significant market demand for advanced drug delivery systems. These conditions, which persist for a year or more and necessitate ongoing medical intervention, can limit daily activities. CAD is a type of cardiovascular disease (CVD) that affects the heart and blood vessels, often due to the buildup of fatty deposits or blood clots in the arteries.
- Hypertension, or high blood pressure, is another prevalent chronic condition that can lead to various health complications, including heart disease and stroke. The market offers innovative solutions to enhance the bioavailability of drugs used to treat these conditions, ensuring effective and consistent therapeutic outcomes.
What are the market trends shaping the Advanced Drug Delivery Systems Market?
Advancements in nanotechnology are the upcoming trends in the market.
- Nanotechnology is revolutionizing the market by enabling the creation of complex therapeutic agents through manipulation of materials at the molecular and atomic levels. This innovation leads to drug delivery systems that boost bioavailability, enhance solubility, and ensure controlled medication release. Nanoparticles can be customized to penetrate specific cell membrane structures, thereby increasing treatment efficacy while minimizing side effects, especially in cardiovascular diseases and oncology.
- Furthermore, nanotechnology enables the development of multifunctional delivery systems, combining diagnostic and therapeutic capabilities, thereby paving the way for personalized medicine approaches. Precise targeting of drugs to specific cells or tissues using nanoparticles enhances patient compliance and overall treatment success.
What challenges does Advanced Drug Delivery Systems Market face during the growth?
The presence of stringent regulations is a key challenge affecting the market growth.
- Advanced drug delivery systems, which utilize polymeric nanoparticles for the treatment of various medical conditions such as diabetes and cancer, are subject to stringent regulations overseen by both domestic and international government agencies. In the United States, the Food and Drug Administration (FDA) and the Center for Medicare Services within the Department of Health and Human Services play a significant role in governing the development, testing, manufacturing, labeling, and marketing of these medical devices.
- In conclusion, compliance with these regulations is essential for manufacturers to ensure the safety and efficacy of their products. The FDA's Center for Devices and Radiological Health (CDRH) is responsible for regulating medical devices in the US, ensuring that they meet the necessary standards before being brought to market. Adherence to these regulations is crucial for manufacturers to establish trust with their customers and maintain a strong market presence.
Exclusive Customer Landscape
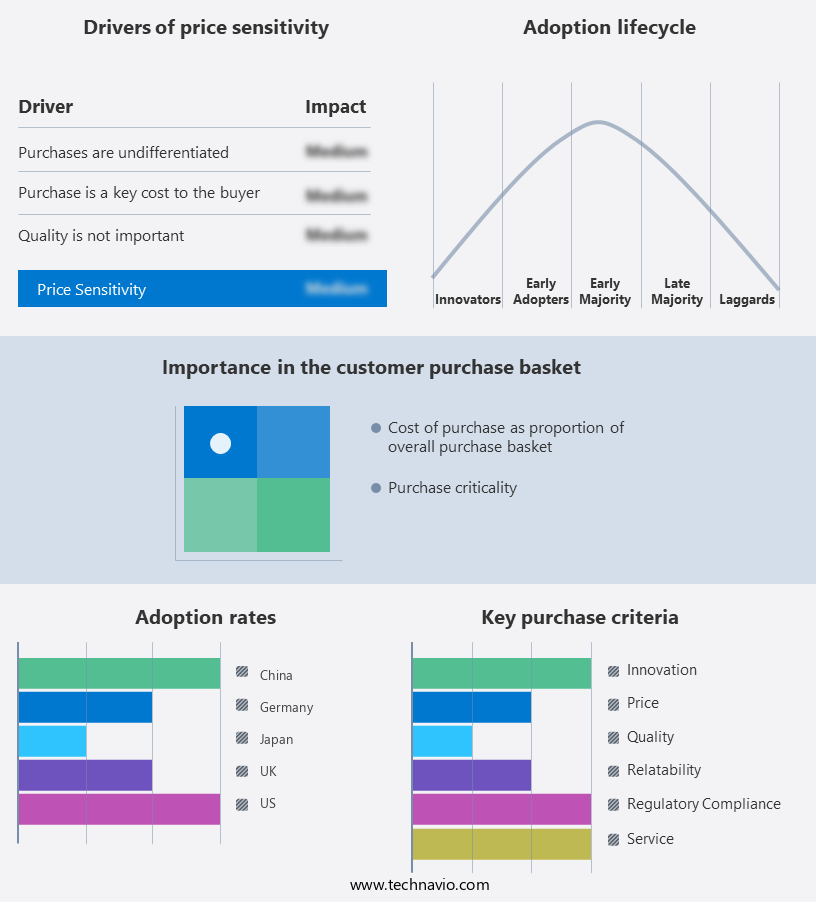
The market forecasting report includes the adoption lifecycle of the market, covering from the innovator's stage to the laggard's stage. It focuses on adoption rates in different regions based on penetration. Furthermore, the market report also includes key purchase criteria and drivers of price sensitivity to help companies evaluate and develop their market growth analysis strategies.
Customer Landscape
Key Companies & Market Insights
Companies are implementing various strategies, such as strategic alliances, market forecast, partnerships, mergers and acquisitions, geographical expansion, and product/service launches, to enhance their presence in the market. The market research and growth report includes detailed analyses of the competitive landscape of the market and information about key companies, including:
- 3M Co.
- Alfresa Holdings Corp.
- Alkermes Public Ltd. Co.
- AmerisourceBergen Corp.
- Antares Pharma Inc.
- Baxter International Inc.
- Bayer AG
- Becton Dickinson and Co.
- Cardinal Health Inc.
- Endo International Plc
- J M Smith Corp.
- NanoPass Technologies Ltd.
- Nektar Therapeutics
- Perrigo Co. Plc
- Philip Morris International Inc.
- Prodigy Health
- Surmodics Inc.
- Teva Pharmaceutical Industries Ltd.
- UCB SA
- Ypsomed Holding AG
Qualitative and quantitative analysis of companies has been conducted to help clients understand the wider business environment as well as the strengths and weaknesses of key market players. Data is qualitatively analyzed to categorize companies as pure play, category-focused, industry-focused, and diversified; it is quantitatively analyzed to categorize companies as dominant, leading, strong, tentative, and weak.
Research Analyst Overview
Advanced drug delivery systems have gained significant attention in the medical field due to their ability to improve the efficacy and safety of various therapeutic agents. These systems are designed to enhance the bioavailability of drugs, particularly those with poor water solubility or those that are susceptible to degradation in the gastrointestinal tract during oral administration. One of the most common applications of advanced drug delivery systems is in the treatment of chronic diseases such as hypertension, diabetes, and cardiovascular diseases. For instance, polymeric nanoparticles, micelles, liposomes, and lipid vesicles are used to deliver hydrophilic drugs to specific sites in the body, thereby reducing side effects and improving patient compliance.
Advanced Drug Delivery Systems (ADDS) are revolutionizing the pharmaceutical industry by addressing challenges in neurology, such as poor bioavailability, drug toxicity, and excretion issues. These innovative systems focus on improving the efficiency of oral drug delivery for peptides and other large molecules with high molecular weight. ADDS, including thin films, powders, capsules, and liquid formulations, are designed to overcome the limitations of traditional oral drug delivery systems. For instance, in the case of neurological disorders, ADDS can ensure targeted delivery to the respiratory tract or the brain, enabling failed drugs to reach their therapeutic targets. The geriatric population, who often face challenges in drug absorption and reimbursement policies, significantly benefit from these advanced systems. However, hospital regulations and government guidelines must ensure safety and efficacy, as well as consider cost-effectiveness.
ADDS can help mitigate drug toxicity and improve patient compliance by reducing dosage frequency. For example, thin film technology enables rapid absorption and onset of action, while targeted delivery systems minimize side effects. In conclusion, ADDS are transforming the pharmaceutical landscape by addressing the unique challenges of neurology and other therapeutic areas. Their potential to enhance the efficiency of oral drug delivery, reduce drug toxicity, and improve patient outcomes makes them an essential component of modern healthcare.
The Advanced Drug Delivery Systems (ADDS) market is witnessing significant growth due to the increasing demand for improved patient compliance, enhanced therapeutic efficacy, and minimized side effects. Two of the most promising areas in ADDS are thin film drug delivery and nanocarrier drug delivery. Thin film drug delivery systems offer advantages such as rapid onset, ease of administration, and improved patient compliance. Nanocarrier drug delivery, on the other hand, allows for targeted drug delivery, increased bioavailability, and reduced drug excretion.
In the field of cancer therapy, targeted drug delivery systems using nanocarriers have shown promising results in improving the efficacy of chemotherapeutic agents while minimizing their toxicity. These systems are designed to recognize and bind to specific cell membrane structures, allowing the drugs to be released only in the tumor site. Advanced drug delivery systems also play a crucial role in gene therapy, where the precise delivery of genetic material is essential for therapeutic efficacy. Self-administration of these systems is a growing trend, particularly in the treatment of chronic diseases, as it offers greater convenience and patient control. Despite their numerous benefits, advanced drug delivery systems face challenges such as high development costs, complex manufacturing processes, and potential side effects. Continuous research and innovation are required to overcome these challenges and bring new, effective, and safe drug delivery systems to the market.
|
Market Scope |
|
|
Report Coverage |
Details |
|
Page number |
170 |
|
Base year |
2023 |
|
Historic period |
2018-2022 |
|
Forecast period |
2024-2028 |
|
Growth momentum & CAGR |
Accelerate at a CAGR of 13.3% |
|
Market growth 2024-2028 |
USD 225.6 billion |
|
Market structure |
Fragmented |
|
YoY growth 2023-2024(%) |
11.3 |
|
Key countries |
US, Germany, China, UK, Japan, Brazil, France, Canada, India, and Saudi Arabia |
|
Competitive landscape |
Leading Companies, Market Positioning of Companies, Competitive Strategies, and Industry Risks |
What are the Key Data Covered in this Market Research and Growth Report?
- CAGR of the market during the forecast period
- Detailed information on factors that will drive the market growth and forecasting between 2024 and 2028
- Precise estimation of the size of the market and its contribution of the market in focus to the parent market
- Accurate predictions about upcoming market growth and trends and changes in consumer behaviour
- Growth of the market across North America, Europe, Asia, and Rest of World (ROW)
- Thorough analysis of the market's competitive landscape and detailed information about companies
- Comprehensive analysis of factors that will challenge the growth of market companies
We can help! Our analysts can customize this market research report to meet your requirements. Get in touch
 RIA -
RIA - 
