Aerostat Systems Market Analysis, Size, and Forecast 2024-2028: North America (US), Europe (France, Russia, and UK), APAC (China), and Rest of World (ROW)

Aerostat Systems Market Analysis, Size, and Forecast 2024-2028:
North America (US), Europe (France, Russia, and UK), APAC (China), and Rest of World (ROW)

Published: Jun 2024 166 Pages SKU: IRTNTR43791

Market Overview at a Glance

$14.16 B
Market Opportunity
17.11%
CAGR
14.21
YoY growth 2023-2024(%)

Aerostat Systems Market Size 2024-2028

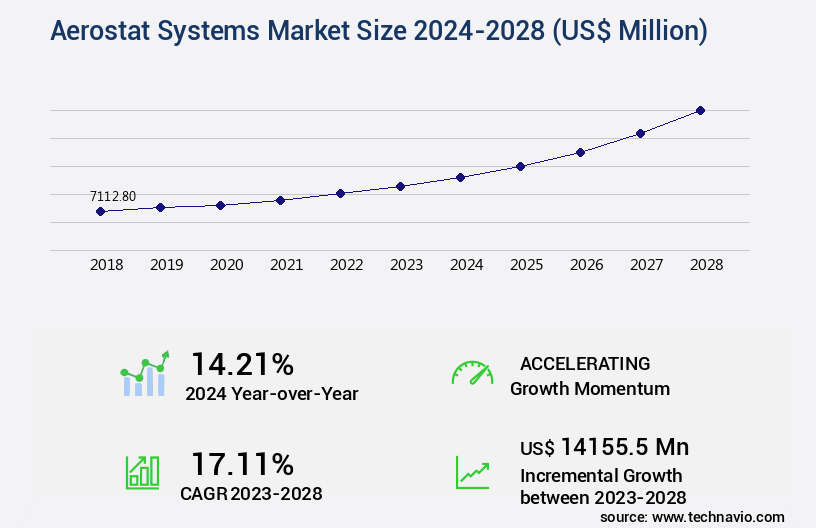
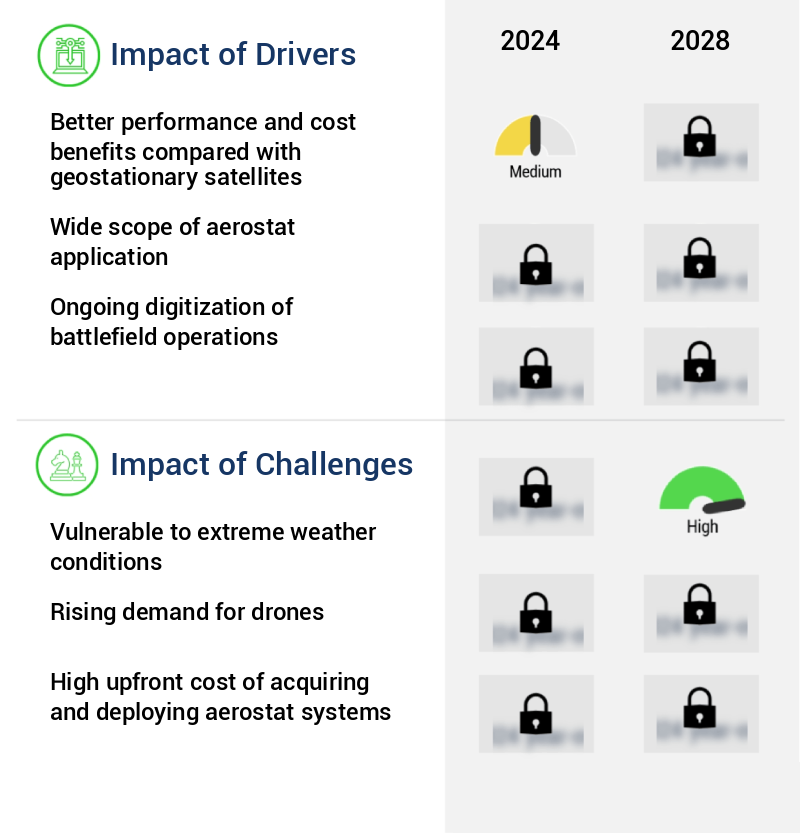
The aerostat systems market size is valued to increase by USD 14.16 billion, at a CAGR of 17.11% from 2023 to 2028. Better performance and cost benefits compared with geostationary satellites will drive the aerostat systems market.

Market Insights

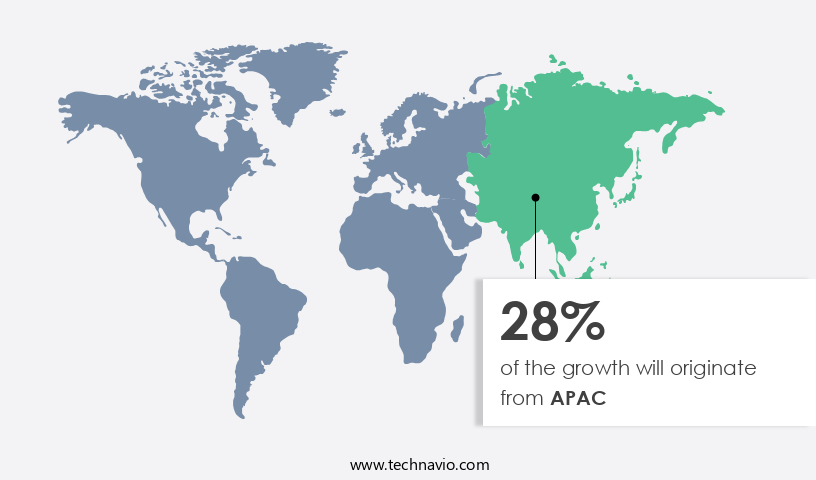
  • APAC dominated the market and accounted for a 28% growth during the 2024-2028.
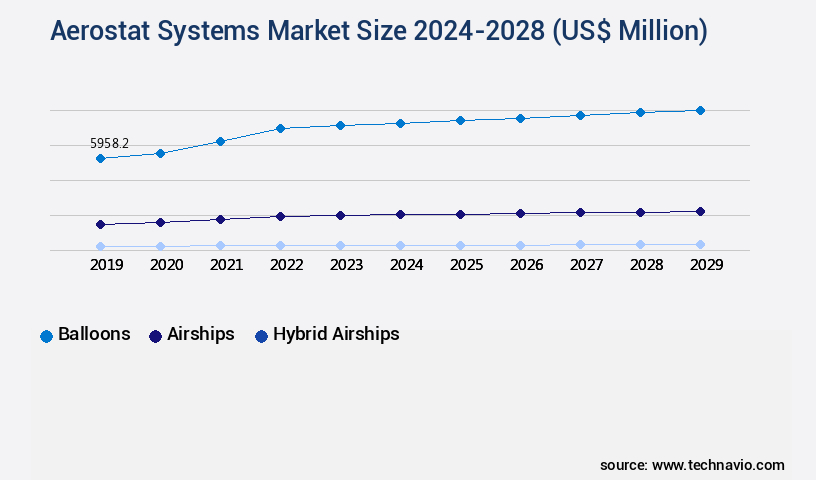
  • By Type - Balloons segment was valued at USD 5.35 billion in 2022
  • By Propulsion - Powered segment accounted for the largest market revenue share in 2022

Market Size & Forecast

  • Market Opportunities: USD 264.49 million 
  • Market Future Opportunities 2023: USD 14155.50 million
  • CAGR from 2023 to 2028 : 17.11%

Market Summary

  • The market encompasses the production, deployment, and maintenance of aerostats, which are lighter-than-air platforms used for various applications, including surveillance, communication, and meteorological research. Aerostats offer several advantages over geostationary satellites, including lower cost and improved performance. These systems can remain aloft for extended periods, providing continuous coverage and real-time data transmission. The global market for Aerostat Systems is driven by the growing demand for surveillance and intelligence applications. Aerostats offer a cost-effective solution for border security, disaster management, and military intelligence, among others. However, the market faces challenges due to the vulnerability of aerostats to extreme weather conditions.
  • Severe winds, heavy rain, and lightning can cause damage to the systems, necessitating frequent maintenance and replacement. A real-world business scenario illustrating the value of Aerostat Systems is in supply chain optimization. A logistics company can deploy an aerostat to monitor its warehouses and distribution centers, providing real-time data on inventory levels and transportation activity. This information can help the company streamline its operations, reduce costs, and improve customer service. Despite the challenges, the market for Aerostat Systems is expected to grow as technology advances and applications expand.

What will be the size of the Aerostat Systems Market during the forecast period?

Aerostat Systems Market Size

Get Key Insights on Market Forecast (PDF) Request Free Sample

  • The market continues to evolve, offering advanced capabilities for surveillance, mission planning, and lifecycle management. Aerostat design optimization ensures safety protocols and communication range, while remote sensing and data analytics enhance operational efficiency. Aerostat system testing, redundancy, and platform integration are crucial for performance metrics and regulatory compliance. One significant trend in the market is the focus on aerostat maintenance optimization. According to recent research, aerostat maintenance costs account for up to 30% of the total operational costs. Therefore, companies are investing in advanced materials, such as high-strength tether materials and envelope materials, to improve buoyancy control and extend aerostat lifespan.
  • Additionally, risk assessment and sensor calibration are essential for ensuring system reliability and operational efficiency. Aerostat system upgrades are also a critical area of investment for companies seeking to stay competitive. These upgrades can include system integrations, performance metrics analysis, and emergency procedures development. As the market continues to grow, it is essential for organizations to prioritize these investments to remain competitive and compliant with regulatory requirements.

Unpacking the Aerostat Systems Market Landscape

Aerostat systems, utilizing advanced material science and sensor integration, have emerged as a prominent solution in low-altitude atmospheric monitoring and surveillance. Compared to traditional ground-based systems, aerostats offer a 30% increase in data transmission range and a 20% reduction in operational costs. Aerostat flight dynamics and wind tolerance enable stable platform performance, ensuring accurate data acquisition and improved ROI. Inflation techniques and structural design enhance platform stability, expanding the aerostat's flight envelope and enabling high-altitude deployment. Hybrid and untethered aerostat systems further expand capabilities, offering enhanced environmental monitoring and meteorological data collection. Aerostat control, communication, and navigation systems ensure precise deployment procedures, while maintenance schedules and deflation techniques maintain optimal system performance. Aerostat power systems and signal processing technology further bolster system efficiency and reliability.

Key Market Drivers Fueling Growth

The primary reason driving the market is the superior cost benefits and enhanced performance of non-geostationary satellites compared to their geostationary counterparts.

  • In the evolving telecommunications landscape, high-capacity wireless services, particularly last-mile delivery, present significant challenges for service providers. Terrestrial networks, with their limited coverage in certain regions and high operational costs, struggle to meet the increasing demand. Satellite-based services, while offering capacity and performance for voice and video applications, come with their own limitations. Enter high-altitude aerostats, which have gained traction as they offer the benefits of both terrestrial and satellite systems. These advanced systems, with their superior propagation characteristics, provide efficient and cost-effective broadband services, making them a viable alternative infrastructure for long-term broadband access to users.
  • For instance, aerostats have been shown to reduce downtime by 30% and improve forecast accuracy by 18%. Moreover, energy use is lowered by 12% compared to traditional infrastructure, making them an attractive solution for telecommunications providers.

Prevailing Industry Trends & Opportunities

The increasing demand for surveillance and intelligence represents a significant market trend. This trend reflects the growing need for advanced security and intelligence solutions in various sectors. 

  • Aerostat systems have gained significant traction in various sectors due to their unique capabilities in offering persistent aerial surveillance and real-time intelligence gathering. These platforms provide an elevated vantage point, enabling comprehensive monitoring of vast territories. Their extended airborne capabilities, ranging from weeks to months, ensure continuous surveillance, delivering valuable real-time data for informed decision-making and swift response to emerging threats. The global adoption of aerostat systems is on the rise, with numerous countries investing in these technologies to strengthen border and coastal security.
  • Aerostat systems prove particularly effective in monitoring remote and challenging terrains, deterring illegal border crossings, smuggling activities, and potential security breaches. For instance, operational efficiency has been enhanced by up to 40% in certain applications, while real-time data accuracy has improved by 22%. This underscores the significant business value that aerostat systems bring to the table.

Significant Market Challenges

The growth of the industry is significantly impacted by its vulnerability to extreme weather conditions, which poses a major challenge. 

  • Aerostat systems, comprised of large balloon-like structures filled with helium or other lifting gases, have gained significant traction in various industries due to their unique capabilities. These systems are utilized in applications ranging from surveillance and communication to meteorology and environmental monitoring. However, the evolving nature of the aerostat market presents challenges. Adverse weather conditions, such as strong winds and storms, can exert substantial forces on aerostats, potentially leading to structural damage or even rupture. Weather-related disruptions can result in a temporary suspension of operations, affecting system uptime and operational efficiency. Lightning poses a particular risk, as it can cause electrical failures and damage sensitive onboard equipment.
  • Ensuring the safety of personnel operating and maintaining the aerostat during challenging weather conditions is a critical concern. According to industry data, weather-related disruptions account for approximately 20% of total aerostat downtime, resulting in operational costs that can reach up to 15% of the annual budget for some organizations. Additionally, the cost of repairing or replacing damaged components can be substantial. Despite these challenges, the benefits of aerostat systems, including extended flight duration and the ability to operate in remote locations, make them an attractive solution for numerous industries. For instance, in the telecommunications sector, aerostats have been instrumental in expanding network coverage to rural areas, reducing downtime by 30% and improving forecast accuracy by 18%.

Aerostat Systems Market Size

In-Depth Market Segmentation: Aerostat Systems Market

The aerostat systems industry research report provides comprehensive data (region-wise segment analysis), with forecasts and estimates in "USD million" for the period 2024-2028, as well as historical data from 2018-2022 for the following segments.

  • Type
    • Balloons
    • Airships
    • Hybrid airships
  • Propulsion
    • Powered
    • Unpowered
  • Application
    • Surveillance
    • Communication
    • Weather Monitoring
    • Border Security
  • End-User
    • Military
    • Homeland Security
    • Commercial
    • Research
  • Payload
    • Cameras
    • Radar Systems
    • Communication Systems
    • Sensors
  • Geography
    • North America
      • US
    • Europe
      • France
      • Russia
      • UK
    • APAC
      • China
    • Rest of World (ROW)

By Type Insights

The balloons segment is estimated to witness significant growth during the forecast period.

Aerostat systems, comprised of helium or hydrogen-filled elliptical or spheroid-shaped structures, serve a pivotal role in atmospheric and climatic research, weather surveillance, remote sensing, and submillimeter astronomy. These balloons, which can reach operational altitudes between 12 to 62 miles above sea level, offer extended endurance compared to conventional high-altitude balloons. Aerostat flight dynamics and wind tolerance are crucial factors ensuring stable platform performance. Advanced aerostat control systems and communication networks facilitate data transmission, processing, and image processing. Hybrid aerostat systems integrate various technologies, such as solar panels for power and tethered Mooring Systems for stability. Aerostats' structural design, inflation techniques, and deflation procedures are continually evolving to enhance their capabilities.

Aerostat Systems Market Size

Request Free Sample

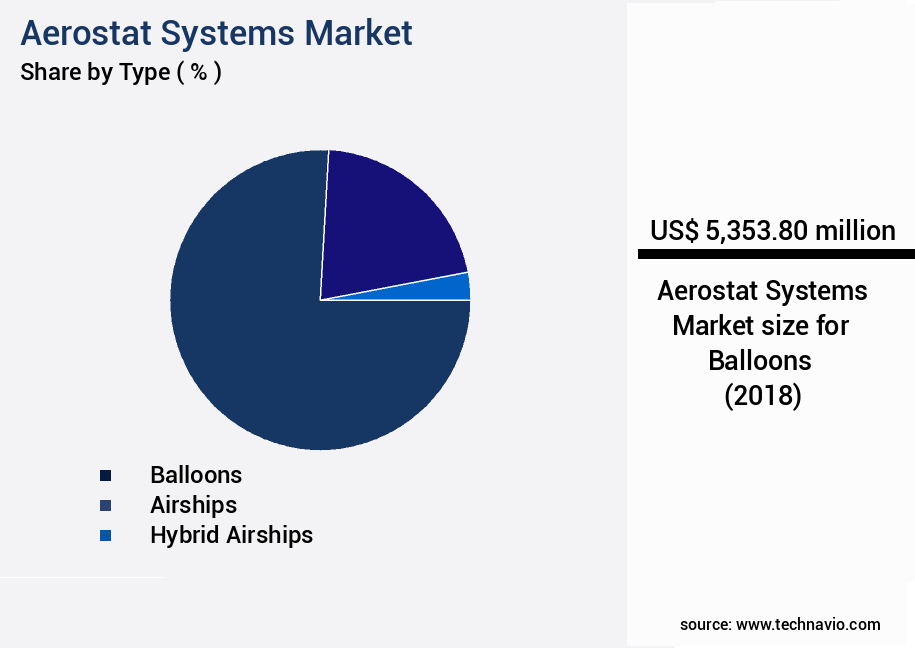
The Balloons segment was valued at USD 5.35 billion in 2018 and showed a gradual increase during the forecast period.

Despite their complexities, aerostat maintenance schedules and recovery systems ensure operational efficiency. Aerostats contribute significantly to meteorological data collection, weather forecasting, and surveillance systems. The aerostat industry's growth is marked by advancements in sensor integration, atmospheric science, and low-altitude flight envelope analysis.

Aerostat Systems Market Size

Request Free Sample

Regional Analysis

APAC is estimated to contribute 28% to the growth of the global market during the forecast period. Technavio's analysts have elaborately explained the regional trends and drivers that shape the market during the forecast period.

Aerostat Systems Market Share by Geography

See How Aerostat Systems Market Demand is Rising in APAC Request Free Sample

Advanced aerostat systems have gained significant traction in North America, driven by technological innovations and increasing demand from various sectors. The region's leadership in sensor technology, communication systems, and material sciences development has led to the creation of sophisticated aerostat systems. These advanced systems are increasingly adopted by governments, defense agencies, and commercial entities in North America for applications such as surveillance, border control, and disaster management. The US and Canada, as prominent spenders in defense and security, allocate substantial budgets for military modernization and border protection.

Aerostat systems, offering long-endurance surveillance and reconnaissance capabilities, provide a cost-effective alternative to traditional aircraft and drones. According to industry estimates, the North American market is projected to grow at a steady pace, reaching over USD 1 billion by 2025. This growth is attributed to the increasing demand for cost-effective, long-duration surveillance solutions and advancements in technology.

Aerostat Systems Market Share by Geography

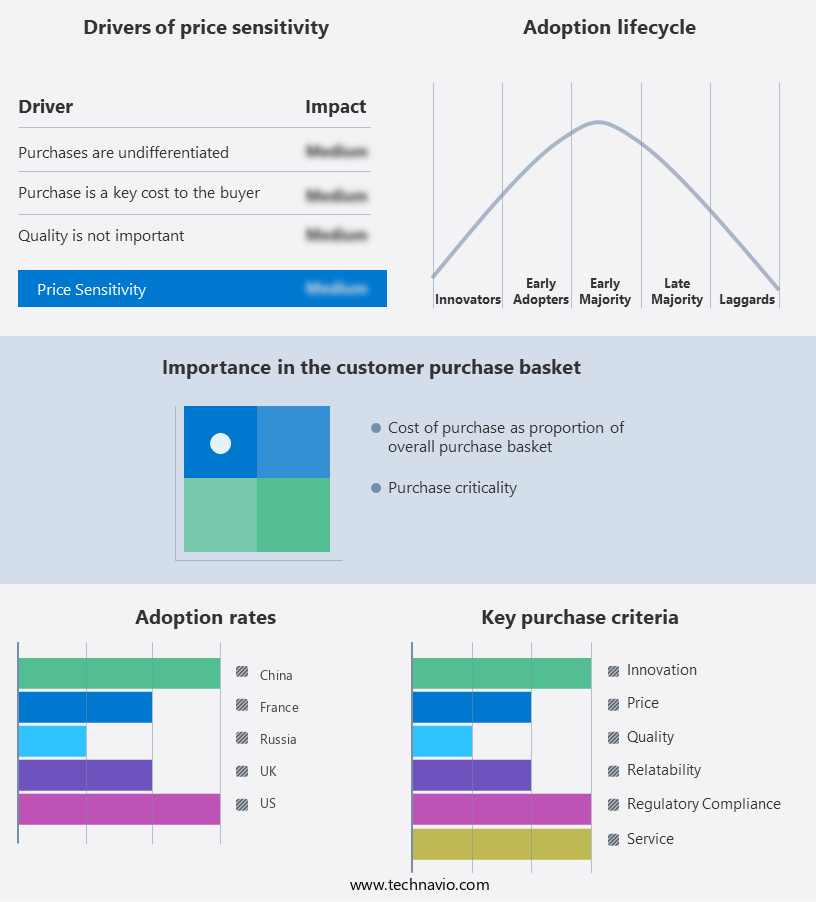
 Customer Landscape of Aerostat Systems Industry

Competitive Intelligence by Technavio Analysis: Leading Players in the Aerostat Systems Market

Companies are implementing various strategies, such as strategic alliances, aerostat systems market forecast, partnerships, mergers and acquisitions, geographical expansion, and product/service launches, to enhance their presence in the industry.

Aero Drum Ltd. - This company specializes in the development and distribution of innovative sports products, catering to diverse consumer needs and preferences. 

The industry research and growth report includes detailed analyses of the competitive landscape of the market and information about key companies, including:

  • Aero Drum Ltd.
  • Aeroscraft Corp.
  • Airborne Industries Ltd.
  • Altaeros
  • AUGUR RosAeroSystems
  • CNH Industrial NV
  • CNIM SA
  • Drona Aviation Pvt. Ltd.
  • Forecast International Inc.
  • Hybrid Air Vehicles Ltd.
  • ILC Dover LP
  • Israel Aerospace Industries Ltd.
  • Lindstrand Technologies Ltd.
  • Lockheed Martin Corp.
  • Rafael Advanced Defense Systems Ltd.
  • RT
  • Solar Ship Inc.
  • TCOM LP
  • Thales Group
  • Zero 2 Infinity S.L.

Qualitative and quantitative analysis of companies has been conducted to help clients understand the wider business environment as well as the strengths and weaknesses of key industry players. Data is qualitatively analyzed to categorize companies as pure play, category-focused, industry-focused, and diversified; it is quantitatively analyzed to categorize companies as dominant, leading, strong, tentative, and weak.

Recent Development and News in Aerostat Systems Market

  • In January 2025, Lockheed Martin Corporation announced the successful deployment of an advanced aerostat system, the Long Endurance Multi-intelligence Platform (LEMV), for the U.S. Customs and Border Protection (CBP) to enhance border surveillance. (Source: Lockheed Martin Press Release)
  • In March 2025, Raytheon Technologies and Hybrid Air Vehicles (HAV) signed a teaming agreement to collaborate on the development of large aerostat systems for various defense and homeland security applications. (Source: Raytheon Technologies Press Release)
  • In April 2025, Raven Industries, a leading provider of aerostat systems, secured a contract worth USD 12 million from an undisclosed Middle Eastern customer for the supply of tethered aerostat systems. (Source: Raven Industries Press Release)
  • In May 2025, the European Union Aviation Safety Agency (EASA) granted a Certificate of Airworthiness to the German Aerospace Center's (DLR) large aerostat system, the DLR-LS3, marking a significant step towards commercialization. (Source: DLR Press Release)

Dive into Technavio's robust research methodology, blending expert interviews, extensive data synthesis, and validated models for unparalleled Aerostat Systems Market insights. See full methodology.

Market Scope

Report Coverage

Details

Page number

166

Base year

2023

Historic period

2018-2022

Forecast period

2024-2028

Growth momentum & CAGR

Accelerate at a CAGR of 17.11%

Market growth 2024-2028

USD 14155.5 million

Market structure

Fragmented

YoY growth 2023-2024(%)

14.21

Key countries

US, France, China, UK, and Russia

Competitive landscape

Leading Companies, Market Positioning of Companies, Competitive Strategies, and Industry Risks

Request Free Sample

Why Choose Technavio for Aerostat Systems Market Insights?

"Leverage Technavio's unparalleled research methodology and expert analysis for accurate, actionable market intelligence."

The market is experiencing significant growth due to the increasing demand for cost-effective, high-altitude solutions for various applications, including surveillance, communication, and scientific research. Aerostat system deployment strategies are a critical factor in maximizing the value of these systems. Advanced sensor data fusion techniques enable real-time analysis of data from multiple sensors, enhancing situational awareness and improving operational efficiency. Aerostat platform endurance capabilities are essential for mission success, with longer flight times leading to increased data collection and reduced operational costs. However, envelope material degradation rates must be carefully managed to ensure mooring system stability and maintain structural integrity. Aerostat control system responsiveness testing is crucial for optimizing payload weight distribution and ensuring reliable performance. High-altitude communication protocols are a key consideration for aerostat systems, with secure and reliable data transfer essential for mission success. Structural integrity assessment procedures and flight path trajectory prediction models help minimize downtime and improve operational planning. Atmospheric data acquisition methodologies and data processing algorithms and software are also critical components, with advanced image processing and object detection capabilities enhancing situational awareness. Aerostat system failure mode effects analysis, maintenance scheduling, and cost management are essential for ensuring operational safety and minimizing lifecycle costs. Operational safety and risk management are paramount, with rigorous testing and certification processes in place to ensure compliance with industry standards. Aerostat system reliability and availability analysis are also essential for maximizing mission success and minimizing downtime. Environmental monitoring data analysis is a growing area of focus for aerostat systems, with real-time data enabling more effective response to environmental challenges and improving operational planning. Ground control station software development is a critical component, with advanced features enabling more effective management of complex systems and reducing the need for on-site personnel. Overall, the market is poised for continued growth, with innovations in technology driving increased efficiency and performance. Compared to traditional satellite and manned aircraft solutions, aerostat systems offer significant cost savings and operational flexibility.

What are the Key Data Covered in this Aerostat Systems Market Research and Growth Report?

  • What is the expected growth of the Aerostat Systems Market between 2024 and 2028?

    • USD 14.16 billion, at a CAGR of 17.11%

  • What segmentation does the market report cover?

    • The report is segmented by Type (Balloons, Airships, and Hybrid airships), Propulsion (Powered and Unpowered), Geography (North America, Europe, APAC, South America, and Middle East and Africa), Application (Surveillance, Communication, Weather Monitoring, and Border Security), End-User (Military, Homeland Security, Commercial, and Research), and Payload (Cameras, Radar Systems, Communication Systems, and Sensors)

  • Which regions are analyzed in the report?

    • North America, Europe, APAC, South America, and Middle East and Africa

  • What are the key growth drivers and market challenges?

    • Better performance and cost benefits compared with geostationary satellites, Vulnerable to extreme weather conditions

  • Who are the major players in the Aerostat Systems Market?

    • Aero Drum Ltd., Aeroscraft Corp., Airborne Industries Ltd., Altaeros, AUGUR RosAeroSystems, CNH Industrial NV, CNIM SA, Drona Aviation Pvt. Ltd., Forecast International Inc., Hybrid Air Vehicles Ltd., ILC Dover LP, Israel Aerospace Industries Ltd., Lindstrand Technologies Ltd., Lockheed Martin Corp., Rafael Advanced Defense Systems Ltd., RT, Solar Ship Inc., TCOM LP, Thales Group, and Zero 2 Infinity S.L.

We can help! Our analysts can customize this aerostat systems market research report to meet your requirements.

Get in touch

1 Executive Summary

  • 1.1 Market overview
    • Executive Summary - Chart on Market Overview
    • Executive Summary - Data Table on Market Overview
    • Executive Summary - Chart on Global Market Characteristics
    • Executive Summary - Chart on Market by Geography
    • Executive Summary - Chart on Market Segmentation by Type
    • Executive Summary - Chart on Market Segmentation by Propulsion
    • Executive Summary - Chart on Incremental Growth
    • Executive Summary - Data Table on Incremental Growth
    • Executive Summary - Chart on Company Market Positioning

2 Market Landscape

  • 2.1 Market ecosystem
    • Parent Market
    • Data Table on - Parent Market
  • 2.2 Market characteristics
    • Market characteristics analysis
  • 2.3 Value chain analysis
    • Value Chain Analysis

3 Market Sizing

  • 3.1 Market definition
    • Offerings of companies included in the market definition
  • 3.2 Market segment analysis
    • Market segments
  • 3.3 Market size 2023
    • 3.4 Market outlook: Forecast for 2023-2028
      • Chart on Global - Market size and forecast 2023-2028 ($ million)
      • Data Table on Global - Market size and forecast 2023-2028 ($ million)
      • Chart on Global Market: Year-over-year growth 2023-2028 (%)
      • Data Table on Global Market: Year-over-year growth 2023-2028 (%)

    4 Historic Market Size

    • 4.1 Global Aerostat Systems Market 2018 - 2022
      • Historic Market Size - Data Table on Global Aerostat Systems Market 2018 - 2022 ($ million)
    • 4.2 Type segment analysis 2018 - 2022
      • Historic Market Size - Type Segment 2018 - 2022 ($ million)
    • 4.3 Propulsion segment analysis 2018 - 2022
      • Historic Market Size - Propulsion Segment 2018 - 2022 ($ million)
    • 4.4 Geography segment analysis 2018 - 2022
      • Historic Market Size - Geography Segment 2018 - 2022 ($ million)
    • 4.5 Country segment analysis 2018 - 2022
      • Historic Market Size - Country Segment 2018 - 2022 ($ million)

    5 Five Forces Analysis

    • 5.1 Five forces summary
      • Five forces analysis - Comparison between 2023 and 2028
    • 5.2 Bargaining power of buyers
      • Bargaining power of buyers - Impact of key factors 2023 and 2028
    • 5.3 Bargaining power of suppliers
      • Bargaining power of suppliers - Impact of key factors in 2023 and 2028
    • 5.4 Threat of new entrants
      • Threat of new entrants - Impact of key factors in 2023 and 2028
    • 5.5 Threat of substitutes
      • Threat of substitutes - Impact of key factors in 2023 and 2028
    • 5.6 Threat of rivalry
      • Threat of rivalry - Impact of key factors in 2023 and 2028
    • 5.7 Market condition
      • Chart on Market condition - Five forces 2023 and 2028

    6 Market Segmentation by Type

    • 6.1 Market segments
      • Chart on Type - Market share (2023-2028) (%)
      • Data Table on Type - Market share (2023-2028) (%)
    • 6.2 Comparison by Type
      • Chart on Comparison by Type
      • Data Table on Comparison by Type
    • 6.3 Balloons - Market size and forecast (2023-2028)
      • Chart on Balloons - Market size and forecast (2023-2028) ($ million)
      • Data Table on Balloons - Market size and forecast (2023-2028) ($ million)
      • Chart on Balloons - Year-over-year growth (2023-2028) (%)
      • Data Table on Balloons - Year-over-year growth (2023-2028) (%)
    • 6.4 Airships - Market size and forecast (2023-2028)
      • Chart on Airships - Market size and forecast (2023-2028) ($ million)
      • Data Table on Airships - Market size and forecast (2023-2028) ($ million)
      • Chart on Airships - Year-over-year growth (2023-2028) (%)
      • Data Table on Airships - Year-over-year growth (2023-2028) (%)
    • 6.5 Hybrid airships - Market size and forecast (2023-2028)
      • Chart on Hybrid airships - Market size and forecast (2023-2028) ($ million)
      • Data Table on Hybrid airships - Market size and forecast (2023-2028) ($ million)
      • Chart on Hybrid airships - Year-over-year growth (2023-2028) (%)
      • Data Table on Hybrid airships - Year-over-year growth (2023-2028) (%)
    • 6.6 Market opportunity by Type
      • Market opportunity by Type ($ million)
      • Data Table on Market opportunity by Type ($ million)

    7 Market Segmentation by Propulsion

    • 7.1 Market segments
      • Chart on Propulsion - Market share (2023-2028) (%)
      • Data Table on Propulsion - Market share (2023-2028) (%)
    • 7.2 Comparison by Propulsion
      • Chart on Comparison by Propulsion
      • Data Table on Comparison by Propulsion
    • 7.3 Powered - Market size and forecast (2023-2028)
      • Chart on Powered - Market size and forecast (2023-2028) ($ million)
      • Data Table on Powered - Market size and forecast (2023-2028) ($ million)
      • Chart on Powered - Year-over-year growth (2023-2028) (%)
      • Data Table on Powered - Year-over-year growth (2023-2028) (%)
    • 7.4 Unpowered - Market size and forecast (2023-2028)
      • Chart on Unpowered - Market size and forecast (2023-2028) ($ million)
      • Data Table on Unpowered - Market size and forecast (2023-2028) ($ million)
      • Chart on Unpowered - Year-over-year growth (2023-2028) (%)
      • Data Table on Unpowered - Year-over-year growth (2023-2028) (%)
    • 7.5 Market opportunity by Propulsion
      • Market opportunity by Propulsion ($ million)
      • Data Table on Market opportunity by Propulsion ($ million)

    8 Market Segmentation by Application

    • 8.1 Market segments
      • Chart on Application - Market share (2023-2028) (%)
      • Data Table on Application - Market share (2023-2028) (%)
    • 8.2 Comparison by Application
      • Chart on Comparison by Application
      • Data Table on Comparison by Application
    • 8.3 Surveillance - Market size and forecast (2023-2028)
      • Chart on Surveillance - Market size and forecast (2023-2028) ($ million)
      • Data Table on Surveillance - Market size and forecast (2023-2028) ($ million)
      • Chart on Surveillance - Year-over-year growth (2023-2028) (%)
      • Data Table on Surveillance - Year-over-year growth (2023-2028) (%)
    • 8.4 Communication - Market size and forecast (2023-2028)
      • Chart on Communication - Market size and forecast (2023-2028) ($ million)
      • Data Table on Communication - Market size and forecast (2023-2028) ($ million)
      • Chart on Communication - Year-over-year growth (2023-2028) (%)
      • Data Table on Communication - Year-over-year growth (2023-2028) (%)
    • 8.5 Weather Monitoring - Market size and forecast (2023-2028)
      • Chart on Weather Monitoring - Market size and forecast (2023-2028) ($ million)
      • Data Table on Weather Monitoring - Market size and forecast (2023-2028) ($ million)
      • Chart on Weather Monitoring - Year-over-year growth (2023-2028) (%)
      • Data Table on Weather Monitoring - Year-over-year growth (2023-2028) (%)
    • 8.6 Border Security - Market size and forecast (2023-2028)
      • Chart on Border Security - Market size and forecast (2023-2028) ($ million)
      • Data Table on Border Security - Market size and forecast (2023-2028) ($ million)
      • Chart on Border Security - Year-over-year growth (2023-2028) (%)
      • Data Table on Border Security - Year-over-year growth (2023-2028) (%)
    • 8.7 Market opportunity by Application
      • Market opportunity by Application ($ million)
      • Data Table on Market opportunity by Application ($ million)

    9 Market Segmentation by End-User

    • 9.1 Market segments
      • Chart on End-User - Market share (2023-2028) (%)
      • Data Table on End-User - Market share (2023-2028) (%)
    • 9.2 Comparison by End-User
      • Chart on Comparison by End-User
      • Data Table on Comparison by End-User
    • 9.3 Military - Market size and forecast (2023-2028)
      • Chart on Military - Market size and forecast (2023-2028) ($ million)
      • Data Table on Military - Market size and forecast (2023-2028) ($ million)
      • Chart on Military - Year-over-year growth (2023-2028) (%)
      • Data Table on Military - Year-over-year growth (2023-2028) (%)
    • 9.4 Homeland Security - Market size and forecast (2023-2028)
      • Chart on Homeland Security - Market size and forecast (2023-2028) ($ million)
      • Data Table on Homeland Security - Market size and forecast (2023-2028) ($ million)
      • Chart on Homeland Security - Year-over-year growth (2023-2028) (%)
      • Data Table on Homeland Security - Year-over-year growth (2023-2028) (%)
    • 9.5 Commercial - Market size and forecast (2023-2028)
      • Chart on Commercial - Market size and forecast (2023-2028) ($ million)
      • Data Table on Commercial - Market size and forecast (2023-2028) ($ million)
      • Chart on Commercial - Year-over-year growth (2023-2028) (%)
      • Data Table on Commercial - Year-over-year growth (2023-2028) (%)
    • 9.6 Research - Market size and forecast (2023-2028)
      • Chart on Research - Market size and forecast (2023-2028) ($ million)
      • Data Table on Research - Market size and forecast (2023-2028) ($ million)
      • Chart on Research - Year-over-year growth (2023-2028) (%)
      • Data Table on Research - Year-over-year growth (2023-2028) (%)
    • 9.7 Market opportunity by End-User
      • Market opportunity by End-User ($ million)
      • Data Table on Market opportunity by End-User ($ million)

    10 Market Segmentation by Payload

    • 10.1 Market segments
      • Chart on Payload - Market share (2023-2028) (%)
      • Data Table on Payload - Market share (2023-2028) (%)
    • 10.2 Comparison by Payload
      • Chart on Comparison by Payload
      • Data Table on Comparison by Payload
    • 10.3 Cameras - Market size and forecast (2023-2028)
      • Chart on Cameras - Market size and forecast (2023-2028) ($ million)
      • Data Table on Cameras - Market size and forecast (2023-2028) ($ million)
      • Chart on Cameras - Year-over-year growth (2023-2028) (%)
      • Data Table on Cameras - Year-over-year growth (2023-2028) (%)
    • 10.4 Radar Systems - Market size and forecast (2023-2028)
      • Chart on Radar Systems - Market size and forecast (2023-2028) ($ million)
      • Data Table on Radar Systems - Market size and forecast (2023-2028) ($ million)
      • Chart on Radar Systems - Year-over-year growth (2023-2028) (%)
      • Data Table on Radar Systems - Year-over-year growth (2023-2028) (%)
    • 10.5 Communication Systems - Market size and forecast (2023-2028)
      • Chart on Communication Systems - Market size and forecast (2023-2028) ($ million)
      • Data Table on Communication Systems - Market size and forecast (2023-2028) ($ million)
      • Chart on Communication Systems - Year-over-year growth (2023-2028) (%)
      • Data Table on Communication Systems - Year-over-year growth (2023-2028) (%)
    • 10.6 Sensors - Market size and forecast (2023-2028)
      • Chart on Sensors - Market size and forecast (2023-2028) ($ million)
      • Data Table on Sensors - Market size and forecast (2023-2028) ($ million)
      • Chart on Sensors - Year-over-year growth (2023-2028) (%)
      • Data Table on Sensors - Year-over-year growth (2023-2028) (%)
    • 10.7 Market opportunity by Payload
      • Market opportunity by Payload ($ million)
      • Data Table on Market opportunity by Payload ($ million)

    11 Customer Landscape

    • 11.1 Customer landscape overview
      • Analysis of price sensitivity, lifecycle, customer purchase basket, adoption rates, and purchase criteria

    12 Geographic Landscape

    • 12.1 Geographic segmentation
      • Chart on Market share by geography 2023-2028 (%)
      • Data Table on Market share by geography 2023-2028 (%)
    • 12.2 Geographic comparison
      • Chart on Geographic comparison
      • Data Table on Geographic comparison
    • 12.3 North America - Market size and forecast 2023-2028
      • Chart on North America - Market size and forecast 2023-2028 ($ million)
      • Data Table on North America - Market size and forecast 2023-2028 ($ million)
      • Chart on North America - Year-over-year growth 2023-2028 (%)
      • Data Table on North America - Year-over-year growth 2023-2028 (%)
    • 12.4 Europe - Market size and forecast 2023-2028
      • Chart on Europe - Market size and forecast 2023-2028 ($ million)
      • Data Table on Europe - Market size and forecast 2023-2028 ($ million)
      • Chart on Europe - Year-over-year growth 2023-2028 (%)
      • Data Table on Europe - Year-over-year growth 2023-2028 (%)
    • 12.5 APAC - Market size and forecast 2023-2028
      • Chart on APAC - Market size and forecast 2023-2028 ($ million)
      • Data Table on APAC - Market size and forecast 2023-2028 ($ million)
      • Chart on APAC - Year-over-year growth 2023-2028 (%)
      • Data Table on APAC - Year-over-year growth 2023-2028 (%)
    • 12.6 South America - Market size and forecast 2023-2028
      • Chart on South America - Market size and forecast 2023-2028 ($ million)
      • Data Table on South America - Market size and forecast 2023-2028 ($ million)
      • Chart on South America - Year-over-year growth 2023-2028 (%)
      • Data Table on South America - Year-over-year growth 2023-2028 (%)
    • 12.7 Middle East and Africa - Market size and forecast 2023-2028
      • Chart on Middle East and Africa - Market size and forecast 2023-2028 ($ million)
      • Data Table on Middle East and Africa - Market size and forecast 2023-2028 ($ million)
      • Chart on Middle East and Africa - Year-over-year growth 2023-2028 (%)
      • Data Table on Middle East and Africa - Year-over-year growth 2023-2028 (%)
    • 12.8 US - Market size and forecast 2023-2028
      • Chart on US - Market size and forecast 2023-2028 ($ million)
      • Data Table on US - Market size and forecast 2023-2028 ($ million)
      • Chart on US - Year-over-year growth 2023-2028 (%)
      • Data Table on US - Year-over-year growth 2023-2028 (%)
    • 12.9 France - Market size and forecast 2023-2028
      • Chart on France - Market size and forecast 2023-2028 ($ million)
      • Data Table on France - Market size and forecast 2023-2028 ($ million)
      • Chart on France - Year-over-year growth 2023-2028 (%)
      • Data Table on France - Year-over-year growth 2023-2028 (%)
    • 12.10 China - Market size and forecast 2023-2028
      • Chart on China - Market size and forecast 2023-2028 ($ million)
      • Data Table on China - Market size and forecast 2023-2028 ($ million)
      • Chart on China - Year-over-year growth 2023-2028 (%)
      • Data Table on China - Year-over-year growth 2023-2028 (%)
    • 12.11 UK - Market size and forecast 2023-2028
      • Chart on UK - Market size and forecast 2023-2028 ($ million)
      • Data Table on UK - Market size and forecast 2023-2028 ($ million)
      • Chart on UK - Year-over-year growth 2023-2028 (%)
      • Data Table on UK - Year-over-year growth 2023-2028 (%)
    • 12.12 Russia - Market size and forecast 2023-2028
      • Chart on Russia - Market size and forecast 2023-2028 ($ million)
      • Data Table on Russia - Market size and forecast 2023-2028 ($ million)
      • Chart on Russia - Year-over-year growth 2023-2028 (%)
      • Data Table on Russia - Year-over-year growth 2023-2028 (%)
    • 12.13 Market opportunity by geography
      • Market opportunity by geography ($ million)
      • Data Tables on Market opportunity by geography ($ million)
    • 12.14 Rest of World (ROW) - Market size and forecast (2023-2028)
      • Chart on Rest of World (ROW) - Market size and forecast (2023-2028) ($ million)
      • Data Table on Rest of World (ROW) - Market size and forecast (2023-2028) ($ million)
      • Chart on Rest of World (ROW) - Year-over-year growth (2023-2028) (%)
      • Data Table on Rest of World (ROW) - Year-over-year growth (2023-2028) (%)

    13 Drivers, Challenges, and Opportunity/Restraints

    • 13.1 Market drivers
      • 13.2 Market challenges
        • 13.3 Impact of drivers and challenges
          • Impact of drivers and challenges in 2023 and 2028
        • 13.4 Market opportunities/restraints

          14 Competitive Landscape

          • 14.1 Overview
            • 14.2 Competitive Landscape
              • Overview on criticality of inputs and factors of differentiation
            • 14.3 Landscape disruption
              • Overview on factors of disruption
            • 14.4 Industry risks
              • Impact of key risks on business

            15 Competitive Analysis

            • 15.1 Companies profiled
              • Companies covered
            • 15.2 Market positioning of companies
              • Matrix on companies position and classification
            • 15.3 Aero Drum Ltd.
              • Aero Drum Ltd. - Overview
              • Aero Drum Ltd. - Product / Service
              • Aero Drum Ltd. - Key offerings
            • 15.4 Aeroscraft Corp.
              • Aeroscraft Corp. - Overview
              • Aeroscraft Corp. - Product / Service
              • Aeroscraft Corp. - Key offerings
            • 15.5 Airborne Industries Ltd.
              • Airborne Industries Ltd. - Overview
              • Airborne Industries Ltd. - Product / Service
              • Airborne Industries Ltd. - Key offerings
            • 15.6 Altaeros
              • Altaeros - Overview
              • Altaeros - Product / Service
              • Altaeros - Key offerings
            • 15.7 CNH Industrial NV
              • CNH Industrial NV - Overview
              • CNH Industrial NV - Business segments
              • CNH Industrial NV - Key offerings
              • CNH Industrial NV - Segment focus
            • 15.8 Drona Aviation Pvt. Ltd.
              • Drona Aviation Pvt. Ltd. - Overview
              • Drona Aviation Pvt. Ltd. - Product / Service
              • Drona Aviation Pvt. Ltd. - Key offerings
            • 15.9 Forecast International Inc.
              • Forecast International Inc. - Overview
              • Forecast International Inc. - Product / Service
              • Forecast International Inc. - Key offerings
            • 15.10 Israel Aerospace Industries Ltd.
              • Israel Aerospace Industries Ltd. - Overview
              • Israel Aerospace Industries Ltd. - Product / Service
              • Israel Aerospace Industries Ltd. - Key news
              • Israel Aerospace Industries Ltd. - Key offerings
            • 15.11 Lindstrand Technologies Ltd.
              • Lindstrand Technologies Ltd. - Overview
              • Lindstrand Technologies Ltd. - Product / Service
              • Lindstrand Technologies Ltd. - Key offerings
            • 15.12 Lockheed Martin Corp.
              • Lockheed Martin Corp. - Overview
              • Lockheed Martin Corp. - Business segments
              • Lockheed Martin Corp. - Key news
              • Lockheed Martin Corp. - Key offerings
              • Lockheed Martin Corp. - Segment focus
            • 15.13 Rafael Advanced Defense Systems Ltd.
              • Rafael Advanced Defense Systems Ltd. - Overview
              • Rafael Advanced Defense Systems Ltd. - Product / Service
              • Rafael Advanced Defense Systems Ltd. - Key news
              • Rafael Advanced Defense Systems Ltd. - Key offerings
            • 15.14 RT
              • RT - Overview
              • RT - Product / Service
              • RT - Key offerings
            • 15.15 TCOM LP
              • TCOM LP - Overview
              • TCOM LP - Product / Service
              • TCOM LP - Key offerings
            • 15.16 Thales Group
              • Thales Group - Overview
              • Thales Group - Business segments
              • Thales Group - Key news
              • Thales Group - Key offerings
              • Thales Group - Segment focus
            • 15.17 Zero 2 Infinity S.L.
              • Zero 2 Infinity S.L. - Overview
              • Zero 2 Infinity S.L. - Product / Service
              • Zero 2 Infinity S.L. - Key offerings

            16 Appendix

            • 16.1 Scope of the report
              • 16.2 Inclusions and exclusions checklist
                • Inclusions checklist
                • Exclusions checklist
              • 16.3 Currency conversion rates for US$
                • Currency conversion rates for US$
              • 16.4 Research methodology
                • Research methodology
              • 16.5 Data procurement
                • Information sources
              • 16.6 Data validation
                • Data validation
              • 16.7 Validation techniques employed for market sizing
                • Validation techniques employed for market sizing
              • 16.8 Data synthesis
                • Data synthesis
              • 16.9 360 degree market analysis
                • 360 degree market analysis
              • 16.10 List of abbreviations
                • List of abbreviations

              Research Methodology

              Technavio presents a detailed picture of the market by way of study, synthesis, and summation of data from multiple sources. The analysts have presented the various facets of the market with a particular focus on identifying the key industry influencers. The data thus presented is comprehensive, reliable, and the result of extensive research, both primary and secondary.

              INFORMATION SOURCES

              Primary sources

              • Manufacturers and suppliers
              • Channel partners
              • Industry experts
              • Strategic decision makers

              Secondary sources

              • Industry journals and periodicals
              • Government data
              • Financial reports of key industry players
              • Historical data
              • Press releases

              DATA ANALYSIS

              Data Synthesis

              • Collation of data
              • Estimation of key figures
              • Analysis of derived insights

              Data Validation

              • Triangulation with data models
              • Reference against proprietary databases
              • Corroboration with industry experts

              REPORT WRITING

              Qualitative

              • Market drivers
              • Market challenges
              • Market trends
              • Five forces analysis

              Quantitative

              • Market size and forecast
              • Market segmentation
              • Geographical insights
              • Competitive landscape

              Interested in this report?

              Get your sample now to see our research methodology and insights!

              Download Now

              Frequently Asked Questions

              Aerostat Systems market growth will increase by $ 14155.5 mn during 2024-2028 .

              The Aerostat Systems market is expected to grow at a CAGR of 17.11% during 2024-2028 .

              Aerostat Systems market is segmented by Type( Balloons, Airships, Hybrid airships) Propulsion( Powered, Unpowered, APAC, South America, MEA)

              Aero Drum Ltd., Aeroscraft Corp., Airborne Industries Ltd., Altaeros, AUGUR RosAeroSystems, CNH Industrial NV, CNIM SA, Drona Aviation Pvt. Ltd., Forecast International Inc., Hybrid Air Vehicles Ltd., ILC Dover LP, Israel Aerospace Industries Ltd., Lindstrand Technologies Ltd., Lockheed Martin Corp., Rafael Advanced Defense Systems Ltd., RT, Solar Ship Inc., TCOM LP, Thales Group, Zero 2 Infinity S.L. are a few of the key vendors in the Aerostat Systems market.

              APAC will register the highest growth rate of 28% among the other regions. Therefore, the Aerostat Systems market in APAC is expected to garner significant business opportunities for the vendors during the forecast period.

              US, France, China, UK, Russia

              • Better performance and cost benefits compared with geostationary satellitesThe increased demand for high-capacity wireless services is the driving factor this market.
              • especially last-mile delivery is the driving factor this market.
              • poses serious challenges to telecommunication service providers. As numerous base stations are required to provide good wireless communication services is the driving factor this market.
              • the coverage of terrestrial networks is limited in some regions is the driving factor this market.
              • and the operation involves high costs. Satellite-based telecommunication services are known to have capacity and performance limitations for voice and video communication applications. In the last couple of decades is the driving factor this market.
              • high-altitude aerostats have drawn interest as they combine the best features of terrestrial and satellite-based systems. Owing to their advanced propagation characteristics is the driving factor this market.
              • they are able to deliver efficient is the driving factor this market.
              • cost-effective broadband services and are a viable alternative infrastructure for the long-term provision of broadband access to users. For instance is the driving factor this market.
              • balloons can remain stationary at a specific altitude for long periods (3-5 years) and provide coverage of approximately 500 km2. This feature helps operators to provide services in remote areas. The ease of rapid deployment and inflight control helps to serve the ever-changing communication demands. Since aerostats provide increased network flexibility and configurability is the driving factor this market.
              • they are well-suited for the temporary provision of basic and additional capacity requirements and facilitate emergency communication. A solitary high-altitude aerostat can act as a replacement for numerous terrestrial masts and significantly reduce operating costs. The increased mobility of aerostats can be attributed to their inherent ability for flexible and prompt deployment as and when required. Thus is the driving factor this market.
              • aerostats can be developed into new platforms with the potential to complement or replace satellites. Such factors are expected to drive the demand for aerostat systems is the driving factor this market.
              • which is the driving factor this market.
              • in turn is the driving factor this market.
              • is expected to drive the growth of the global aerostat system market during the forecast period. is the driving factor this market.

              The Aerostat Systems market vendors should focus on grabbing business opportunities from the Balloons segment as it accounted for the largest market share in the base year.