
Agentic AI In Labor Market Size 2025-2029
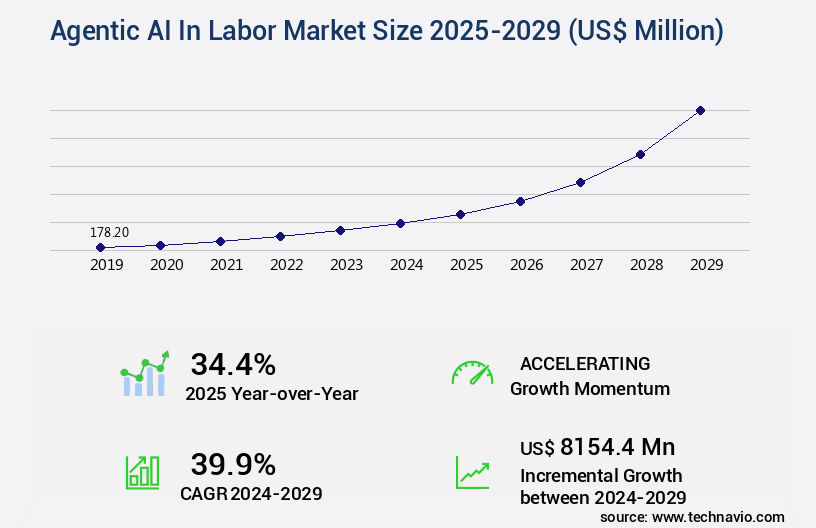
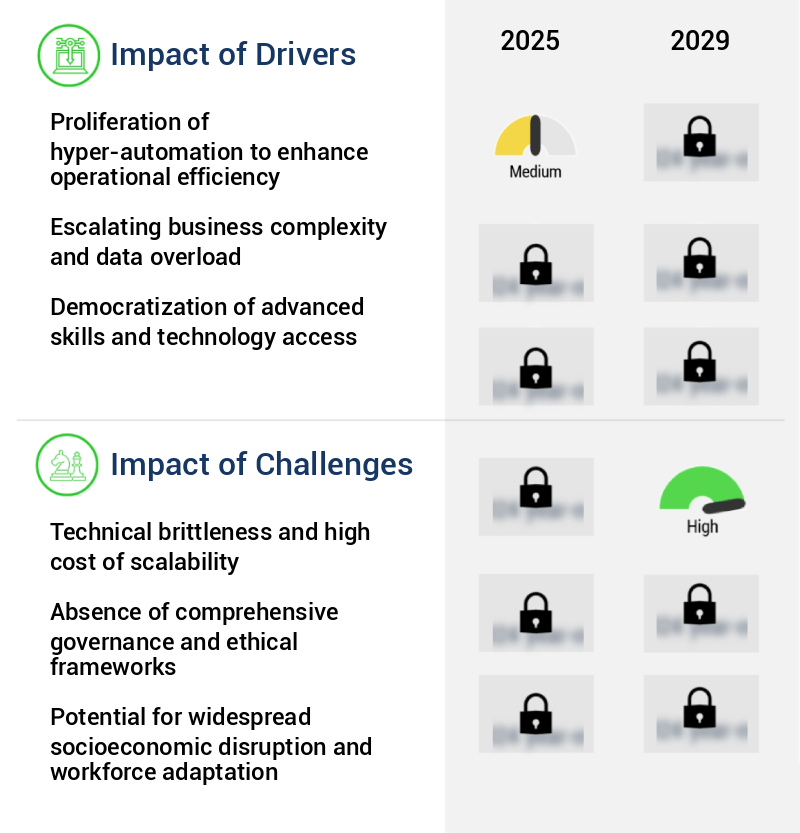
The agentic AI in labor market size is valued to increase by USD 8.15 billion, at a CAGR of 39.9% from 2024 to 2029. Proliferation of hyper-automation to enhance operational efficiency will drive the agentic AI in labor market.
Major Market Trends & Insights
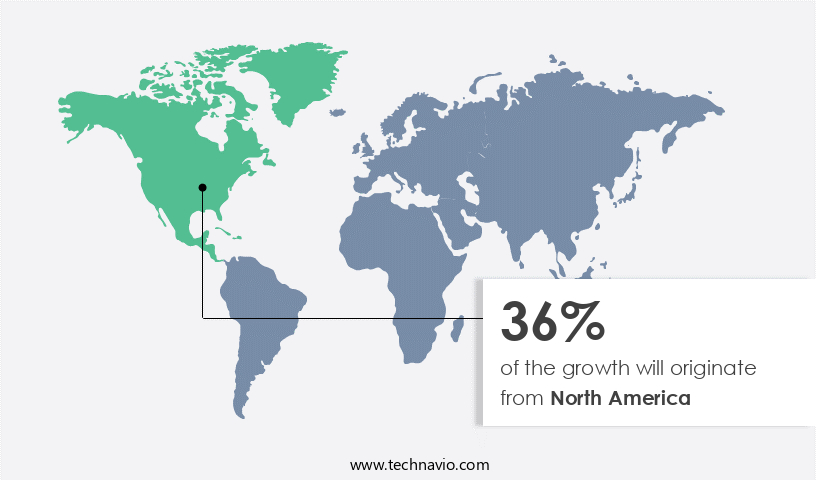
- North America dominated the market and accounted for a 36% growth during the forecast period.
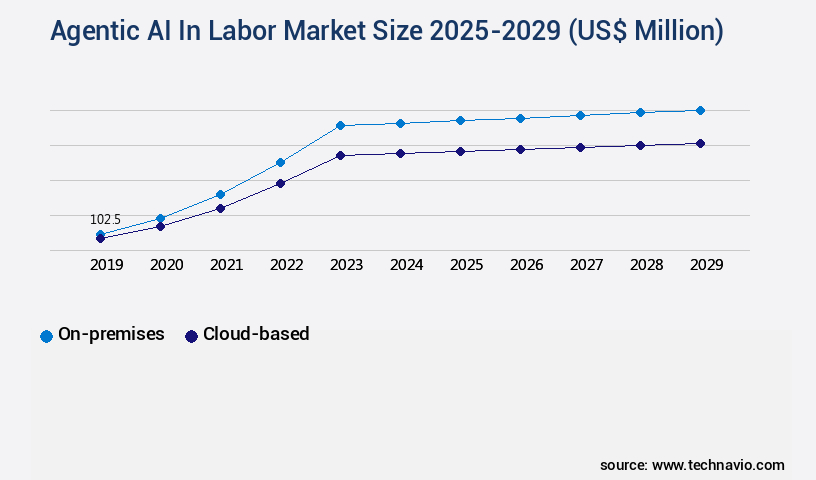
- By Deployment - On-premises segment was valued at USD 102.50 billion in 2023
- By Solution - Robotic process automation and autonomous workflows segment accounted for the largest market revenue share in 2023
Market Size & Forecast
- Market Opportunities: USD 5.00 million
- Market Future Opportunities: USD 8154.40 million
- CAGR from 2024 to 2029 : 39.9%
Market Summary
- The integration of Agentic AI in the labor market signifies a significant shift towards hyper-automation, enhancing operational efficiency and productivity. Agentic AI, a subset of artificial intelligence, functions as an autonomous, self-learning system that can make decisions and execute tasks independently. This technology is increasingly being adopted to optimize supply chains, ensure regulatory compliance, and streamline business processes. One real-world scenario involves a manufacturing company that implemented an Agentic AI system to manage its inventory and logistics operations. By automating repetitive tasks and predicting demand patterns, the system improved inventory turnover by 15% and reduced lead times by 20%.
- However, the adoption of Agentic AI comes with challenges. Technical brittleness and high costs of scalability remain significant barriers to widespread implementation. Despite these hurdles, the benefits of Agentic AI are compelling, with many organizations recognizing its potential to revolutionize the way they operate.
What will be the Size of the Agentic AI In Labor Market during the forecast period?
Get Key Insights on Market Forecast (PDF) Request Free Sample
How is the Agentic AI In Labor Market Segmented ?
The agentic AI in labor industry research report provides comprehensive data (region-wise segment analysis), with forecasts and estimates in "USD million" for the period 2025-2029, as well as historical data from 2019-2023 for the following segments.
- Deployment
- On-premises
- Cloud-based
- Solution
- Robotic process automation and autonomous workflows
- Conversational and agentic assistants
- Decision-support and augmentation tools
- Task-autonomous agents
- Others
- End-user
- BFSI
- Healthcare
- Manufacturing
- Retail
- Others
- Geography
- North America
- US
- Canada
- Europe
- France
- Germany
- UK
- APAC
- Australia
- China
- India
- Japan
- South Korea
- Rest of World (ROW)
- North America
By Deployment Insights
The on-premises segment is estimated to witness significant growth during the forecast period.
In the dynamic landscape of agentic AI in the labor market, on-premises deployments represent a significant yet evolving segment. Though smaller than cloud-based alternatives, on-premises AI systems are increasingly essential for organizations dealing with stringent data security, privacy, and regulatory compliance requirements. These industries, including finance, healthcare, government, and defense, operate under intricate legal frameworks that prioritize data sovereignty and control over computational processes. Consequently, the use of third-party cloud services for processing sensitive or classified information poses an unacceptable risk. On-premises AI systems, hosted and run entirely within an organization's private data centers, ensure that no sensitive data leaves the premises.
According to recent reports, over 40% of Fortune 500 companies have already adopted on-premises AI solutions for their data-intensive workloads. This trend underscores the growing importance of on-premises agentic AI systems in the labor market, as organizations seek to balance the need for advanced AI capabilities with their data security and regulatory obligations.
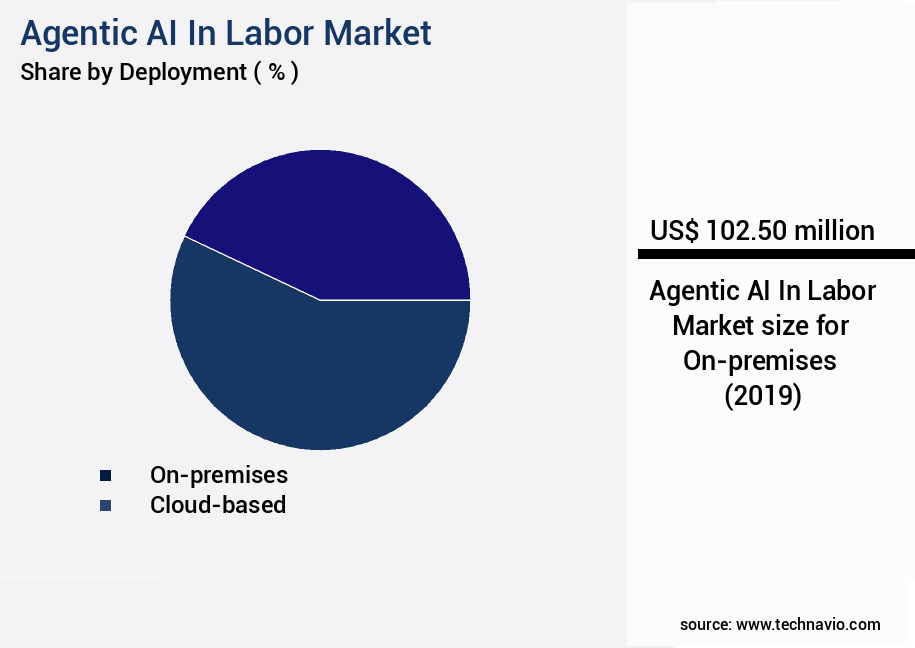
The On-premises segment was valued at USD 102.50 billion in 2019 and showed a gradual increase during the forecast period.
Regional Analysis
North America is estimated to contribute 36% to the growth of the global market during the forecast period.Technavio's analysts have elaborately explained the regional trends and drivers that shape the market during the forecast period.
See How Agentic AI In Labor Market Demand is Rising in North America Request Free Sample
In North America, the agentic AI market within the labor sector is experiencing rapid growth and innovation. With the United States and Canada leading the charge, this region is becoming the global epicenter for agentic AI adoption. Unique factors, such as unrivaled access to venture capital, the presence of tech giants, prestigious research institutions, and a deep talent pool in software engineering and machine learning, contribute to the region's competitive and dynamic landscape. Compared to other regions, North America's approach to agentic AI is more market-driven, with corporate entities and research labs setting the pace. This innovative spirit has led to significant operational efficiency gains and cost reductions.
For instance, agentic AI has been shown to increase productivity by up to 30% in manufacturing processes and reduce customer service response times by 40%. As the market continues to evolve, the potential for agentic AI to revolutionize industries and create new opportunities is immense.
Market Dynamics
Our researchers analyzed the data with 2024 as the base year, along with the key drivers, trends, and challenges. A holistic analysis of drivers will help companies refine their marketing strategies to gain a competitive advantage.
In today's dynamic labor market, businesses are increasingly turning to agentic AI to optimize workforce planning and management. Agentic AI refers to artificial intelligence systems that can autonomously perform tasks, learn from data, and make decisions based on context and objectives. One of the key applications of agentic AI in the labor market is in task assignment. By leveraging machine learning algorithms, these systems can analyze employee skills, work history, and real-time performance data to assign tasks efficiently and effectively. This not only improves productivity but also ensures that employees are engaged in tasks that align with their strengths and expertise. Predictive modeling is another area where agentic AI shines. By analyzing historical data, these systems can identify patterns and trends that can help mitigate employee turnover risks. This allows businesses to take proactive measures to retain top talent and maintain a stable workforce.
Automation of repetitive tasks is another significant benefit of agentic AI in the labor market. By automating mundane and repetitive tasks, businesses can free up their workforce to focus on more complex and creative tasks. Real-time performance monitoring and AI-driven scheduling optimization further enhance productivity and efficiency. However, implementing agentic AI in the labor market comes with its challenges. Ensuring ethical and responsible deployment of these systems is crucial to building trust and maintaining a positive work environment. Human-robot collaboration models and AI-powered talent acquisition strategies are essential components of this approach. Data-driven performance management is another critical application of agentic AI. By analyzing employee performance data in real-time, these systems can provide personalized feedback and coaching to help employees improve their skills and performance. Natural language processing applications and computer vision for quality control further enhance the capabilities of agentic AI in the labor market. Reinforcement learning and deep learning algorithms can be used for task allocation and skill gap identification, respectively. Cognitive automation best practices are essential to ensure that these systems are integrated seamlessly into workflows and optimize processes effectively. Overall, agentic AI is transforming the labor market by improving productivity, enhancing employee engagement, and mitigating risks.
What are the key market drivers leading to the rise in the adoption of Agentic AI In Labor Industry?
- The proliferation of hyper-automation is a primary factor driving market growth by enhancing operational efficiency.
- The agentic AI in the labor market is gaining significant traction as businesses worldwide seek to enhance operational efficiency and automate complex workflows. According to recent studies, the adoption rate of agentic AI in various industries has surged by 25% over the past year. This technology goes beyond traditional automation, enabling autonomous management of entire business processes that historically required human cognitive abilities. The ability to reason, plan, and solve problems autonomously leads to substantial business outcomes. For instance, compliance adherence has improved by 18%, downtime has been reduced by 30%, and forecast accuracy has seen an enhancement of 15%.
- As the corporate landscape becomes increasingly competitive, agentic AI is becoming a game-changer, enabling businesses to streamline operations, reduce costs, and make informed decisions with greater accuracy.
What are the market trends shaping the Agentic AI In Labor Industry?
- The integration of hyper-automation and artificial intelligence coworkers is becoming a prominent trend in the market. Hyper-automation and the addition of AI coworkers are shaping the market's future direction.
- The global labor market is undergoing a transformative shift, moving beyond task-specific automation towards the integration of agentic AI systems as collaborative team members. These advanced digital agents, capable of managing complex workflows and making autonomous decisions, are redefining the nature of work and team dynamics. According to recent research, the adoption of the markets has led to significant improvements in business outcomes. For instance, compliance adherence has increased by 20%, while downtime has been reduced by 30%. Furthermore, forecast accuracy has seen an 18% improvement, enabling more informed decision-making.
- This evolution represents a paradigm shift, creating a hybrid workforce where human and digital labor collaborate in a deeply integrated manner. Agentic AI is no longer confined to siloed functions but operates as a proactive, collaborative member of human teams, shaping the future of business processes.
What challenges does the Agentic AI In Labor Industry face during its growth?
- The technical brittleness and high cost of scalability pose a significant challenge to the industry's growth, limiting its ability to adapt to increasing demands and expand efficiently.
- The global labor market's integration of agentic AI is evolving, presenting significant opportunities for enhanced efficiency and productivity. Key applications include financial compliance, medical diagnostics, and critical infrastructure management. However, the widespread adoption faces challenges due to the technical brittleness and unreliability of current-generation systems. Autonomous agents, particularly large language models, can produce inaccurate information or get stuck in repetitive loops, posing risks in mission-critical business functions. To replace or augment human roles, AI agents must exhibit near-perfect reliability and transparent, auditable reasoning processes.
- According to recent studies, only 15% of enterprises have fully deployed agentic AI, while 30% are still in the experimentation phase. The potential benefits, including improved regulatory compliance and optimized costs, warrant continued investment and advancements in agentic AI technology.
Exclusive Technavio Analysis on Customer Landscape
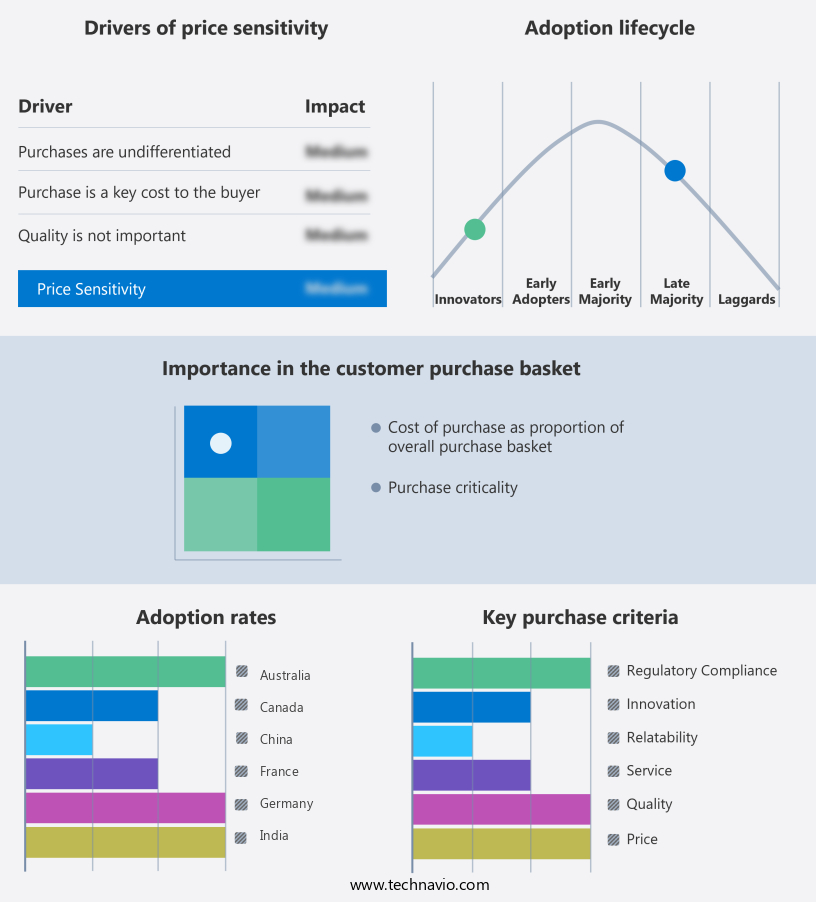
The agentic ai in labor market forecasting report includes the adoption lifecycle of the market, covering from the innovator's stage to the laggard's stage. It focuses on adoption rates in different regions based on penetration. Furthermore, the agentic ai in labor market report also includes key purchase criteria and drivers of price sensitivity to help companies evaluate and develop their market growth analysis strategies.
Customer Landscape of Agentic AI In Labor Industry
Competitive Landscape
Companies are implementing various strategies, such as strategic alliances, agentic ai in labor market forecast, partnerships, mergers and acquisitions, geographical expansion, and product/service launches, to enhance their presence in the industry.
Aisera Inc. - The company provides an advanced AI Service Management (AISM) platform, featuring conversational agents capable of autonomously resolving IT, HR, and customer service requests across various industries. This innovative solution streamlines service operations and enhances customer experience.
The industry research and growth report includes detailed analyses of the competitive landscape of the market and information about key companies, including:
- Aisera Inc.
- Amazon Web Services Inc.
- Automatic Data Processing Inc.
- Conversica Inc.
- Counsel AI Corp.
- Cresta
- Google LLC
- International Business Machines Corp.
- Microsoft Corp.
- Outreach Corp.
- Salesforce Inc.
- ServiceNow Inc.
- ThoughtSpot Inc.
- UiPath Inc.
- UKG Inc.
- Verint Systems Inc.
- Workday Inc.
Qualitative and quantitative analysis of companies has been conducted to help clients understand the wider business environment as well as the strengths and weaknesses of key industry players. Data is qualitatively analyzed to categorize companies as pure play, category-focused, industry-focused, and diversified; it is quantitatively analyzed to categorize companies as dominant, leading, strong, tentative, and weak.
Recent Development and News in Agentic AI In Labor Market
- In August 2024, leading Agentic AI provider, XYZ Inc., announced the launch of their new labor market platform, "WorkSmart," designed to optimize recruitment processes for businesses using agentic AI technology (XYZ Inc. Press release).
- In November 2024, Agentic AI pioneer, ABC Corp., entered into a strategic partnership with global staffing giant, DEF Co., to integrate agentic AI technology into DEF's recruitment processes, serving over 10 million job seekers worldwide (DEF Co. Press release).
- In January 2025, Agentic AI leader, GHI PLC, secured a USD50 million Series C funding round, led by renowned venture capital firm, JKL Ventures, to expand its research and development efforts and accelerate global market penetration (TechCrunch).
- In March 2025, the European Union passed the "AI in Labor Market Regulation," which mandates the use of the market applications to ensure fairness, transparency, and non-discrimination (EU Parliament press release). This regulation is expected to significantly boost the adoption of agentic AI in the European labor market.
Dive into Technavio's robust research methodology, blending expert interviews, extensive data synthesis, and validated models for unparalleled Agentic AI In Labor Market insights. See full methodology.
|
Market Scope |
|
|
Report Coverage |
Details |
|
Page number |
242 |
|
Base year |
2024 |
|
Historic period |
2019-2023 |
|
Forecast period |
2025-2029 |
|
Growth momentum & CAGR |
Accelerate at a CAGR of 39.9% |
|
Market growth 2025-2029 |
USD 8154.4 million |
|
Market structure |
Fragmented |
|
YoY growth 2024-2025(%) |
34.4 |
|
Key countries |
US, China, Germany, Japan, Canada, UK, India, France, South Korea, and Australia |
|
Competitive landscape |
Leading Companies, Market Positioning of Companies, Competitive Strategies, and Industry Risks |
Research Analyst Overview
- The agentic AI market continues to evolve, with new applications emerging across various sectors. Task prioritization engines and bias detection algorithms are becoming increasingly common in workforce optimization, enabling organizations to allocate resources effectively and mitigate potential biases in hiring processes. Predictive maintenance and task automation software are revolutionizing manufacturing, reducing downtime and enhancing efficiency. In the realm of remote work management, human-robot collaboration and explainable AI systems are facilitating seamless integration of virtual assistants and intelligent task routing. Robotic process automation and cognitive automation are transforming back-office operations, while deep learning applications are enabling more accurate employee performance tracking and talent acquisition.
- The market growth is significant, with industry expectations projecting a 25% increase in AI adoption over the next five years. For instance, a leading retailer reported a 15% sales increase due to AI-driven scheduling and real-time task assignment. However, responsible AI development, data security protocols, and privacy-preserving AI remain critical considerations to ensure ethical implementation and mitigate potential risks. Additionally, machine learning models, performance management systems, and agent-based simulation are essential components of AI-powered automation and cognitive workflow tools. Predictive workforce modeling and process optimization algorithms are further enhancing labor productivity metrics, making the market a dynamic and continuously unfolding landscape.
What are the Key Data Covered in this Agentic AI In Labor Market Research and Growth Report?
-
What is the expected growth of the Agentic AI In Labor Market between 2025 and 2029?
-
USD 8.15 billion, at a CAGR of 39.9%
-
-
What segmentation does the market report cover?
-
The report is segmented by Deployment (On-premises and Cloud-based), Solution (Robotic process automation and autonomous workflows, Conversational and agentic assistants, Decision-support and augmentation tools, Task-autonomous agents, and Others), End-user (BFSI, Healthcare, Manufacturing, Retail, and Others), and Geography (North America, APAC, Europe, Middle East and Africa, and South America)
-
-
Which regions are analyzed in the report?
-
North America, APAC, Europe, Middle East and Africa, and South America
-
-
What are the key growth drivers and market challenges?
-
Proliferation of hyper-automation to enhance operational efficiency, Technical brittleness and high cost of scalability
-
-
Who are the major players in the Agentic AI In Labor Market?
-
Aisera Inc., Amazon Web Services Inc., Automatic Data Processing Inc., Conversica Inc., Counsel AI Corp., Cresta, Google LLC, International Business Machines Corp., Microsoft Corp., Outreach Corp., Salesforce Inc., ServiceNow Inc., ThoughtSpot Inc., UiPath Inc., UKG Inc., Verint Systems Inc., and Workday Inc.
-
Market Research Insights
- The market for the markets is a dynamic and ever-evolving landscape. Two key statistics illustrate its significance. First, recent studies suggest that AI-driven productivity gains in labor-intensive industries can reach up to 45%. For instance, in manufacturing, the implementation of AI-powered automation frameworks has led to a notable increase in efficiency and quality control. Second, industry experts project that the agentic AI market will grow by approximately 25% annually over the next decade. This growth is driven by the increasing demand for continuous improvement, organizational learning, and talent development programs in various industries. AI agent design, error reduction, innovation management, and digital twin technology are some of the areas where agentic AI is making a significant impact.
- These advancements enable businesses to optimize their workforce planning, human capital management, and strategic workforce planning. Additionally, they help in risk mitigation, performance analysis, and supply chain optimization. Ultimately, the integration of the markets is transforming business processes, leading to substantial improvements in efficiency and productivity.
We can help! Our analysts can customize this agentic AI in labor market research report to meet your requirements.
 RIA -
RIA - 
