Agricultural Biologicals Market Size 2025-2029
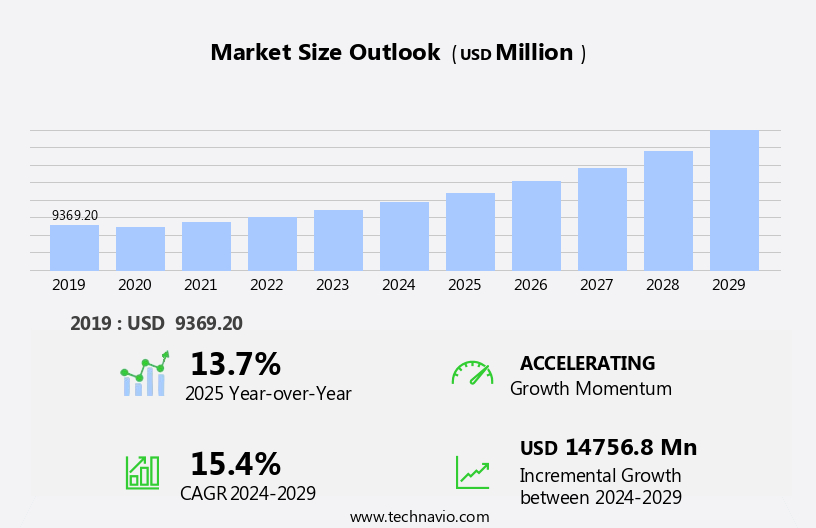
The agricultural biologicals market size is forecast to increase by USD 14.76 billion at a CAGR of 15.4% between 2024 and 2029.
- The market is experiencing significant growth, driven primarily by the rising prices of chemical fertilizers and pesticides. With the increasing costs of traditional agricultural inputs, farmers are turning to more cost-effective and environmentally sustainable alternatives. One such alternative is agricultural biologicals, which include biostimulants, biofertilizers, and biopesticides. Another key driver for the market is the increased awareness and product knowledge of biostimulants. Biostimulants are substances that enhance or stimulate the growth of crops, improving their productivity and resilience. As farmers become more familiar with these products, demand for them is expected to rise. However, a major challenge facing the market is the lack of awareness of agricultural biologicals among farmers.
- Despite their potential benefits, many farmers remain unaware of these products and their capabilities. Addressing this knowledge gap through targeted marketing and education efforts will be essential for market growth. Additionally, regulatory compliance and standardization will be important considerations for companies operating in the market. Ensuring that agricultural biologicals meet regulatory requirements and are consistently produced to high standards will help build trust and confidence among farmers and consumers. Companies seeking to capitalize on market opportunities and navigate challenges effectively should focus on developing innovative products, building strong relationships with farmers, and addressing the knowledge gap through education and outreach efforts.
What will be the Size of the Agricultural Biologicals Market during the forecast period?
-
The Agricultural Biologicals Market is thriving with biopesticides, biofertilizers, and biostimulants driving sustainable agriculture. Integrated pest management (IPM) and organic farming leverage microbial biotechnology and precision agriculture technologies to enhance crop yields. Chemical-free crop protection and high-yield organic farming meet consumer demand for residue-free produce. North American agricultural biologicals lead the market, with cereals and grains biologicals dominating applications. Next-generation biopesticides and advanced biostimulants, powered by RNAi technology in agriculture, offer eco-friendly solutions. Exploring how to improve crop yield with biostimulants and sustainable crop protection with semiochemicals boosts efficiency. Agricultural biologicals market trends for 2025 highlight growth, with best biopesticides for organic farming and agricultural biologicals for residue-free produce shaping the future.
- The market continues to evolve, driven by the ongoing quest for improved crop yield, product differentiation, and sustainable farming practices. Large-scale agriculture relies on a diverse range of biological inputs, from seed treatments and microbial inoculants to foliar applications and biocontrol agents. Synthetic fertilizers and crop protection remain essential components of modern farming, but the industry is increasingly turning to biological solutions for competitive advantage. Foliar applications, for instance, offer farmers the ability to deliver nutrients directly to plants, enhancing their growth and resilience. Industry standards and application methods are continually evolving to accommodate this shift, with precision agriculture and remote sensing playing increasingly important roles.
- Smallholder farmers, too, are adopting biologicals at an accelerating rate, driven by the need for more efficient and sustainable farming practices. Biocontrol agents, for example, offer a cost-effective alternative to chemical pesticides, while plant growth promoters and soil application products improve soil health and nutrient management. Innovation adoption is a key driver of market growth, with agricultural research and development leading the way. Gene editing, for instance, holds great promise for yield enhancement and resistance management. Artificial intelligence and sensor technology are also transforming the industry, from field trials and formulation development to retail sales and distribution channels.
How is this Agricultural Biologicals Industry segmented?
The agricultural biologicals industry research report provides comprehensive data (region-wise segment analysis), with forecasts and estimates in "USD million" for the period 2025-2029, as well as historical data from 2019-2023 for the following segments.
- Type
- Biopesticides
- Biofertilizers
- Biostimulants
- Application
- Cereals and grains
- Fruits and vegetables
- Oilseeds and pulses
- Others
- Application Method
- Foliar Spray
- Seed Treatment
- Soil Treatment
- Post-Harvest
- Geography
- North America
- US
- Canada
- Europe
- France
- Germany
- Italy
- Spain
- UK
- APAC
- China
- India
- South America
- Brazil
- Middle East and Africa
- UAE
- Rest of World (ROW)
- North America
By Type Insights
The biopesticides segment is estimated to witness significant growth during the forecast period.
In the dynamic agricultural landscape, gene editing is revolutionizing conventional agriculture by enabling precise modifications to enhance crop yield, improve disease resistance, and promote sustainable practices. Agricultural research is at the forefront of this innovation, pushing the boundaries of science to develop new solutions for farmers. Supply chain management plays a crucial role in ensuring the efficient distribution of these advanced agricultural inputs, from seed treatment to retail sales. Certification programs provide a means for farmers to differentiate their products, offering consumers assurances of food security and environmental sustainability. Large-scale agriculture and smallholder farmers alike benefit from the adoption of precision agriculture, which leverages artificial intelligence, remote sensing, and data analytics to optimize crop production.
Crop rotation, yield enhancement, and nutrient management are key components of this approach, promoting soil health and reducing greenhouse gas emissions. Synthetic fertilizers and chemical pesticides continue to be essential agricultural inputs, but there is a growing trend towards the use of microbial inoculants and biocontrol agents as more sustainable alternatives. Industry standards and application methods are evolving to accommodate these new technologies, with a focus on innovation adoption and regulatory approvals. Farmers are embracing digital agriculture, sensor technology, and extension services to optimize their operations and improve farm profitability. Livestock production and integrated pest management are also adapting to these advancements, with a focus on value proposition, formulation development, and distribution channels.
Carbon sequestration and water conservation are critical aspects of sustainable agriculture, with farmers increasingly adopting practices that promote soil health and reduce environmental impact. The agricultural industry is also exploring the potential of plant growth promoters, product registration, and integrated pest management strategies to enhance crop production and improve overall sustainability. In this rapidly evolving market, competitive advantage is key. Farmers and agribusinesses must stay informed of the latest trends and technologies to remain competitive. Foliar application, resistance management, and disease control are essential components of this strategy, with a focus on product differentiation and market penetration. The future of agriculture lies in its ability to balance productivity, profitability, and sustainability, with a commitment to environmental stewardship and food security.
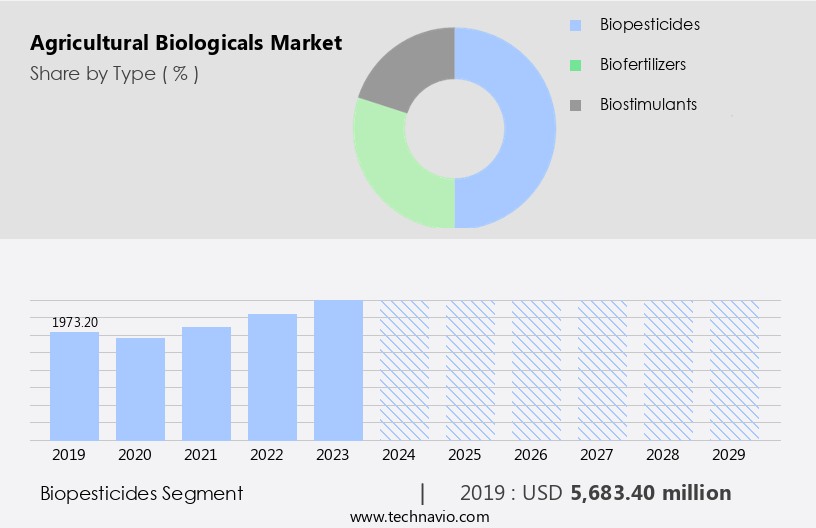
The Biopesticides segment was valued at USD 5.68 billion in 2019 and showed a gradual increase during the forecast period.
Regional Analysis
North America is estimated to contribute 44% to the growth of the global market during the forecast period. Technavio's analysts have elaborately explained the regional trends and drivers that shape the market during the forecast period.
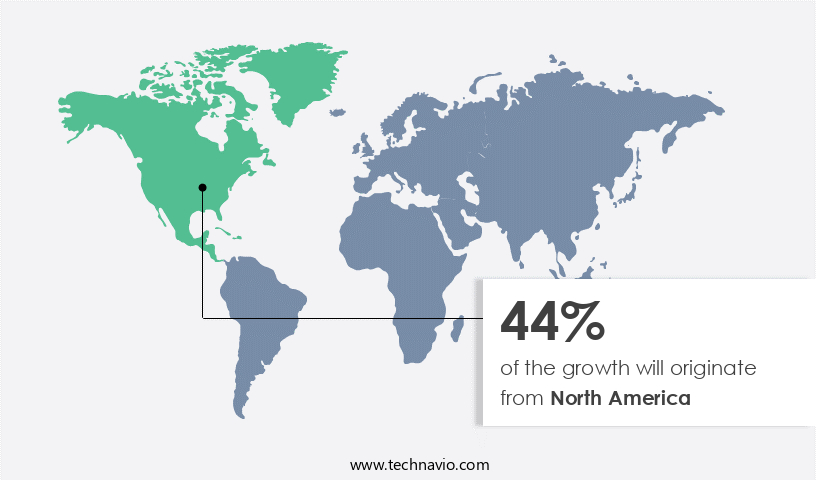
The market in North America is experiencing notable growth, with the US leading the regional landscape in 2024. This expansion is driven by a rising demand for organic farm products and stringent regulations limiting the use of synthetic fertilizers. In Canada, the ban on cosmetic fertilizers is further fueling market growth. Agricultural biologicals are primarily utilized in cereals and grains production in North America. The organic farming sector in the region is thriving, fueled by increasing consumer preference for organic products. In the US, agricultural biologicals are employed for various applications, including seed treatment, foliar application, and soil application. These products contribute to enhancing crop yield, improving soil health, and promoting sustainable agriculture.
Additionally, they aid in resistance management, disease control, and nutrient management. The market penetration of agricultural biologicals is further boosted by the integration of technology, such as artificial intelligence, remote sensing, and data analytics, into farming practices. These innovations enable precision agriculture, crop rotation, and yield enhancement. The market's competitive advantage lies in its ability to offer product differentiation, as well as environmental sustainability benefits, such as carbon sequestration and water conservation. The market's growth is also supported by the adoption of integrated pest management practices and the use of microbial inoculants and biocontrol agents. The distribution channels for agricultural biologicals include retail sales, direct marketing, and extension services.
The market's future potential lies in the integration of digital agriculture, sensor technology, and livestock production. Overall, the North American market is poised for significant growth, driven by the evolving agricultural landscape and the increasing demand for sustainable and environmentally friendly agricultural inputs.
Market Dynamics
The market for agricultural biologicals is vast and complex, encompassing a wide range of applications and stakeholders. From grain production and livestock production to dairy farming and extension services, the potential for growth is immense. And as the industry continues to evolve, so too will the role of biologicals in ensuring food security, reducing greenhouse gas emissions, and promoting environmental sustainability.
Our researchers analyzed the data with 2024 as the base year, along with the key drivers, trends, and challenges. A holistic analysis of drivers will help companies refine their marketing strategies to gain a competitive advantage.
What are the key market drivers leading to the rise in the adoption of Agricultural Biologicals Industry?
- The escalating costs of chemical fertilizers and pesticides serve as the primary driving force in the market.
- The market experiences growth due to the rising costs of chemical fertilizers and pesticides, compelling farmers to seek economical and sustainable alternatives. Agricultural biological products, including biofertilizers and biopesticides, offer viable solutions. Biofertilizers, comprised of living microorganisms, enhance soil health and nutrient availability. Biopesticides, derived from natural sources, control pests and diseases. These products not only provide cost savings but also reduce environmental pollution and foster biodiversity. Furthermore, digital agriculture and sensor technology facilitate precision farming, while extension services and formulation development advance product efficacy.
- Integrated pest management and nutrient management systems ensure optimal use of agricultural biologicals. Livestock production and organic farming also benefit from these solutions, contributing to the market's expansion. Distribution channels, including dairy farming, expand the reach of agricultural biologicals, further fueling market growth.
What are the market trends shaping the Agricultural Biologicals Industry?
- Biostimulants are gaining increasing attention in the market due to heightened awareness and advanced product knowledge. This trend reflects the growing recognition of their potential benefits for agricultural productivity and sustainability.
- Agricultural biologicals, comprised of plant biostimulants, play a pivotal role in enhancing crop production and ensuring food security. These innovative solutions, which include formulations of natural and synthetic compounds, microorganisms, and plant growth regulators, improve plant metabolism, stress tolerance, and yield. The market for agricultural biologicals is propelled by the integration of advanced technologies such as gene editing, artificial intelligence, and precision agriculture. Conventional agriculture is increasingly adopting sustainable practices, including seed treatment, crop rotation, and resistance management, to boost farm profitability and minimize environmental impact. Certification programs and supply chain management ensure product quality and safety. Plant biostimulants derived from natural sources, such as amino acids, seaweeds, bacteria, and phytohormones, are gaining popularity due to their eco-friendly nature and ability to enhance secondary metabolites synthesis and biomass production.
- Recent research indicates that the market for agricultural biologicals is poised for significant growth in the forecast period, driven by the need for sustainable agriculture, yield enhancement, and food security.
What challenges does the Agricultural Biologicals Industry face during its growth?
- The lack of awareness and understanding of agricultural biologicals poses a significant challenge to the growth and development of the agricultural industry. These essential products, which include bio-pesticides, bio-fertilizers, and other microbial solutions, play a crucial role in enhancing crop productivity and sustainability. However, the industry's expansion is hindered by the limited knowledge and awareness of these solutions among farmers and stakeholders. To address this challenge, targeted education and outreach efforts are necessary to increase awareness and promote the adoption of agricultural biologicals. By fostering a greater understanding of these innovative products, the agricultural industry can unlock new opportunities for growth and contribute to more sustainable farming practices.
- The market faces growth hindrances due to insufficient awareness among farmers regarding the benefits of these products. The decision to adopt updated agricultural practices depends on various factors, including economic sustainability, environmental friendliness, political compliance, practical feasibility, and social acceptance. However, the misconception that biological products may pose health risks and the categorization of biofertilizers as organic manures or herbal extracts hinder the market's expansion. This inconsistency is particularly noticeable in Sub-Saharan Africa, where the use of biofertilizers is significantly lower compared to developed regions and some Asian countries.
- Product differentiation through innovation, application methods such as foliar application, and industry standards can offer competitive advantages to market players. Remote sensing technology can also enhance the efficiency of agricultural inputs, including biologicals, by optimizing their application and improving crop yield in large-scale agriculture.
Exclusive Customer Landscape
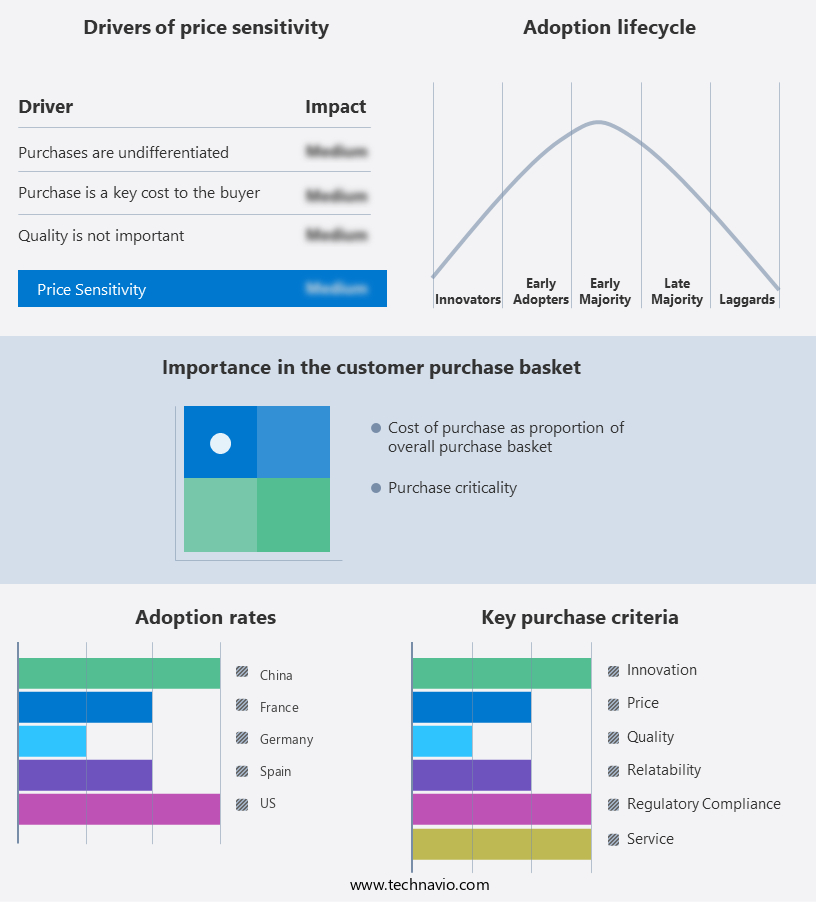
The agricultural biologicals market forecasting report includes the adoption lifecycle of the market, covering from the innovator's stage to the laggard's stage. It focuses on adoption rates in different regions based on penetration. Furthermore, the agricultural biologicals market report also includes key purchase criteria and drivers of price sensitivity to help companies evaluate and develop their market growth analysis strategies.
Customer Landscape
Key Companies & Market Insights
Companies are implementing various strategies, such as strategic alliances, agricultural biologicals market forecast, partnerships, mergers and acquisitions, geographical expansion, and product/service launches, to enhance their presence in the industry.
Agrinos AS - The company specializes in agricultural biological solutions, providing innovative products that enhance crop health and productivity.
The industry research and growth report includes detailed analyses of the competitive landscape of the market and information about key companies, including:
- Agrinos AS
- Andermatt Group AG
- BASF SE
- Bayer AG
- Biological Products Industry Alliance
- Certis USA LLC
- Evogene Ltd.
- Gowan Co.
- Koppert
- Novozymes AS
- PI Industries Ltd.
- Pro Farm Group Inc.
- PROBELTE SAU
- SEIPASA SA
- SOM Phytopharma India Ltd.
- Syngenta Crop Protection AG
- T.Stanes and Co. Ltd.
- UPL Ltd.
- Valent BioSciences LLC
- Vegalab SA
Qualitative and quantitative analysis of companies has been conducted to help clients understand the wider business environment as well as the strengths and weaknesses of key industry players. Data is qualitatively analyzed to categorize companies as pure play, category-focused, industry-focused, and diversified; it is quantitatively analyzed to categorize companies as dominant, leading, strong, tentative, and weak.
Recent Development and News in Agricultural Biologicals Market
- In February 2024, BASF SE announced the launch of its new biological fungicide, "Ceremevo WG," which utilizes the active ingredient, ceramusulin, to protect crops from various fungal diseases. This innovation marks a significant advancement in the market, as it offers farmers an effective and eco-friendly alternative to conventional chemical fungicides (BASF press release, 2024).
- In October 2024, Bayer AG completed the acquisition of AgroLiquid, a leading manufacturer of liquid fertilizers and specialty nutrients. This acquisition expands Bayer's agricultural offerings and strengthens its position in the growing market for nutrient solutions (Bayer AG press release, 2024).
- In March 2025, the European Commission approved the use of Corteva Agriscience's Enlist Duo herbicide, which combines glyphosate and 2,4-D choline, for corn and soybean cultivation. This approval is expected to boost the adoption of genetically modified crops and increase demand for agricultural biologicals that offer effective weed control solutions (European Commission press release, 2025).
Research Analyst Overview
The market is experiencing significant growth due to the increasing focus on sustainable intensification and resource efficiency. Investment opportunities abound in this sector, particularly in the development of plant growth regulators and biocontrol agents that enhance crop yield and reduce the need for synthetic fertilizers. The circular economy is driving innovation in the use of soil amendments and phosphorus solubilization, while pest monitoring and disease forecasting technologies help farmers mitigate risks and improve product stewardship. Trade barriers and policy regulations pose challenges to market access, but consumer awareness and brand loyalty are on the rise. The mode of action of agricultural biologicals is becoming increasingly target-specific, addressing specific pests and diseases with minimal impact on non-target organisms.
Regenerative agriculture and climate change adaptation are key trends, with a growing emphasis on nitrogen fixation and biocontrol efficacy. The innovation pipeline is robust, with a focus on developing products that address specific crop needs and improve environmental fate. Consumer preferences for organic certification and fair trade are influencing market dynamics, while crop modeling and biotechnology are enabling more precise application of agricultural biologicals. Market access remains a critical issue, with global trade and resource efficiency shaping the competitive landscape. Policy regulations and consumer awareness are driving demand for more sustainable and effective agricultural solutions. Overall, the market is poised for continued growth and innovation, as farmers and consumers seek more sustainable and efficient ways to meet the world's food production needs.
Dive into Technavio's robust research methodology, blending expert interviews, extensive data synthesis, and validated models for unparalleled Agricultural Biologicals Market insights. See full methodology.
|
Market Scope |
|
|
Report Coverage |
Details |
|
Page number |
201 |
|
Base year |
2024 |
|
Historic period |
2019-2023 |
|
Forecast period |
2025-2029 |
|
Growth momentum & CAGR |
Accelerate at a CAGR of 15.4% |
|
Market growth 2025-2029 |
USD 14756.8 million |
|
Market structure |
Fragmented |
|
YoY growth 2024-2025(%) |
13.7 |
|
Key countries |
US, China, Germany, France, Brazil, India, Spain, Italy, Canada, and UK |
|
Competitive landscape |
Leading Companies, Market Positioning of Companies, Competitive Strategies, and Industry Risks |
What are the Key Data Covered in this Agricultural Biologicals Market Research and Growth Report?
- CAGR of the Agricultural Biologicals industry during the forecast period
- Detailed information on factors that will drive the growth and forecasting between 2025 and 2029
- Precise estimation of the size of the market and its contribution of the industry in focus to the parent market
- Accurate predictions about upcoming growth and trends and changes in consumer behaviour
- Growth of the market across North America, Europe, APAC, South America, and Middle East and Africa
- Thorough analysis of the market's competitive landscape and detailed information about companies
- Comprehensive analysis of factors that will challenge the agricultural biologicals market growth of industry companies
We can help! Our analysts can customize this agricultural biologicals market research report to meet your requirements.
 RIA -
RIA - 
