Biopesticides Market Size 2025-2029
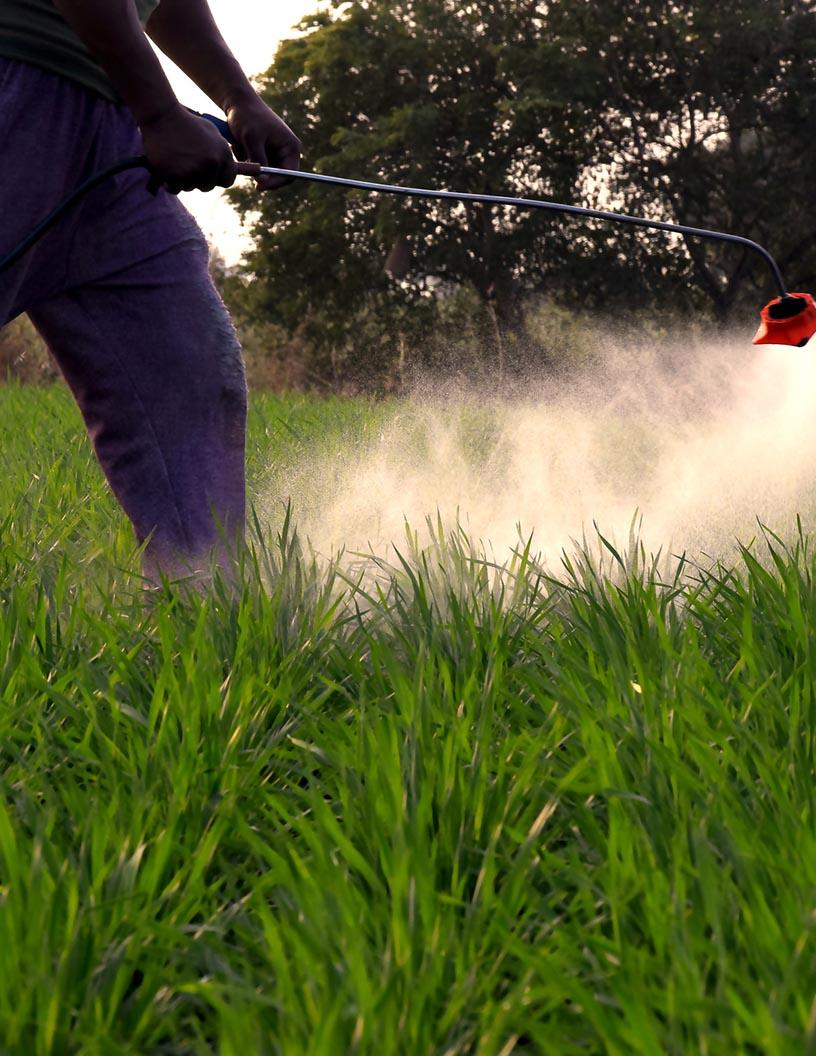
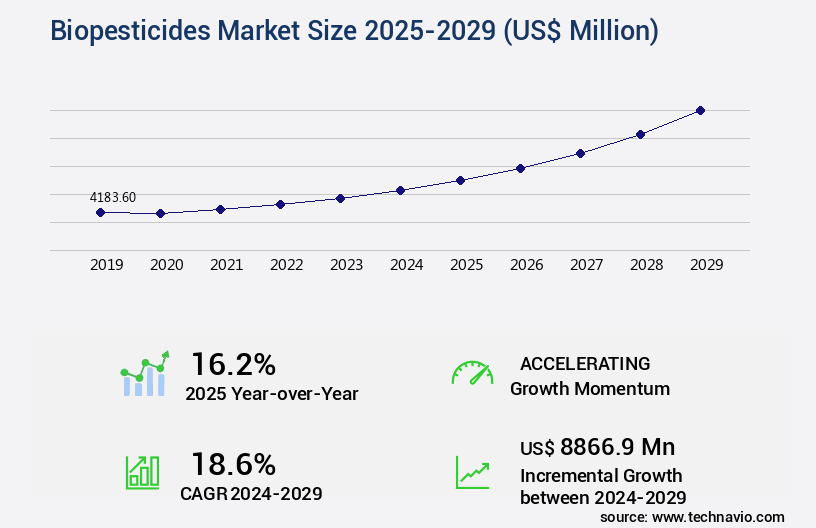
The biopesticides market size is valued to increase USD 8.87 billion, at a CAGR of 18.6% from 2024 to 2029. Increase in pest activities due to global warming will drive the biopesticides market.
Major Market Trends & Insights
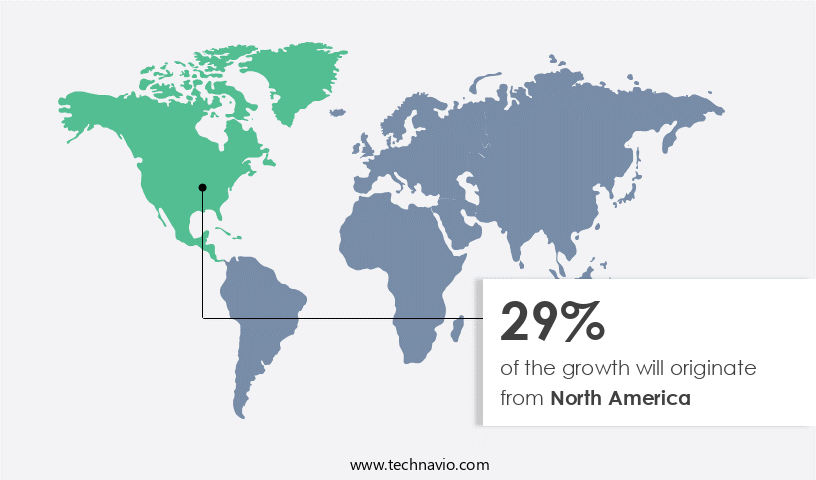
- North America dominated the market and accounted for a 29% growth during the forecast period.
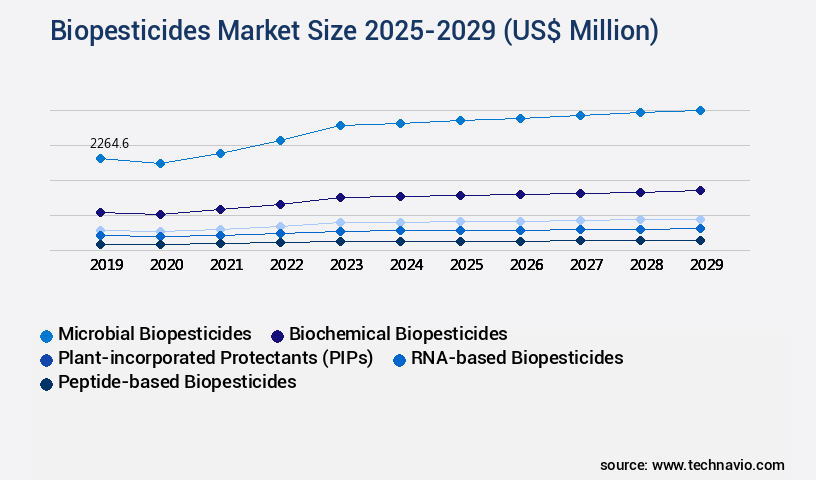
- By Type - Microbial biopesticides segment was valued at USD 2.26 billion in 2023
- By Product - Natural products segment accounted for the largest market revenue share in 2023
Market Size & Forecast
- Market Opportunities: USD 269.90 million
- Market Future Opportunities: USD 8866.90 million
- CAGR from 2024 to 2029 : 18.6%
Market Summary
- The market represents a significant and continually evolving sector in the global agricultural industry. Biopesticides, derived from natural sources such as plants, bacteria, and certain minerals, offer a sustainable alternative to traditional synthetic pesticides. Core technologies and applications, including microbial pesticides and biochemical pesticides, are at the forefront of this market's growth. According to recent studies, the market is expected to account for over 25% of the total global pesticide market by 2027, driven by increasing pest activities due to climate change and the need for more environmentally friendly solutions. However, challenges such as the lack of profitability and risks associated with biopesticide production and regulation pose significant hurdles.
- Advances in biopesticide development, including the use of genetically modified organisms and nanotechnology, offer promising opportunities for market expansion. In Europe, for instance, the market share for biopesticides is projected to reach 40% by 2025, driven by stringent regulations and consumer demand for organic produce. Despite these challenges and opportunities, the market continues to unfold, with ongoing research and innovation shaping its future.
What will be the Size of the Biopesticides Market during the forecast period?
Get Key Insights on Market Forecast (PDF) Request Free Sample
How is the Biopesticides Market Segmented ?
The biopesticides industry research report provides comprehensive data (region-wise segment analysis), with forecasts and estimates in "USD million" for the period 2025-2029, as well as historical data from 2019-2023 for the following segments.
- Type
- Microbial biopesticides
- Biochemical biopesticides
- Plant-incorporated protectants (PIPs)
- RNA-based biopesticides
- Peptide-based biopesticides
- Product
- Natural products
- Microbials
- Macrobials
- Semiochemicals
- Application
- Crop Protection
- Seed Treatment
- Post-Harvest
- Crop Type
- Cereals & Grains
- Fruits & Vegetables
- Oilseeds & Pulses
- Form
- Liquid
- Powder
- Granular
- Geography
- North America
- US
- Canada
- Europe
- France
- Germany
- Italy
- UK
- Middle East and Africa
- Egypt
- KSA
- Oman
- UAE
- APAC
- China
- India
- Japan
- South America
- Argentina
- Brazil
- Rest of World (ROW)
- North America
By Type Insights
The microbial biopesticides segment is estimated to witness significant growth during the forecast period.
Microbial biopesticides represent a significant segment in the agricultural industry, derived from microorganisms such as viruses, bacteria, fungi, and others. These products offer protection against plant diseases and insect pests, responsible for crop damage. The market for microbial biopesticides is expanding due to the growing recognition of their environmental and health benefits. Unlike chemical pesticides, microbial biopesticides exhibit target pest specificity, minimizing harm to beneficial insects, humans, and animals. A key market driver is the increasing resistance of pests to chemical pesticides. Insect pathogenic fungi, nematode control agents, and bacterial toxins like those produced by Bacillus thuringiensis, are among the active ingredients used in microbial biopesticides.
Product development involves toxicity testing, environmental impact assessment, product lifecycle management, and biopesticide safety measures. Insecticidal proteins, RNA interference, and viral insecticides are some of the advanced technologies employed in biopesticide development. Biopesticides efficacy is assessed through field efficacy trials, residue analysis, and application methods. Integrated pest management strategies, synthetic pheromones, and formulation types are crucial components of the market. The market for microbial biopesticides is projected to expand by 30% in the next three years, as per industry reports. This growth is attributed to the rising demand for sustainable agriculture practices and the need for effective pest management solutions.
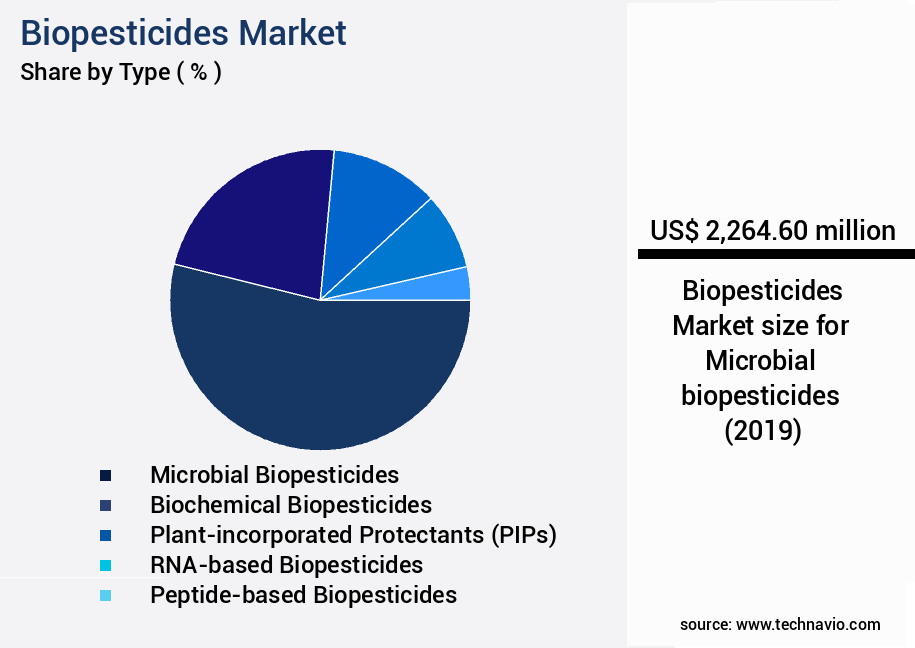
The Microbial biopesticides segment was valued at USD 2.26 billion in 2019 and showed a gradual increase during the forecast period.
Additionally, the market is expected to grow by 25% in the next five years due to the increasing adoption of biopesticides in various sectors. Microbial pesticides are a vital component of the agricultural industry, offering eco-friendly and effective pest control strategies. Their mode of action, which includes infection and killing of target pests, makes them a preferred choice for sustainable farming practices. The ongoing research and development in the field of biopesticides promise to unveil new opportunities and innovations in the market.
Regional Analysis
North America is estimated to contribute 29% to the growth of the global market during the forecast period. Technavio's analysts have elaborately explained the regional trends and drivers that shape the market during the forecast period.
See How Biopesticides Market Demand is Rising in North America Request Free Sample
The North American market experiences growth due to streamlined registration processes and escalating consumer demand for organic agricultural products. Conversely, challenges persist, including limited farmer awareness and restricted product availability. Additionally, the relatively short shelf life of biopesticides necessitates frequent application, increasing costs. Approximately 1.89 million farms in the US alone necessitate biopesticides for crop protection, contributing significantly to the market.
Market Dynamics
Our researchers analyzed the data with 2024 as the base year, along with the key drivers, trends, and challenges. A holistic analysis of drivers will help companies refine their marketing strategies to gain a competitive advantage.
The market encompasses a diverse range of eco-friendly pest management solutions, including microbial biocontrol agents, botanical insecticides, synthetic pheromones, RNA interference technologies, and biopesticides derived from fungal spores, bacterial toxins, and viruses. Microbial efficacy trials play a pivotal role in validating the potency of these solutions against various pests. Bacillus thuringiensis, a widely used microbial biopesticide, demonstrates impressive market penetration through its application methods, which cater to diverse agricultural sectors. Botanical insecticide formulations, derived from plants, exhibit significant growth in demand due to their low environmental impact and compatibility with integrated pest management techniques. Synthetic pheromone pest management and RNA interference in pest control represent cutting-edge innovations, offering targeted pest control and resistance management strategies.
Biopesticide development regulatory pathways are increasingly streamlined to encourage innovation and sustainability in agriculture. Environmental impact assessments are crucial in evaluating the safety and efficacy of biopesticides. Understanding insecticidal protein mode of action and fungal spore dispersal mechanisms contributes to the development of more effective and sustainable biopesticide solutions. Bacterial toxin production pathways and viral insecticide stability studies are essential components of biopesticide research and development. Growth inhibitor effects on pest development and biopesticide safety assessment protocols ensure the long-term efficacy and safety of these solutions. The non-target organism impact assessment and biopesticide shelf-life extension techniques further enhance their appeal in sustainable agriculture applications.
Adoption rates of biopesticides in developed regions are significantly higher than in developing regions, with the former accounting for over 70% of the global market share. This disparity presents a substantial opportunity for growth in emerging markets, particularly in Asia Pacific and Latin America. Integrated pest management techniques, which rely on a combination of biopesticides and other pest control methods, are increasingly popular due to their effectiveness in minimizing pesticide usage and reducing environmental impact. Overall, the market is poised for robust growth, driven by a growing demand for sustainable agriculture solutions and advancements in biotechnology.
What are the key market drivers leading to the rise in the adoption of Biopesticides Industry?
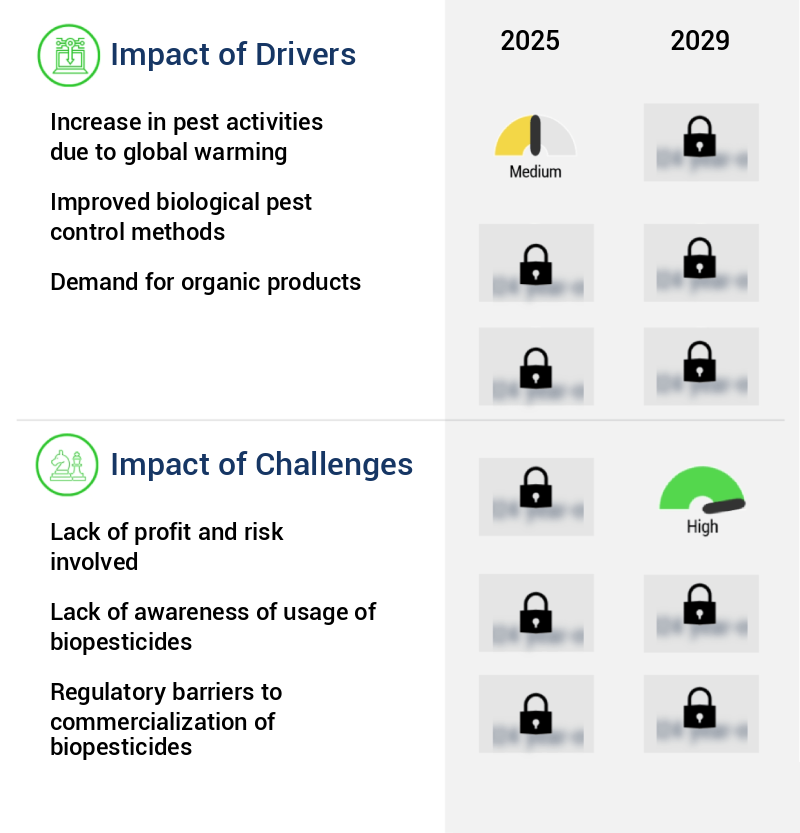
- Global warming serves as the primary catalyst for heightened pest activities, thereby fueling market growth in this sector.
- The agricultural sector faces significant challenges due to the ongoing environmental changes, particularly the increase in greenhouse gases in the Earth's atmosphere. This environmental shift is projected to raise global temperatures by approximately 3-4 degrees Celsius by the end of the century, affecting agricultural productivity and sustainability in various agroecological zones. Carbon dioxide (CO2) concentrations play a crucial role in this context. An increase in CO2 levels enhances simple sugars in leaves, reducing the nitrogen content. Consequently, insects that feed on these leaves require more nitrogen to meet their metabolic needs, leading to increased leaf consumption and potential damage to crops.
- These environmental alterations also contribute to the emergence and severity of diseases, further impacting agricultural productivity. The agricultural sector must adapt to these evolving conditions to ensure food security and sustainability. By implementing innovative farming practices and utilizing advanced technologies, farmers can mitigate the negative effects of these environmental changes and maintain crop health and productivity.
What are the market trends shaping the Biopesticides Industry?
- Advances in biopesticide development represent the current market trend. This emerging sector in agricultural science is gaining significant attention due to its eco-friendly and sustainable approach to pest control.
- The biopesticide market witnesses continuous advancements, driven by research into the genomes of pests and their natural enemies. Molecular-based technologies are employed to reconstruct the evolution of microbial enemies and disrupt their pathogenicity, offering insights into ecological interactions between biopesticides and pests. This knowledge aids in enhancing the efficacy of biopesticides by improving strains of natural microbial enemies. For instance, understanding how weeds compete with crops and develop resistance to herbicides contributes to identifying receptor proteins present in insects for detecting semi-chemicals.
- These insights enable the development of more effective biopesticides, contributing to the market's growth and diversification across various sectors. Biopesticides' adoption is on the rise, with their eco-friendly nature and minimal environmental impact making them an attractive alternative to conventional pesticides.
What challenges does the Biopesticides Industry face during its growth?
- The absence of profitability and the inherent risks present significant challenges to the expansion and growth of the industry.
- Biopesticides, a subset of the agrochemical market, exhibit unique characteristics that set them apart from conventional chemical pesticides. Their high selectivity levels allow for targeted applications to specific insect species, minimizing harm to non-target organisms and the environment. For instance, baculovirus-based bioinsecticides, such as cydia pomonella granulovirus (CpGV), cater to a niche market due to their specific targets. Despite their environmental benefits, potential adopters of biopesticides face significant challenges. The high fixed costs associated with their adoption can be a barrier for early adopters, especially when compared to the lower upfront costs of conventional chemical pesticides.
- However, as biopesticides gain wider acceptance and economies of scale are realized, these costs are expected to decrease. In summary, biopesticides offer targeted solutions to pest management challenges while minimizing environmental impact. However, their high fixed costs and niche market position present challenges for potential adopters. As the market evolves, advancements in technology and increasing awareness of environmental concerns may drive wider adoption of biopesticides.
Exclusive Technavio Analysis on Customer Landscape
The biopesticides market forecasting report includes the adoption lifecycle of the market, covering from the innovator's stage to the laggard's stage. It focuses on adoption rates in different regions based on penetration. Furthermore, the biopesticides market report also includes key purchase criteria and drivers of price sensitivity to help companies evaluate and develop their market growth analysis strategies.

Customer Landscape of Biopesticides Industry
Competitive Landscape
Companies are implementing various strategies, such as strategic alliances, biopesticides market forecast, partnerships, mergers and acquisitions, geographical expansion, and product/service launches, to enhance their presence in the industry.
AgBiTech - This company specializes in biopesticide solutions, such as Velifer, effectively managing pests like whiteflies while preserving beneficial insects.
The industry research and growth report includes detailed analyses of the competitive landscape of the market and information about key companies, including:
- AgBiTech
- Andermatt Biocontrol AG
- BASF SE
- Bayer AG
- Bioline AgroSciences
- BioWorks Inc.
- CBC (Europe) S.r.l.
- Certis USA
- Corteva Agriscience
- FMC Corporation
- Isagro S.p.A.
- Koppert Biological Systems
- Marrone Bio Innovations
- Novozymes A/S
- Nufarm
- STK Bio-Ag Technologies
- Sumitomo Chemical Co. Ltd.
- Syngenta AG
- Valent BioSciences
- Vestaron Corporation
Qualitative and quantitative analysis of companies has been conducted to help clients understand the wider business environment as well as the strengths and weaknesses of key industry players. Data is qualitatively analyzed to categorize companies as pure play, category-focused, industry-focused, and diversified; it is quantitatively analyzed to categorize companies as dominant, leading, strong, tentative, and weak.
Recent Development and News in Biopesticides Market
- In January 2024, BASF SE announced the launch of its new biopesticide product, "XenTari," a non-chemical solution for controlling fungal diseases in fruits and vegetables. This innovation marks BASF's expansion in the market, strengthening its position as a leading agrochemicals provider (BASF Press Release, 2024).
- In March 2024, Syngenta and Corteva Agriscience, two major agrochemical companies, entered into a strategic collaboration to co-develop and commercialize biopesticide products. This partnership aims to combine Syngenta's research capabilities with Corteva's market access and distribution network, creating a powerful force in the biopesticides industry (Syngenta Press Release, 2024).
- In May 2024, Marrone Bio Innovations, Inc. raised USD 30 million in a Series D financing round. The funding will be used to expand the company's global sales and marketing efforts, as well as to accelerate the development of new biopesticide products (Marrone Bio Innovations Press Release, 2024).
- In April 2025, the European Commission approved the use of Biobest's new biopesticide, "BioBee," for the control of thrips in tomato and pepper crops. This approval marks a significant milestone for Biobest, expanding its product portfolio and increasing its presence in the European market (European Commission Press Release, 2025).
Dive into Technavio's robust research methodology, blending expert interviews, extensive data synthesis, and validated models for unparalleled Biopesticides Market insights. See full methodology.
|
Market Scope |
|
|
Report Coverage |
Details |
|
Page number |
213 |
|
Base year |
2024 |
|
Historic period |
2019-2023 |
|
Forecast period |
2025-2029 |
|
Growth momentum & CAGR |
Accelerate at a CAGR of 18.6% |
|
Market growth 2025-2029 |
USD 8866.9 million |
|
Market structure |
Fragmented |
|
YoY growth 2024-2025(%) |
16.2 |
|
Key countries |
US, Canada, Germany, UK, Italy, France, China, India, Japan, Brazil, Egypt, UAE, Oman, Argentina, KSA, UAE, Brazil, and Rest of World (ROW) |
|
Competitive landscape |
Leading Companies, Market Positioning of Companies, Competitive Strategies, and Industry Risks |
Research Analyst Overview
- The market is a dynamic and evolving sector, driven by the ongoing development and adoption of innovative solutions for pest control. Insect pathogenic fungi, such as Beauveria bassiana and Metarhizium anisopliae, are gaining traction due to their target pest specificity. These fungal spores naturally occur in the environment and produce toxicity upon contact with specific insects, making them effective alternatives to synthetic pesticides. Bacillus thuringiensis, a bacterial strain, is another significant player in the market. Its toxicity is derived from bacterial toxins that affect specific insects, making it a popular choice for pest control strategies. However, the safety and environmental impact assessment of these biopesticides are crucial, requiring rigorous product lifecycle management and biopesticide registration processes.
- Nematode control agents, growth inhibitors, and fungal spores are among the various types of biopesticides under development. These solutions undergo extensive field efficacy trials, toxicity testing, and residue analysis to ensure safety and efficacy. Insecticidal proteins, RNA interference, and viral insecticides are other emerging areas in biopesticide development. Delivery systems, such as granules, emulsions, and encapsulation, are essential for effective application methods. Integrated pest management (IPM) strategies, which combine biopesticides with other pest control measures, further enhance their value. Synthetic pheromones and botanical insecticides are also integral components of the market. The market's continuous evolution is marked by advancements in formulation types, pest resistance management, and mode of action.
- As the demand for sustainable agriculture grows, biopesticides are increasingly being adopted as part of comprehensive pest control strategies.
What are the Key Data Covered in this Biopesticides Market Research and Growth Report?
-
What is the expected growth of the Biopesticides Market between 2025 and 2029?
-
USD 8.87 billion, at a CAGR of 18.6%
-
-
What segmentation does the market report cover?
-
The report is segmented by Type (Microbial biopesticides, Biochemical biopesticides, Plant-incorporated protectants (PIPs), RNA-based biopesticides, and Peptide-based biopesticides), Product (Natural products, Microbials, Macrobials, and Semiochemicals), Geography (North America, Europe, APAC, South America, and Middle East and Africa), Application (Crop Protection, Seed Treatment, and Post-Harvest), Crop Type (Cereals & Grains, Fruits & Vegetables, and Oilseeds & Pulses), and Form (Liquid, Powder, and Granular)
-
-
Which regions are analyzed in the report?
-
North America, Europe, APAC, South America, and Middle East and Africa
-
-
What are the key growth drivers and market challenges?
-
Increase in pest activities due to global warming, Lack of profit and risk involved
-
-
Who are the major players in the Biopesticides Market?
-
AgBiTech, Andermatt Biocontrol AG, BASF SE, Bayer AG, Bioline AgroSciences, BioWorks Inc., CBC (Europe) S.r.l., Certis USA, Corteva Agriscience, FMC Corporation, Isagro S.p.A., Koppert Biological Systems, Marrone Bio Innovations, Novozymes A/S, Nufarm, STK Bio-Ag Technologies, Sumitomo Chemical Co. Ltd., Syngenta AG, Valent BioSciences, and Vestaron Corporation
-
Market Research Insights
- The market encompasses a diverse range of products derived from natural sources, including formulation chemistry based on antagonistic effects against plant diseases, beneficial insects, and soil application using viral, bacterial, and fungal biocontrol agents. According to industry estimates, the market for biopesticides reached USD 5.3 billion in 2020, representing a significant growth from USD 3.9 billion in 2015. Synergistic effects between different biocontrol agents and spray technology enhance pest management strategies, contributing to the increasing adoption of biopesticides in integrated pest management programs. However, challenges such as biopesticide resistance, product stability, and environmental risk assessment remain critical considerations for market growth. For instance, the prevalence of biopesticide resistance in certain pests necessitates ongoing research and development efforts to mitigate this issue.
- Additionally, biopesticide labeling, shelf life, and human health risk assessments are essential factors influencing market expansion. Weed management and pest monitoring are key application areas for biopesticides, with seed treatment and natural enemies emerging as promising growth opportunities.
We can help! Our analysts can customize this biopesticides market research report to meet your requirements.
 RIA -
RIA - 
