
AI And Machine Learning Operationalization Software Market Size 2025-2029
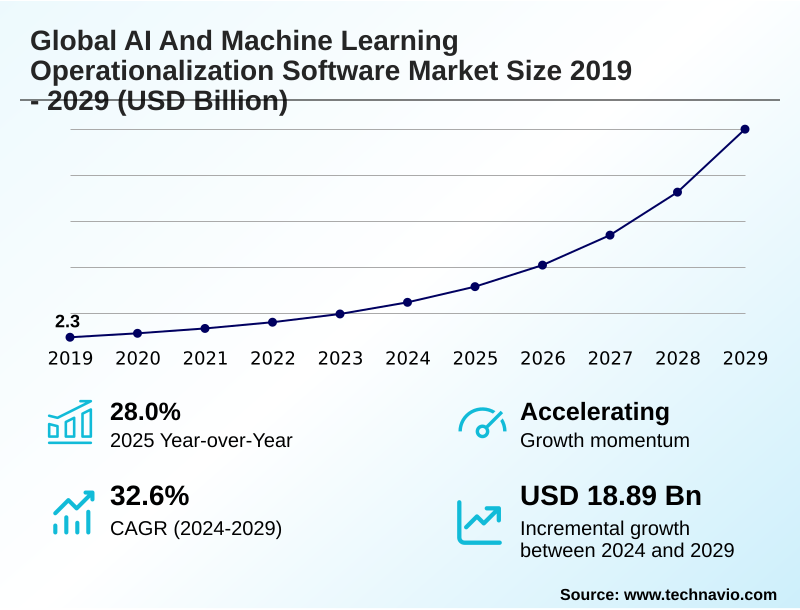
The ai and machine learning operationalization software market size is valued to increase by USD 18.89 billion, at a CAGR of 32.6% from 2024 to 2029. Critical imperative to scale AI initiatives and realize return on investment will drive the ai and machine learning operationalization software market.
Major Market Trends & Insights
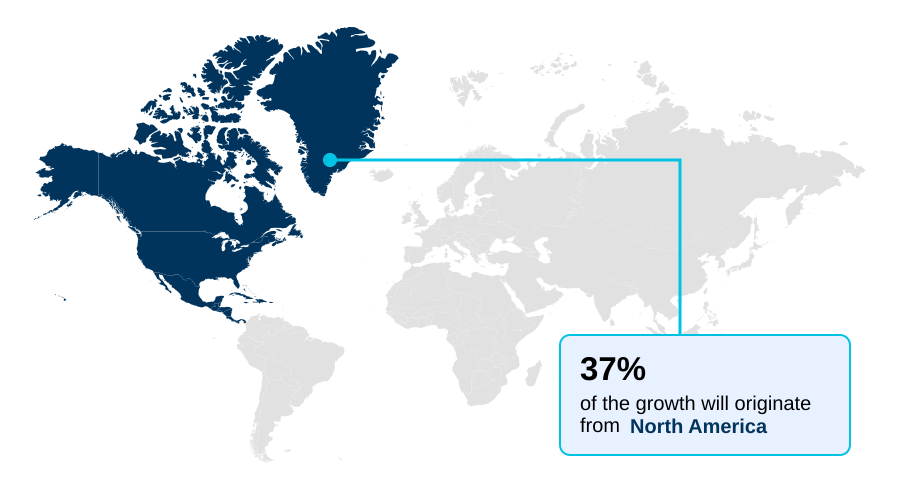
- North America dominated the market and accounted for a 37% growth during the forecast period.
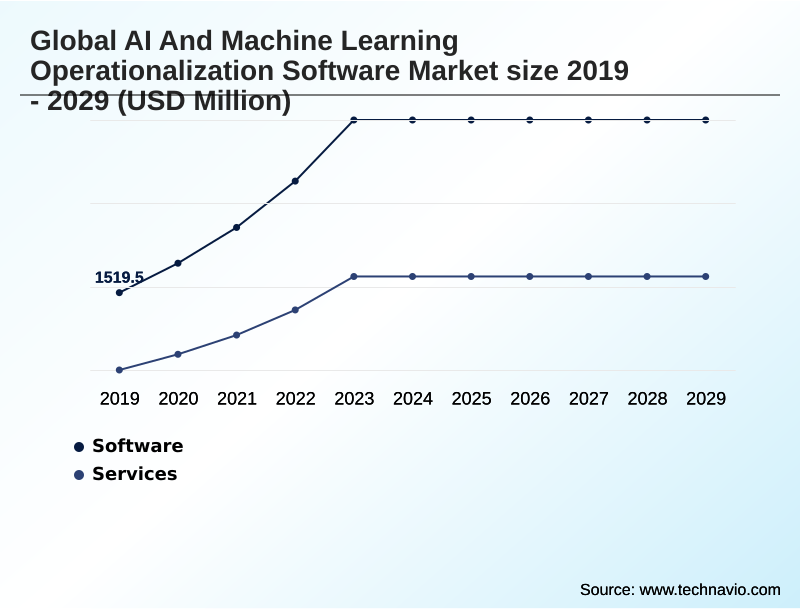
- By Component - Software segment was valued at USD 3.16 billion in 2023
- By Deployment - Cloud-based segment accounted for the largest market revenue share in 2023
Market Size & Forecast
- Market Opportunities: USD 22.69 billion
- Market Future Opportunities: USD 18.89 billion
- CAGR from 2024 to 2029 : 32.6%
Market Summary
- The AI and machine learning operationalization software market is fundamentally driven by the enterprise need to transition AI from isolated experiments to scalable, value-generating production grade AI systems. For many, this involves overcoming 'AI pilot purgatory,' where promising models fail to be deployed due to the chasm between data science and IT operations.
- This software creates an 'AI factory' through model deployment automation, robust model performance monitoring, and systematic machine learning lifecycle management. A key trend is the move toward unified AI platforms that include everything from feature store architecture to AI governance risk and compliance.
- In a practical business scenario, a retail firm uses these platforms to manage thousands of supply chain optimization models. The system automates model retraining when data and concept drift detection flags performance degradation, ensuring forecasts remain accurate.
- This industrialization of machine learning, fueled by capabilities like generative AI operationalization and large language model operations, is crucial for achieving a holistic AI strategy and tangible business outcomes.
What will be the Size of the AI And Machine Learning Operationalization Software Market during the forecast period?
Get Key Insights on Market Forecast (PDF) Get Free Sample
How is the AI And Machine Learning Operationalization Software Market Segmented?
The ai and machine learning operationalization software industry research report provides comprehensive data (region-wise segment analysis), with forecasts and estimates in "USD million" for the period 2025-2029, as well as historical data from 2019-2023 for the following segments.
- Component
- Software
- Services
- Deployment
- Cloud-based
- Hybrid
- On-premises
- End-user
- BFSI
- Healthcare and life sciences
- Manufacturing
- Retail and e-commerce
- Others
- Geography
- North America
- US
- Canada
- Mexico
- APAC
- China
- Japan
- India
- Europe
- UK
- Germany
- France
- South America
- Brazil
- Argentina
- Colombia
- Middle East and Africa
- Saudi Arabia
- UAE
- Israel
- Rest of World (ROW)
- North America
By Component Insights
The software segment is estimated to witness significant growth during the forecast period.
The software segment is central to the AI and machine learning operationalization software market, providing the technical infrastructure for comprehensive machine learning lifecycle management.
These unified AI platforms offer capabilities ranging from automated machine learning and model deployment automation to sophisticated tools for model token consumption tracking.
A key development is the rise of low-code MLOps platforms and no-code MLOps interfaces, which are instrumental in moving organizations beyond AI pilot purgatory and reducing technical debt in AI.
By abstracting complexity, this software is critical for scaling AI initiatives and building a true enterprise AI capability.
Firms leveraging these tools report a reduction in model deployment errors by over 30%, accelerating AI time-to-value acceleration and enabling a holistic AI strategy.
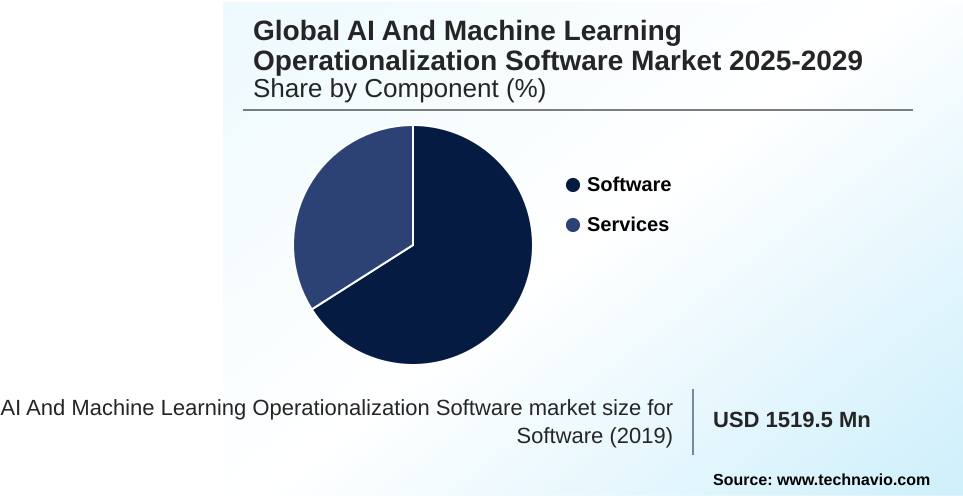
The Software segment was valued at USD 3.16 billion in 2023 and showed a gradual increase during the forecast period.
Regional Analysis
North America is estimated to contribute 37% to the growth of the global market during the forecast period.Technavio’s analysts have elaborately explained the regional trends and drivers that shape the market during the forecast period.
See How AI And Machine Learning Operationalization Software Market Demand is Rising in North America Get Free Sample
The geographic landscape of the AI and machine learning operationalization software market is led by North America, which is projected to contribute 37% of the market's incremental growth.
This dominance is fueled by the region's high AI maturity and the presence of major technology providers.
However, the APAC region is expected to exhibit the fastest growth, with a projected CAGR of 33.0%, driven by rapid digitalization in countries like China and India.
Across regions, enterprises are using these platforms for robust ML data management and model performance monitoring.
Key applications include the industrialization of machine learning in manufacturing, where data and concept drift detection is crucial, and the financial sector, which relies on strict model version control for credit scoring models.
Other sectors, such as transportation, utilize these systems for autonomous vehicle control systems.
Market Dynamics
Our researchers analyzed the data with 2024 as the base year, along with the key drivers, trends, and challenges. A holistic analysis of drivers will help companies refine their marketing strategies to gain a competitive advantage.
- Achieving enterprise-wide AI adoption requires a clear understanding of both strategy and execution. Decision-makers often begin by weighing the comparison of cloud-based vs on-premises MLOps, a choice that frames their entire operational strategy. A core early task is implementing CI/CD for machine learning models, which is essential for automation but introduces challenges of integrating MLOps into existing infrastructure.
- Once established, the focus shifts to ensuring model reliability through best practices for monitoring model drift in production. For organizations venturing into generative AI, having the right tools for managing large language model lifecycle becomes critical. Security is another key pillar, demanding strategies for securing AI models against adversarial attacks.
- The role of feature stores in reducing training-serving skew is pivotal for maintaining accuracy, as is having a robust MLOps platform for diagnostic AI models in regulated fields. The talent bottleneck necessitates clear strategies for overcoming MLOps talent shortage, often involving the adoption of benefits of low-code MLOps platforms for business analysts.
- As the portfolio of models grows, so does the need for managing AI model portfolios at enterprise scale and for specific use cases like MLOps for real-time fraud detection systems. Ultimately, a successful approach is defined by automating AI governance and compliance reporting, where automated systems can decrease reporting times by over 50% compared to manual methods.
- This involves implementing a responsible AI deployment framework, ensuring AI regulatory compliance with GDPR and AI act, and applying an AI risk management framework for financial services. The industrialization of machine learning in manufacturing and achieving AI time-to-value acceleration in retail are direct outcomes of this disciplined approach, which extends to managing model portfolios in financial services.
What are the key market drivers leading to the rise in the adoption of AI And Machine Learning Operationalization Software Industry?
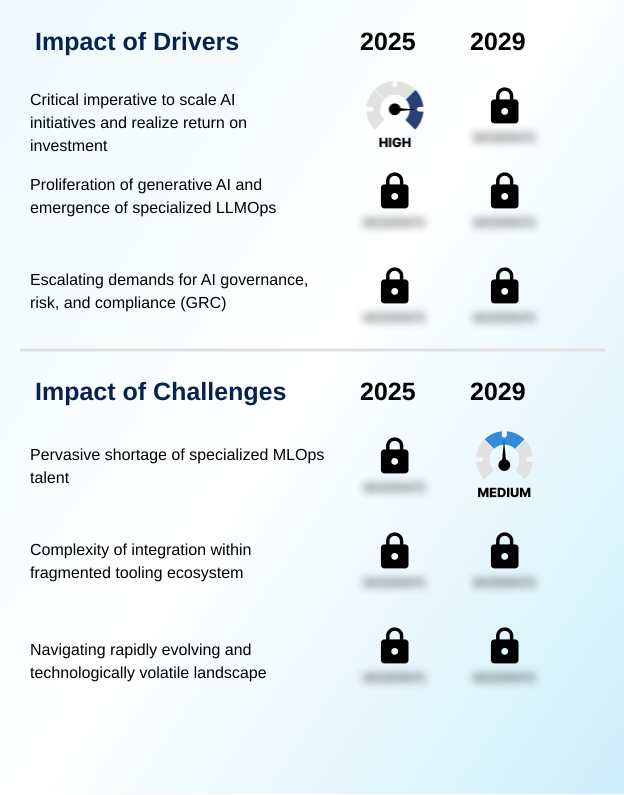
- The market is significantly driven by the critical organizational imperative for businesses to scale their AI initiatives and realize a tangible return on investment.
- The market is heavily driven by the enterprise-wide push for AI governance risk and compliance. This has elevated the importance of platforms that provide a framework for managing model portfolios and ensuring auditable AI systems.
- Solutions that automate model validation and testing can reduce model failure rates in production by up to 50%.
- The inclusion of a central AI model registry, model explainability features, and role-based access control for AI is now a baseline requirement for production grade AI systems.
- This focus on governance directly supports AI regulatory compliance and enables a robust AI risk management framework.
- For instance, the ability to provide AI model lineage tracking and perform automated model retraining accelerates AI regulatory compliance and audit processes by more than 60%, making it a crucial driver for regulated industries.
What are the market trends shaping the AI And Machine Learning Operationalization Software Industry?
- A significant market trend is the shift from complex, code-heavy MLOps platforms to more accessible, business-focused solutions. These solutions leverage low-code and no-code interfaces to democratize AI operationalization.
- A primary market trend is the rapid evolution toward the operationalization of advanced AI, particularly generative AI operationalization. This has created demand for platforms that manage the complete large language model operations lifecycle, including tools for prompt engineering workflow and vector database management.
- Firms using these systems for real-time fraud detection systems and algorithmic trading systems report a 25% improvement in model deployment speed. Furthermore, the integration of a dedicated feature store architecture for real time inference serving is becoming standard, helping reduce model prediction errors by up to 20%. These platforms increasingly include AI model guardrails to support responsible AI deployment.
- This focus on specialized tooling is enabling the use of AI in mission-critical applications like predictive maintenance models and supply chain optimization models, while addressing key AI ethical considerations.
What challenges does the AI And Machine Learning Operationalization Software Industry face during its growth?
- A primary challenge constraining market growth is the pervasive shortage of specialized MLOps talent required to implement and manage complex AI operationalization platforms.
- A significant market challenge is the acute MLOps talent shortage, compounded by high AI systems integration complexity. This friction is evident as integration projects frequently take twice as long as initially planned.
- Enterprises pursuing a hybrid cloud MLOps or multi-cloud MLOps strategy face difficulties in creating cohesive workflows across disparate environments, even with modern tools for containerization for ML models and Kubernetes for ML. The need for specialized data versioning tools and experiment tracking systems adds another layer of complexity.
- As a result, positions for engineers skilled in infrastructure as code for AI remain unfilled for over 90 days on average. This bottleneck slows the deployment of valuable applications like diagnostic AI models and personalized medicine algorithms, hindering drug discovery pipeline optimization and other high-value use cases.
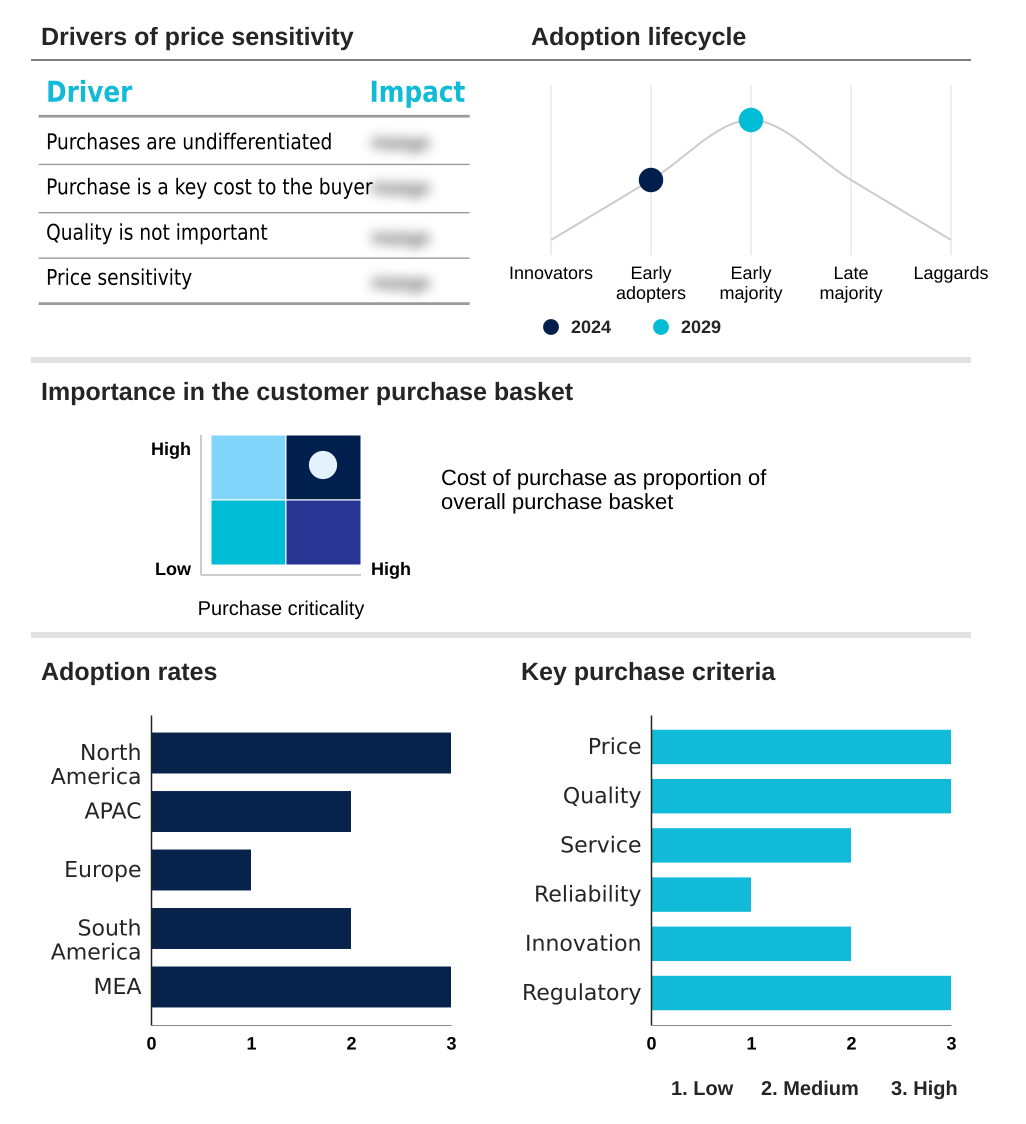
Exclusive Technavio Analysis on Customer Landscape
The ai and machine learning operationalization software market forecasting report includes the adoption lifecycle of the market, covering from the innovator’s stage to the laggard’s stage. It focuses on adoption rates in different regions based on penetration. Furthermore, the ai and machine learning operationalization software market report also includes key purchase criteria and drivers of price sensitivity to help companies evaluate and develop their market growth analysis strategies.
Customer Landscape of AI And Machine Learning Operationalization Software Industry
Competitive Landscape
Companies are implementing various strategies, such as strategic alliances, ai and machine learning operationalization software market forecast, partnerships, mergers and acquisitions, geographical expansion, and product/service launches, to enhance their presence in the industry.
Alteryx Inc. - Delivers no-code AI and machine learning operationalization through automated machine learning, enabling explainable machine learning for cross-departmental use.
The industry research and growth report includes detailed analyses of the competitive landscape of the market and information about key companies, including:
- Alteryx Inc.
- Amazon Web Services Inc.
- Arize AI Inc.
- Cloudera Inc.
- Databricks Inc.
- Dataiku Inc.
- DataRobot Inc.
- Domino Data Lab Inc.
- Google Cloud
- H2O.ai Inc.
- IBM Corp.
- Kubeflow
- Microsoft Corp.
- MLflow Project
- Neptune Labs Inc.
- SAS Institute Inc.
- Seldon Technologies
- Tecton Inc.
- Weights and Biases
Qualitative and quantitative analysis of companies has been conducted to help clients understand the wider business environment as well as the strengths and weaknesses of key industry players. Data is qualitatively analyzed to categorize companies as pure play, category-focused, industry-focused, and diversified; it is quantitatively analyzed to categorize companies as dominant, leading, strong, tentative, and weak.
Recent Development and News in Ai and machine learning operationalization software market
- In September, 2024, Databricks Inc. announced a strategic partnership with a leading global consulting firm to deliver pre-built MLOps solutions for the financial services industry, focusing on accelerating regulatory compliance and AI-driven risk management.
- In November, 2024, DataRobot Inc. launched its new LLM Operations suite, providing enterprises with advanced tools for prompt engineering, response monitoring, and cost management for generative AI applications at scale.
- In February, 2025, Amazon Web Services Inc. acquired a prominent AI model observability startup, integrating its advanced drift detection and explainability capabilities directly into the Amazon SageMaker platform to enhance post-deployment model management.
- In April, 2025, IBM Corp. announced a major collaboration with a European government consortium to develop a sovereign AI platform leveraging its watsonx.governance toolkit, ensuring compliance with the EU AI Act for public sector applications.
Dive into Technavio’s robust research methodology, blending expert interviews, extensive data synthesis, and validated models for unparalleled AI And Machine Learning Operationalization Software Market insights. See full methodology.
| Market Scope | |
|---|---|
| Page number | 300 |
| Base year | 2024 |
| Historic period | 2019-2023 |
| Forecast period | 2025-2029 |
| Growth momentum & CAGR | Accelerate at a CAGR of 32.6% |
| Market growth 2025-2029 | USD 18886.4 million |
| Market structure | Fragmented |
| YoY growth 2024-2025(%) | 28.0% |
| Key countries | US, Canada, Mexico, China, Japan, India, South Korea, Australia, Indonesia, UK, Germany, France, The Netherlands, Italy, Spain, Brazil, Argentina, Colombia, Saudi Arabia, UAE, Israel, South Africa and Turkey |
| Competitive landscape | Leading Companies, Market Positioning of Companies, Competitive Strategies, and Industry Risks |
Research Analyst Overview
- The AI and machine learning operationalization software market has become a critical enabler for enterprises seeking to translate data science investments into tangible outcomes. A core boardroom-level focus is on AI governance risk and compliance, which necessitates a platform providing robust machine learning lifecycle management.
- Success is predicated on mastering the entire workflow, from ML data management and data versioning tools to sophisticated model deployment automation and real time inference serving. Organizations must implement production grade AI systems with a centralized AI model registry and automated model validation and testing.
- The challenge of data and concept drift detection is addressed through continuous model performance monitoring and automated model retraining. The rise of large language model operations and generative AI operationalization has introduced new requirements, including prompt engineering workflow and vector database management, with model token consumption tracking becoming a key cost-control measure.
- Platforms that offer model explainability, role-based access control for AI, and AI model guardrails are essential for managing risk. The architectural debate continues between building a multi-cloud MLOps strategy or a hybrid cloud MLOps setup, often leveraging containerization for ML models and Kubernetes for ML. This is supported by infrastructure as code for AI.
- The adoption of a feature store architecture to combat training-serving skew, the use of experiment tracking systems, and the shift towards low-code MLOps platforms and no-code MLOps interfaces with automated machine learning are defining the path to scalable AI, with some firms achieving a 30% reduction in model-related operational incidents.
What are the Key Data Covered in this AI And Machine Learning Operationalization Software Market Research and Growth Report?
-
What is the expected growth of the AI And Machine Learning Operationalization Software Market between 2025 and 2029?
-
USD 18.89 billion, at a CAGR of 32.6%
-
-
What segmentation does the market report cover?
-
The report is segmented by Component (Software, Services), Deployment (Cloud-based, Hybrid, On-premises), End-user (BFSI, Healthcare and life sciences, Manufacturing, Retail and e-commerce, Others) and Geography (North America, APAC, Europe, South America, Middle East and Africa)
-
-
Which regions are analyzed in the report?
-
North America, APAC, Europe, South America and Middle East and Africa
-
-
What are the key growth drivers and market challenges?
-
Critical imperative to scale AI initiatives and realize return on investment, Pervasive shortage of specialized MLOps talent
-
-
Who are the major players in the AI And Machine Learning Operationalization Software Market?
-
Alteryx Inc., Amazon Web Services Inc., Arize AI Inc., Cloudera Inc., Databricks Inc., Dataiku Inc., DataRobot Inc., Domino Data Lab Inc., Google Cloud, H2O.ai Inc., IBM Corp., Kubeflow, Microsoft Corp., MLflow Project, Neptune Labs Inc., SAS Institute Inc., Seldon Technologies, Tecton Inc. and Weights and Biases
-
Market Research Insights
- The market's momentum is driven by the clear business impact of adopting a systematic approach to AI. Enterprises leveraging MLOps are accelerating AI time-to-value by over 50% compared to traditional, manual deployment methods. This is critical for scaling AI initiatives and moving beyond experimental phases.
- The industrialization of machine learning is enabled by platforms that support the entire lifecycle, including the management of complex assets like predictive maintenance models and credit scoring models. Furthermore, the focus on responsible AI deployment and ai regulatory compliance is paramount.
- Modern platforms can reduce compliance audit reporting efforts by up to 40% through features that facilitate auditable AI systems and AI model lineage tracking. This focus on governance transforms AI from a high-risk novelty into a managed enterprise ai capability, ensuring it aligns with a holistic AI strategy.
We can help! Our analysts can customize this ai and machine learning operationalization software market research report to meet your requirements.
 RIA -
RIA - 
