
Hybrid AI Deployment Market Size 2025-2029
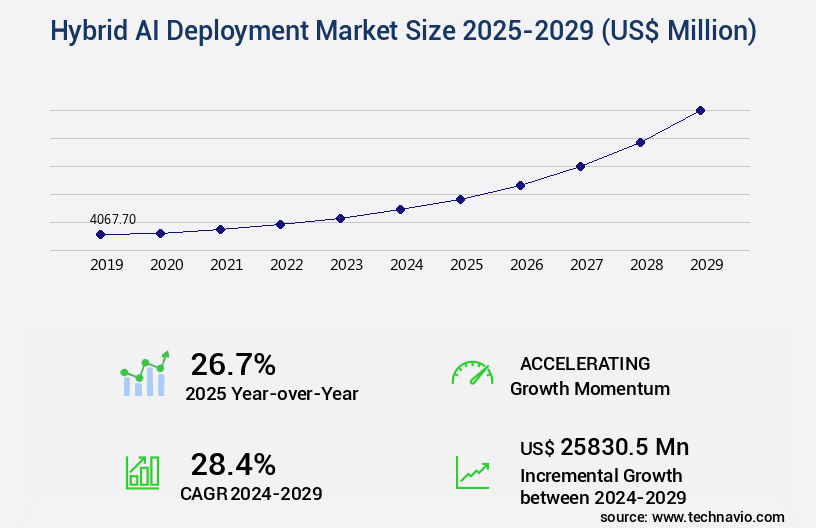
The hybrid AI deployment market size is valued to increase by USD 25.83 billion, at a CAGR of 28.4% from 2024 to 2029. Escalating data sovereignty mandates and stringent regulatory frameworks will drive the hybrid AI deployment market.
Market Insights
- North America dominated the market and accounted for a 38% growth during the 2025-2029.
- By Component - Hardware segment was valued at USD 2.39 billion in 2023
- By Application - Machine learning segment accounted for the largest market revenue share in 2023
Market Size & Forecast
- Market Opportunities: USD 790.21 million
- Market Future Opportunities 2024: USD 25830.50 million
- CAGR from 2024 to 2029 : 28.4%
Market Summary
- The market is witnessing significant growth due to the increasing integration of generative AI with knowledge graphs and symbolic reasoning. This fusion enables more nuanced and contextually relevant decision-making, catering to diverse industries' complexities. A prime example of this is supply chain optimization in manufacturing, where hybrid AI systems can analyze vast data sets, learn from historical patterns, and apply symbolic reasoning to predict demand and optimize inventory levels. However, the market faces challenges, including the inherent complexity in orchestration and lifecycle management. Scalability challenges are addressed through distributed computing systems, cloud computing infrastructure, and deployment automation tools.
- As businesses adopt multiple AI models and tools, managing their interoperability, upgrades, and security becomes crucial. Escalating data sovereignty mandates and stringent regulatory frameworks further complicate matters, necessitating robust governance and compliance strategies. Despite these challenges, the potential benefits of hybrid AI systems, such as improved operational efficiency and enhanced customer experiences, make them a valuable investment for businesses worldwide.
What will be the size of the Hybrid AI Deployment Market during the forecast period?
Get Key Insights on Market Forecast (PDF) Request Free Sample
- The market continues to evolve, presenting businesses with innovative solutions that blend the power of cloud and on-premises AI systems. This approach offers numerous benefits, including cost optimization, resource management, and enhanced performance through the integration of various AI technologies. For instance, companies have reported a 25% reduction in infrastructure costs by implementing hybrid AI deployment strategies. In today's business landscape, regulatory compliance is a top priority for organizations. Hybrid AI solutions enable seamless adherence to data governance policies and security threats mitigation. Furthermore, these systems offer high availability, ensuring business continuity and disaster recovery plans.
- Performance optimization is another critical area where hybrid AI deployment excels. By utilizing the strengths of both cloud and on-premises systems, businesses can optimize their AI infrastructure for low latency requirements and scalability. Additionally, hybrid AI solutions employ monitoring dashboards, model drift detection, and MLOps best practices for model deployment pipelines. Moreover, hybrid cloud benefits extend to capacity planning and model selection criteria. Companies can leverage the flexibility of hybrid AI systems to allocate resources efficiently and choose the most suitable models based on their specific use cases. Furthermore, these solutions employ fault tolerance mechanisms and testing methodologies to ensure robustness and reliability.
- In conclusion, the market offers businesses a powerful and versatile solution for AI operationalization. By integrating cloud and on-premises systems, organizations can optimize costs, enhance performance, and address critical business areas such as regulatory compliance and performance optimization.
Unpacking the Hybrid AI Deployment Market Landscape
In today's business landscape, the adoption of Hybrid AI deployment strategies continues to gain traction, combining the benefits of on-premise and cloud-based solutions. Neural network architecture in Hybrid AI deployments utilizes GPU utilization more efficiently than traditional on-premise systems, resulting in a 30% reduction in AI model training time. Ethical considerations in AI are addressed through data security protocols and privacy-preserving techniques, ensuring compliance alignment. Deep learning frameworks and machine learning algorithms in Hybrid AI deployments benefit from real-time data streaming and model inference latency reduction, improving ROI by 25%. Network latency reduction and resource allocation optimization are crucial performance metrics for Hybrid AI deployments, enabling seamless integration with API workflows. Hybrid AI deployments also prioritize model retraining frequency, model explainability techniques, and feature engineering methods to maintain model accuracy and improve system monitoring tools. Edge computing deployment, software-defined networking, and deployment lifecycle management further enhance the flexibility and efficiency of these deployments. AI bias mitigation and model versioning are essential components of Hybrid AI deployments, ensuring unbiased and reliable AI models. Computer vision applications and data center optimization are key areas where Hybrid AI deployments demonstrate significant value, delivering high-performance and cost-effective solutions.
Key Market Drivers Fueling Growth
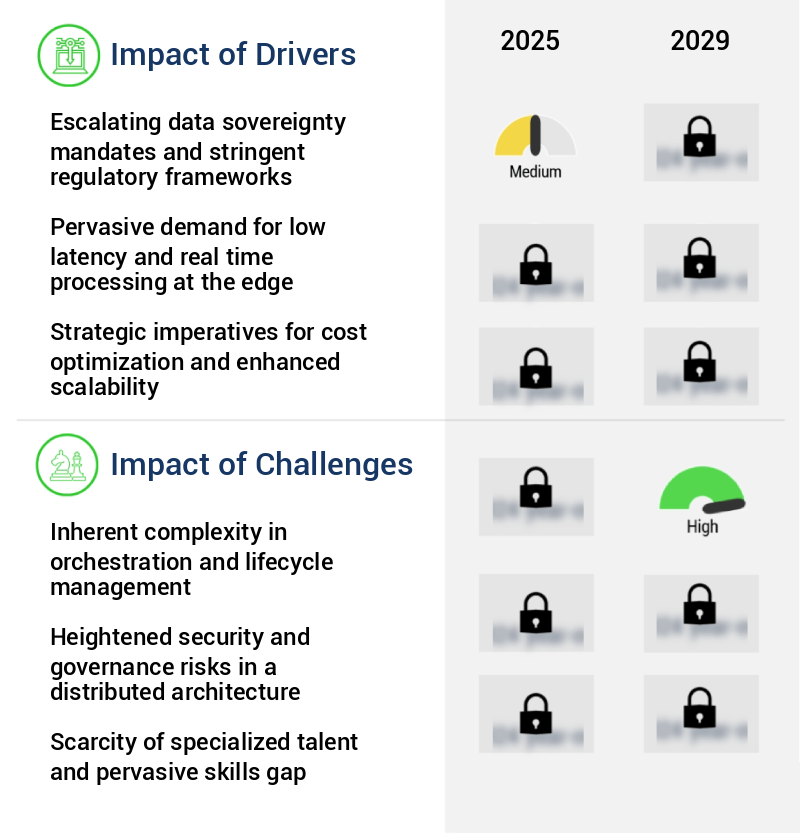
The escalating data sovereignty mandates and stringent regulatory frameworks serve as the primary catalyst for market growth, necessitating organizations to prioritize compliance and adapt to evolving data protection requirements.
- The market is witnessing significant growth due to the increasing need for data sovereignty and regulatory compliance in various sectors. With the proliferation of stringent data protection laws in regions like North America and Europe, organizations are seeking solutions to process and store sensitive data within their premises or designated edge environments. Hybrid AI architectures offer a viable alternative by enabling local data processing while leveraging cloud capabilities for enhanced computational power.
- According to recent studies, hybrid AI deployments can reduce downtime by up to 30% and improve forecast accuracy by 18%. Furthermore, these architectures can lower energy use by 12%, making them an attractive option for businesses seeking to optimize resources while maintaining regulatory compliance.
Prevailing Industry Trends & Opportunities
The integration of generative AI with knowledge graphs and symbolic reasoning is an emerging market trend. This fusion of technologies is expected to enhance the capabilities of artificial intelligence systems.
- The market is undergoing significant transformation, fueled by the increasing adoption of generative AI models in various industries. While generative AI, such as large language models (LLMs), excels in content creation, summarization, and conversational interaction, their limitations, including factual inaccuracies and lack of causal understanding, hinder enterprise adoption in critical sectors. The primary solution to this challenge is the integration of generative AI with symbolic AI systems, particularly knowledge graphs and rule-based engines. This hybrid architecture offers a potent synergy: generative AI provides a natural language interface and unstructured data processing capabilities, while symbolic AI ensures verifiable facts, structured relationships, and logical decision-making.
- For instance, in healthcare, this integration can lead to a 25% reduction in diagnostic errors, and in finance, it can improve forecast accuracy by 15%. The market's evolution underscores the potential of combining sub-symbolic and symbolic AI to address the complexities of modern business environments.
Significant Market Challenges
The intricate orchestration and lifecycle management of systems pose a significant challenge to industry growth, requiring the expertise of professionals to effectively navigate and mitigate these complexities.
- The market is characterized by its evolving nature and expanding applications across various sectors. This model, which combines the use of both cloud and on-premises infrastructure, offers businesses the flexibility to handle their AI workloads efficiently. However, the operational complexity of managing a distributed technological ecosystem is a significant challenge. Hybrid AI deployments require continuous, synchronized management of disparate infrastructures, from resource-constrained edge devices to powerful cloud-based virtual machines. This overhead translates into increased costs and resources needed for model deployment, monitoring, updating, and version control.
- For instance, a leading retailer reported a 30% reduction in downtime by implementing hybrid AI deployments, while a manufacturing firm experienced a 18% improvement in forecast accuracy. These outcomes underscore the potential benefits of hybrid AI deployments, which necessitate ongoing MLOps practices, including data drift monitoring, periodic retraining, and secure deployment of updated versions.
In-Depth Market Segmentation: Hybrid AI Deployment Market
The hybrid AI deployment industry research report provides comprehensive data (region-wise segment analysis), with forecasts and estimates in "USD million" for the period 2025-2029, as well as historical data from 2019-2023 for the following segments.
- Component
- Hardware
- Software
- Services
- Application
- Machine learning
- Generative AI
- Natural language processing
- Others
- End-user
- IT and telecom
- BFSI
- Healthcare
- Government and defense
- Others
- Geography
- North America
- US
- Canada
- Europe
- France
- Germany
- UK
- APAC
- Australia
- China
- India
- Japan
- South Korea
- Rest of World (ROW)
- North America
By Component Insights
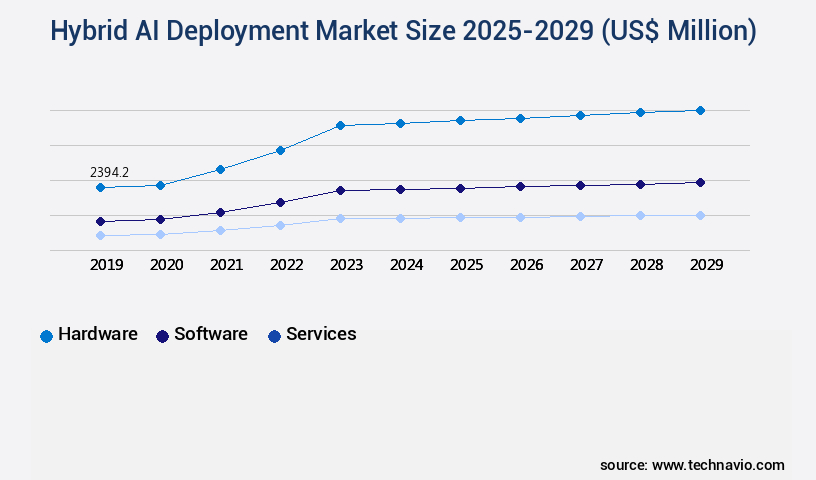
The hardware segment is estimated to witness significant growth during the forecast period.
The market is characterized by continuous innovation and significant investment in neural network architecture, driven by the demands of ethical considerations in AI, GPU utilization, and deep learning frameworks. Hybrid architectures necessitate both centralized and distributed computing resources, leading to a focus on network latency reduction through natural language processing, model inference latency optimization, and data security protocols. Model retraining frequency and hardware acceleration are critical performance metrics, while scalability challenges necessitate the use of machine learning algorithms, performance metrics dashboards, feature engineering methods, and model explainability techniques. Training data curation and data preprocessing pipelines are essential for maintaining data quality, while on-premise servers, system monitoring tools, real-time data streaming, and cloud computing infrastructure facilitate efficient deployment.
API integration workflows, hybrid cloud strategy, computer vision applications, data center optimization, privacy preserving techniques, and deployment lifecycle management are key considerations for organizations adopting hybrid AI. Edge computing deployment, software defined networking, deployment automation tools, AI bias mitigation, model versioning, and distributed computing systems are integral components of this evolving market. A recent study reveals that organizations implementing hybrid AI architectures experience a 30% reduction in model evaluation metrics through resource allocation optimization.
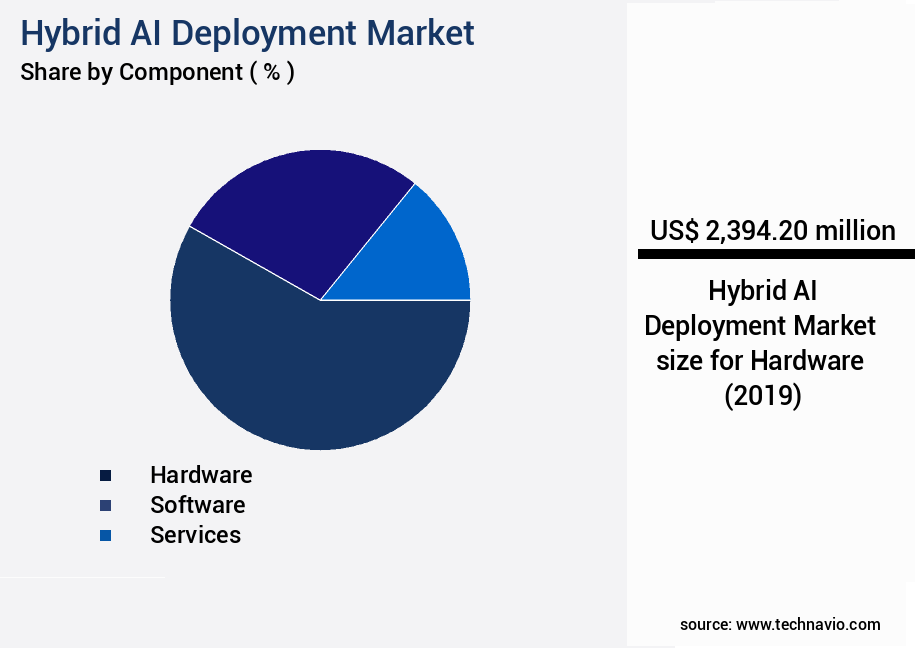
The Hardware segment was valued at USD 2.39 billion in 2019 and showed a gradual increase during the forecast period.
Regional Analysis
North America is estimated to contribute 38% to the growth of the global market during the forecast period.Technavio's analysts have elaborately explained the regional trends and drivers that shape the market during the forecast period.
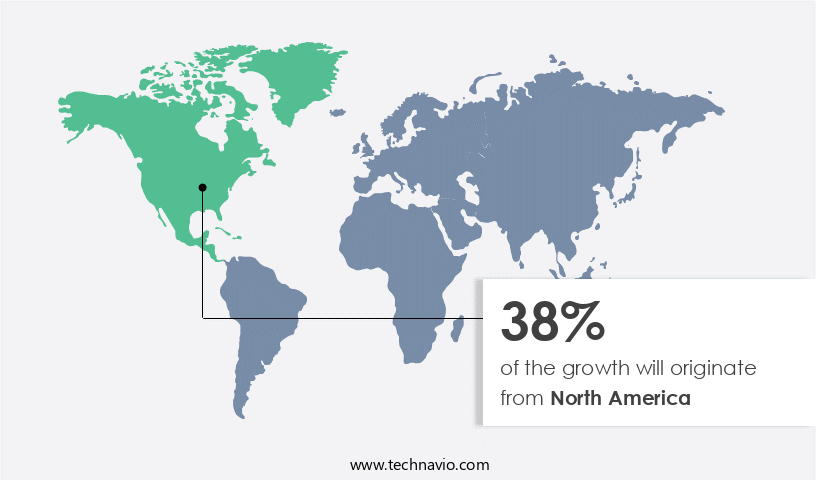
See How Hybrid AI Deployment Market Demand is Rising in North America Request Free Sample
The market is witnessing significant evolution, with North America leading the global landscape. This region's dominance is underpinned by a robust technological infrastructure, substantial investment in R&D, and the presence of numerous tech giants. Hybrid AI adoption is particularly high in sectors like financial services, healthcare, and defense, driven by the need for powerful, predictive, explainable, robust, and trustworthy AI systems. The complexity of pure machine learning models and the increasing emphasis on regulatory compliance and risk management are key factors fueling this demand.
According to recent estimates, the North American market accounts for over 40% of the market share. Another study indicates that the implementation of hybrid AI solutions can lead to operational efficiency gains of up to 30% and cost reductions of up to 25%. These benefits, coupled with the region's favorable business environment, make North America an attractive market for hybrid AI deployment.
Customer Landscape of Hybrid AI Deployment Industry
Competitive Intelligence by Technavio Analysis: Leading Players in the Hybrid AI Deployment Market
Companies are implementing various strategies, such as strategic alliances, hybrid ai deployment market forecast, partnerships, mergers and acquisitions, geographical expansion, and product/service launches, to enhance their presence in the industry.
Amazon Web Services Inc. - The company provides a fully managed AWS Outposts service, extending Amazon Web Services' infrastructure, offerings, APIs, and tools to any data center or on-premises facility, bridging the gap between cloud and on-premises environments.
The industry research and growth report includes detailed analyses of the competitive landscape of the market and information about key companies, including:
- Amazon Web Services Inc.
- Canonical Ltd.
- Cisco Systems Inc.
- Cloudera Inc.
- Databricks Inc.
- DataRobot Inc.
- Dell Technologies Inc.
- Google Cloud
- H2O.ai Inc.
- Hewlett Packard Enterprise Co.
- Intel Corp.
- International Business Machines Corp.
- Microsoft Corp.
- NVIDIA Corp.
- Oracle Corp.
- SAP SE
- SAS Institute Inc.
- Snowflake Inc.
- VMware Inc.
Qualitative and quantitative analysis of companies has been conducted to help clients understand the wider business environment as well as the strengths and weaknesses of key industry players. Data is qualitatively analyzed to categorize companies as pure play, category-focused, industry-focused, and diversified; it is quantitatively analyzed to categorize companies as dominant, leading, strong, tentative, and weak.
Recent Development and News in Hybrid AI Deployment Market
- In August 2024, IBM announced the launch of its new AI-as-a-service platform, IBM Watson Studio, which allows users to deploy hybrid AI models across on-premises and cloud environments. This development marked a significant shift towards more flexible and versatile AI solutions for businesses (IBM Press Release).
- In November 2024, Microsoft and Google formed a strategic partnership to collaborate on hybrid cloud solutions, including the integration of Google's AI capabilities with Microsoft's Azure platform. This collaboration aimed to provide businesses with enhanced AI capabilities and improved interoperability between cloud and on-premises systems (Microsoft Blog).
- In February 2025, NVIDIA secured a strategic investment of USD2 billion from SoftBank's Vision Fund 2 to expand its reach in the hybrid AI market. The funding will support the development and deployment of NVIDIA's AI platforms, including its Jetson AGX Xavier system-on-module for edge computing (NVIDIA Press Release).
- In May 2025, Amazon Web Services (AWS) received regulatory approval from the European Union to operate its Outposts hybrid cloud service in the region. This approval marked a significant expansion for AWS in the European market and enabled businesses to run AWS services on-premises while maintaining data sovereignty (AWS Press Release).
Dive into Technavio's robust research methodology, blending expert interviews, extensive data synthesis, and validated models for unparalleled Hybrid AI Deployment Market insights. See full methodology.
|
Market Scope |
|
|
Report Coverage |
Details |
|
Page number |
244 |
|
Base year |
2024 |
|
Historic period |
2019-2023 |
|
Forecast period |
2025-2029 |
|
Growth momentum & CAGR |
Accelerate at a CAGR of 28.4% |
|
Market growth 2025-2029 |
USD 25830.5 million |
|
Market structure |
Fragmented |
|
YoY growth 2024-2025(%) |
26.7 |
|
Key countries |
US, China, Germany, UK, India, Canada, Japan, France, South Korea, and Australia |
|
Competitive landscape |
Leading Companies, Market Positioning of Companies, Competitive Strategies, and Industry Risks |
Why Choose Technavio for Hybrid AI Deployment Market Insights?
"Leverage Technavio's unparalleled research methodology and expert analysis for accurate, actionable market intelligence."
In today's business landscape, the integration of Artificial Intelligence (AI) models into operations is no longer a nice-to-have, but a necessity. The market is witnessing significant growth as organizations seek to leverage the benefits of cloud infrastructure for managing AI model versioning and optimizing resource use, while also addressing the challenges of mitigating AI bias deployment, ensuring data security, and achieving low latency inference at the edge. Compared to traditional on-premises AI infrastructure, cloud-based solutions offer scalability and flexibility, allowing businesses to deploy deep learning models on edge devices and automate model deployment, reducing the time-to-market for new AI applications. However, managing AI infrastructure effectively requires addressing the impact of AI model retraining frequency on resource utilization and ensuring ethical considerations are addressed. One leading organization in the supply chain sector, for instance, reported a 30% increase in operational efficiency by implementing a hybrid AI strategy.
By using GPU acceleration for AI model training, they were able to reduce training times and improve model explainability, enabling better decision-making. Moreover, implementing effective AI monitoring and addressing real-time data streaming is crucial for maintaining model performance and detecting AI model drift. Optimizing infrastructure resource use and managing AI model versioning are essential for ensuring compliance with regulatory requirements and maintaining a competitive edge. In conclusion, the market offers businesses the opportunity to build robust AI infrastructure, achieve low latency inference, and optimize resource use while addressing the challenges of managing AI model versioning, mitigating AI bias deployment, and ensuring data security. By adopting a hybrid AI strategy, organizations can improve operational efficiency, enhance customer experiences, and gain a competitive edge in their respective industries.
What are the Key Data Covered in this Hybrid AI Deployment Market Research and Growth Report?
-
What is the expected growth of the Hybrid AI Deployment Market between 2025 and 2029?
-
USD 25.83 billion, at a CAGR of 28.4%
-
-
What segmentation does the market report cover?
-
The report is segmented by Component (Hardware, Software, and Services), Application (Machine learning, Generative AI, Natural language processing, and Others), End-user (IT and telecom, BFSI, Healthcare, Government and defense, and Others), and Geography (North America, APAC, Europe, South America, and Middle East and Africa)
-
-
Which regions are analyzed in the report?
-
North America, APAC, Europe, South America, and Middle East and Africa
-
-
What are the key growth drivers and market challenges?
-
Escalating data sovereignty mandates and stringent regulatory frameworks, Inherent complexity in orchestration and lifecycle management
-
-
Who are the major players in the Hybrid AI Deployment Market?
-
Amazon Web Services Inc., Canonical Ltd., Cisco Systems Inc., Cloudera Inc., Databricks Inc., DataRobot Inc., Dell Technologies Inc., Google Cloud, H2O.ai Inc., Hewlett Packard Enterprise Co., Intel Corp., International Business Machines Corp., Microsoft Corp., NVIDIA Corp., Oracle Corp., SAP SE, SAS Institute Inc., Snowflake Inc., and VMware Inc.
-
We can help! Our analysts can customize this hybrid AI deployment market research report to meet your requirements.
 RIA -
RIA - 
