Observability Platform Market Analysis, Size, and Forecast 2026-2030: North America (US, Canada, and Mexico), Europe (Germany, UK, and France), APAC (China, Japan, and India), South America (Brazil and Argentina), Middle East and Africa (Saudi Arabia, UAE, and South Africa), and Rest of World (ROW)

Observability Platform Market Analysis, Size, and Forecast 2026-2030:
North America (US, Canada, and Mexico), Europe (Germany, UK, and France), APAC (China, Japan, and India), South America (Brazil and Argentina), Middle East and Africa (Saudi Arabia, UAE, and South Africa), and Rest of World (ROW)

Published: Mar 2026 281 Pages SKU: IRTNTR77196

Market Overview at a Glance

$1.44 B
Market Opportunity
8.6%
CAGR 2025 - 2030
54.2%
North America Growth
$1.94 B
Solutions segment 2024

Observability Platform Market Size 2026-2030

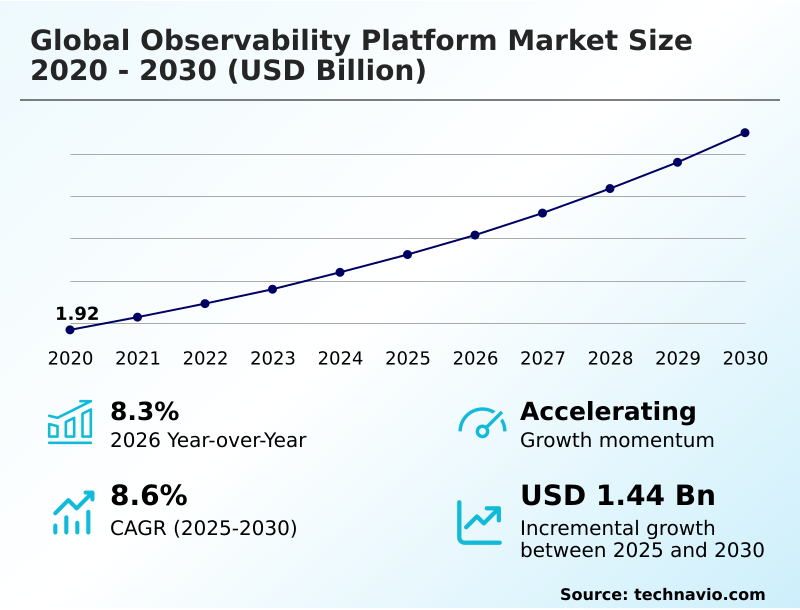
The observability platform market size is valued to increase by USD 1.44 billion, at a CAGR of 8.6% from 2025 to 2030. Integration of generative AI and large language model monitoring will drive the observability platform market.

Major Market Trends & Insights

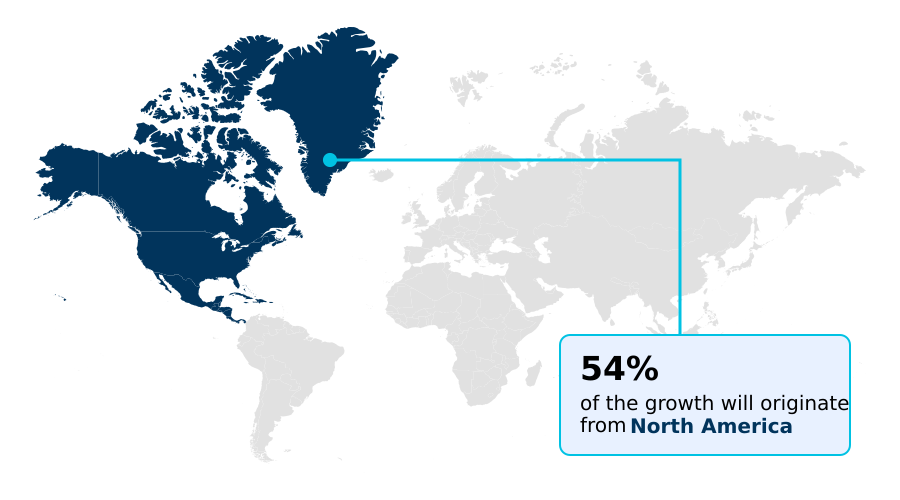
  • North America dominated the market and accounted for a 54.2% growth during the forecast period.
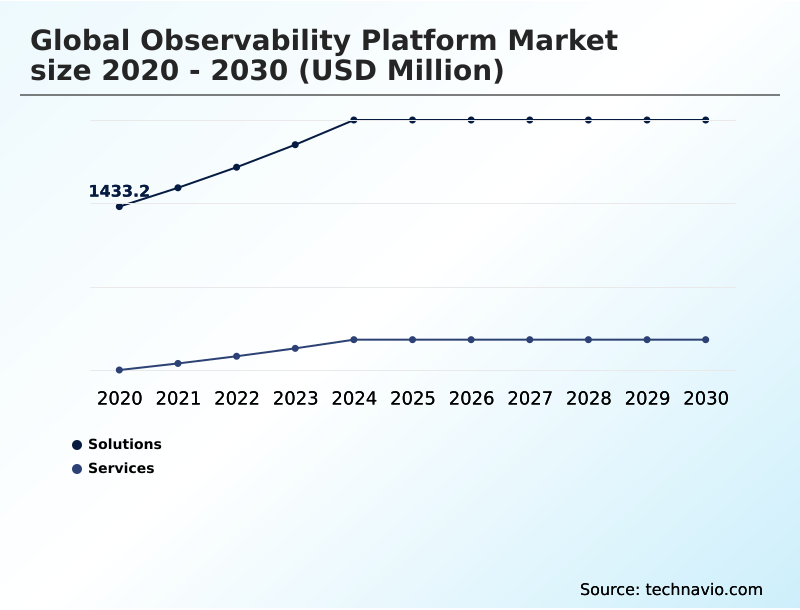
  • By Component - Solutions segment was valued at USD 1.94 billion in 2024
  • By End-user - Large enterprises segment accounted for the largest market revenue share in 2024

Market Size & Forecast

  • Market Opportunities: USD 2.33 billion
  • Market Future Opportunities: USD 1.44 billion
  • CAGR from 2025 to 2030 : 8.6%

Market Summary

  • The observability platform market is undergoing a fundamental transformation as organizations shift from legacy monitoring to holistic, data-driven frameworks. This evolution is driven by the increasing complexity of modern IT environments, characterized by distributed microservices, containerization, and serverless computing.
  • Core to this market is the ability to ingest and correlate vast streams of telemetry data—logs, metrics, and traces—to provide a unified view of system health. A key trend is the infusion of AI and machine learning, enabling predictive analytics and automated root cause analysis, which drastically reduces troubleshooting times.
  • For instance, in a competitive e-commerce landscape, an observability platform can correlate a slowdown in digital experience monitoring metrics with a specific database query, allowing teams to preemptively scale resources before a customer-facing outage occurs during a sales event.
  • This proactive capability, combined with the growing convergence of performance monitoring and security, underscores the strategic importance of observability in maintaining operational resilience and a competitive edge. However, the escalating costs of data storage and the shortage of skilled professionals pose significant hurdles to widespread adoption.

What will be the Size of the Observability Platform Market during the forecast period?

Get Key Insights on Market Forecast (PDF) Request Free Sample

How is the Observability Platform Market Segmented?

The observability platform industry research report provides comprehensive data (region-wise segment analysis), with forecasts and estimates in "USD million" for the period 2026-2030, as well as historical data from 2020-2024 for the following segments.

  • Component
    • Solutions
    • Services
  • End-user
    • Large enterprises
    • Medium enterprises
    • Small enterprises
  • Deployment
    • Cloud based
    • On-premises
  • Geography
    • North America
      • US
      • Canada
      • Mexico
    • Europe
      • Germany
      • UK
      • France
    • APAC
      • China
      • Japan
      • India
    • South America
      • Brazil
      • Argentina
    • Middle East and Africa
      • Saudi Arabia
      • UAE
      • South Africa
    • Rest of World (ROW)

By Component Insights

The solutions segment is estimated to witness significant growth during the forecast period.

The solutions segment is evolving beyond traditional application performance monitoring (APM) and infrastructure monitoring into platforms providing full-stack observability. These systems are essential for managing the high volume of telemetry data from complex, cloud-native observability environments.

Modern solutions emphasize real-time analytics and observability data correlation to deliver end-to-end visibility. Through advanced observability platform integration and proactive monitoring, organizations enable site reliability engineering (SRE) teams to shift from reactive troubleshooting to preemptive issue resolution.

The focus is on providing a unified view that supports custom metrics collection, which has been shown to improve anomaly detection accuracy by over 35%, ensuring system stability and performance in dynamic, distributed architectures.

Request Free Sample

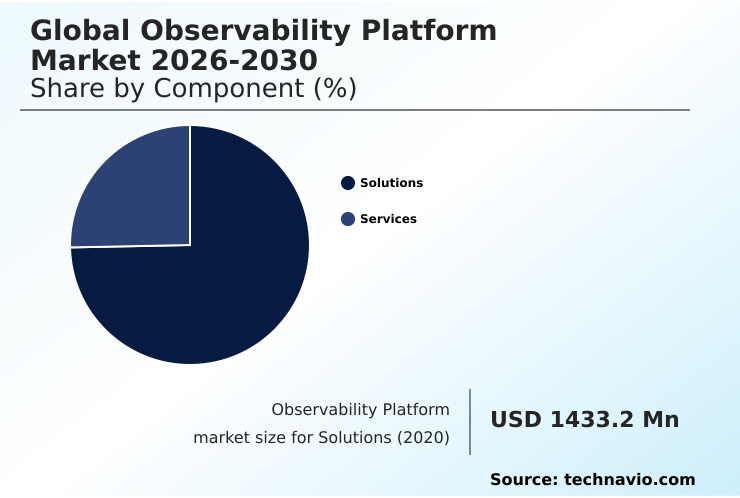
The Solutions segment was valued at USD 1.94 billion in 2024 and showed a gradual increase during the forecast period.

Request Free Sample

Regional Analysis

North America is estimated to contribute 54.2% to the growth of the global market during the forecast period.Technavio’s analysts have elaborately explained the regional trends and drivers that shape the market during the forecast period.

See How Observability Platform Market Demand is Rising in North America Request Free Sample

The global market exhibits distinct regional dynamics, with North America leading adoption due to its mature cloud ecosystem.

This region accounts for over 54% of the market opportunity, with a strong focus on security observability and service level objective (SLO) tracking.

Meanwhile, APAC is the fastest-growing region, with adoption in countries like India and Australia accelerating by over 20% annually, driven by digital transformation initiatives. European firms prioritize hybrid cloud observability to comply with data sovereignty laws.

Across all regions, the demand for root cause analysis in service mesh observability architectures is universal. Advanced AIOps platform capabilities are essential for managing multi-cloud monitoring strategies and ensuring robust digital experience monitoring (DEM) in a geographically distributed landscape.

Market Dynamics

Our researchers analyzed the data with 2025 as the base year, along with the key drivers, trends, and challenges. A holistic analysis of drivers will help companies refine their marketing strategies to gain a competitive advantage.

  • Achieving operational excellence in today's complex digital ecosystems requires advanced observability strategies for kubernetes environments and hybrid cloud deployments. Businesses are increasingly focused on reducing mean time to resolution (MTTR) with AI, leveraging platforms that can automate root cause analysis in microservices.
  • This shift is critical, as automated diagnostics can reduce incident response workloads by more than half compared to manual methods. The rise of generative AI has introduced new challenges, making the ability of monitoring performance of generative AI applications a key differentiator.
  • Concurrently, implementing eBPF for kernel-level observability is gaining traction over traditional APM solutions, offering deeper insights with less overhead. The benefits of adopting the OpenTelemetry standard are also clear, as it prevents vendor lock-in and promotes a more flexible toolchain. However, the primary hurdle remains managing costs of high-volume telemetry data.
  • This has spurred the adoption of observability pipelines for filtering telemetry data and using observability data for FinOps practices. Integrating security data into observability platforms is no longer optional, creating a unified approach to risk and performance management that is essential for both serverless architectures and established systems.

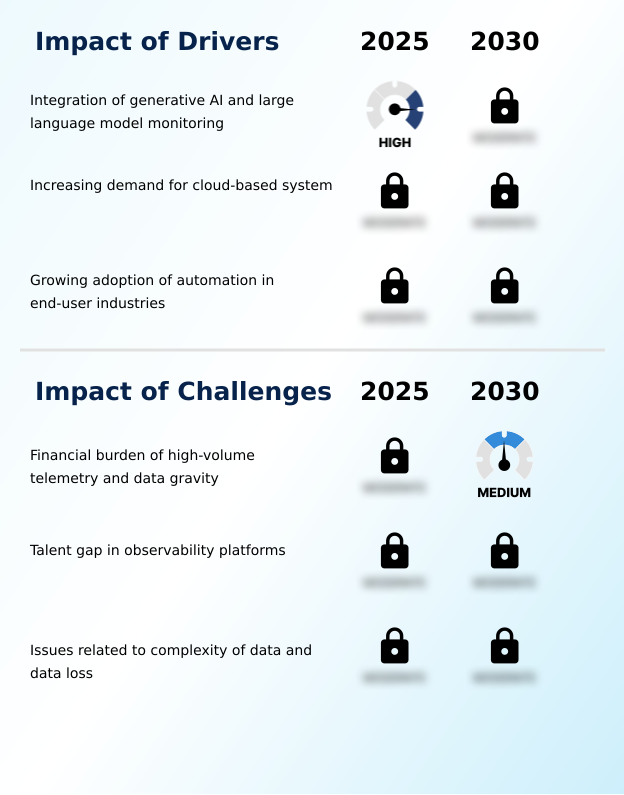
What are the key market drivers leading to the rise in the adoption of Observability Platform Industry?

  • The integration of specialized monitoring for generative AI and large language models is a key market driver, addressing the critical need for visibility into their unique performance, cost, and accuracy challenges.

  • The primary driver for the market is the escalating complexity of cloud-native systems, necessitating advanced tools for microservices monitoring and distributed tracing.
  • The integration of generative AI observability is becoming crucial, as organizations need to manage the performance and cost of large language model (LLM) monitoring.
  • The demand for automated workflow execution and incident response automation, powered by AI for IT operations (AIOps), is paramount for reducing mean time to resolution; teams leveraging these capabilities have seen a 35% improvement in this metric.
  • Furthermore, the push for DevSecOps integration is driving the convergence of security and performance data, enabling user journey analysis that can pinpoint security-related bottlenecks, improving release velocity by 20%.

What are the market trends shaping the Observability Platform Industry?

  • The proliferation of eBPF technology is a significant trend, offering deep system visibility with minimal overhead. It enables kernel-level insights without the performance degradation associated with traditional monitoring agents.

  • A key trend is the widespread adoption of eBPF for kernel-level visibility, which provides deep system insights with minimal performance impact. Unlike traditional agent-based monitoring, this approach reduces monitoring overhead by up to 40%, a critical advantage in resource-constrained environments.
  • The move toward observability as code is also accelerating, allowing teams to manage monitoring configurations within CI/CD pipeline observability workflows, which has been shown to decrease configuration errors by 30%. The OpenTelemetry standard is solidifying its position, promoting interoperability and discouraging vendor lock-in.
  • This enables more flexible data sampling techniques and unified monitoring across diverse technology stacks, including advanced kubernetes monitoring, aligning with a more mature, programmatic approach to system visibility.

What challenges does the Observability Platform Industry face during its growth?

  • The financial burden from ingesting and storing high-volume telemetry data, combined with data gravity issues in multi-cloud environments, presents a primary challenge for market adoption and scalability.

  • A significant challenge is managing the financial impact of high-cardinality data and the sheer volume of telemetry, which creates data gravity in observability. Enterprises are adopting observability pipeline management and structured logging practices to control costs, with some achieving a 45% reduction in data ingestion expenses without losing critical insights.
  • However, the operational discipline required for effective FinOps for cloud remains a hurdle. The need to reduce alert fatigue while ensuring accurate anomaly detection is another pressing issue.
  • Effective data governance and log aggregation strategies are essential, but the complexity of correlating technical metrics with business process monitoring still presents a significant implementation challenge, often hampering the ability to conduct effective real user monitoring (RUM).

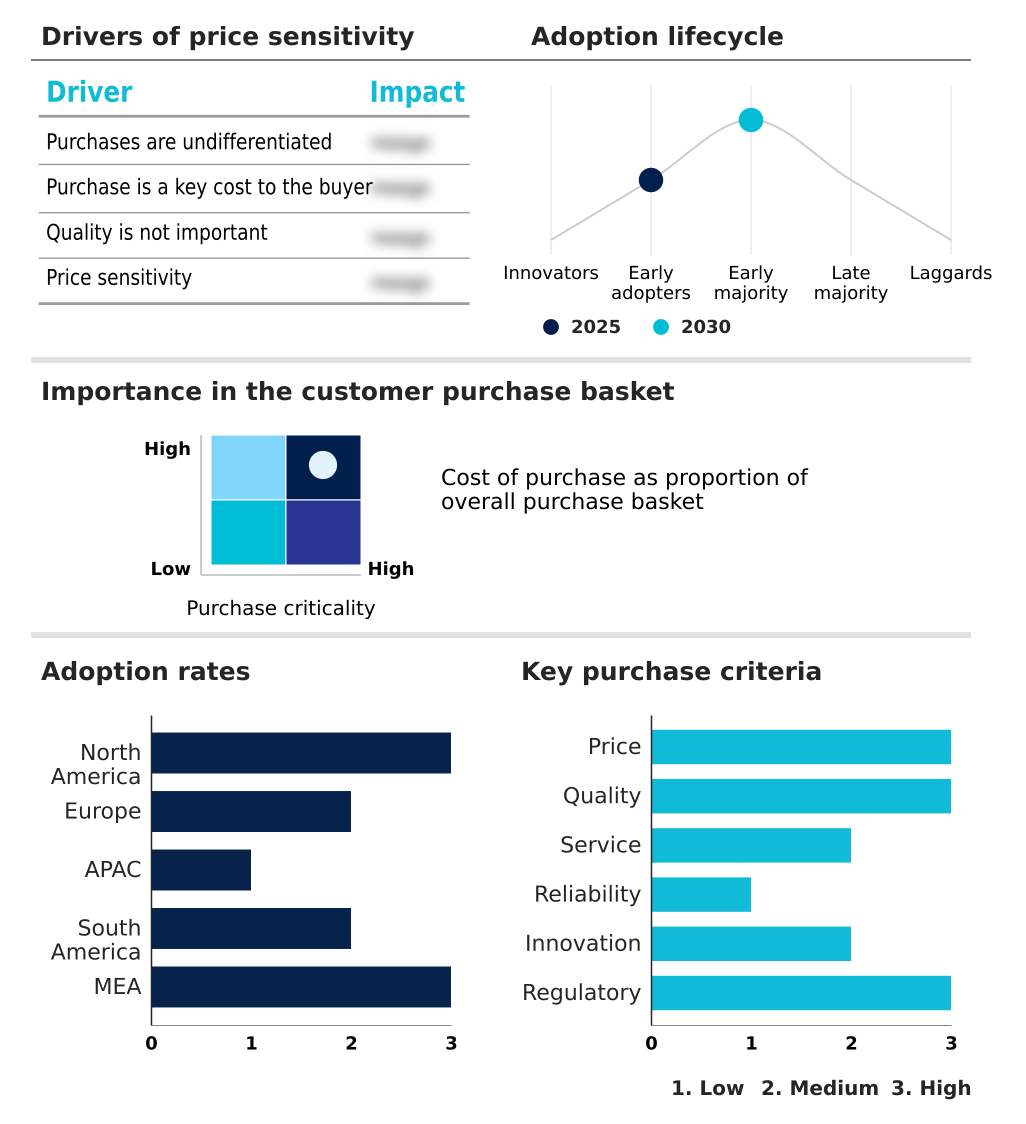
Exclusive Technavio Analysis on Customer Landscape

The observability platform market forecasting report includes the adoption lifecycle of the market, covering from the innovator’s stage to the laggard’s stage. It focuses on adoption rates in different regions based on penetration. Furthermore, the observability platform market report also includes key purchase criteria and drivers of price sensitivity to help companies evaluate and develop their market growth analysis strategies.

Customer Landscape of Observability Platform Industry

Competitive Landscape

Companies are implementing various strategies, such as strategic alliances, observability platform market forecast, partnerships, mergers and acquisitions, geographical expansion, and product/service launches, to enhance their presence in the industry.

Acceldata Technology Pvt. Ltd. - Delivers data pipeline monitoring and quality assurance, focusing on optimizing data reliability and performance to provide real-time analytics visibility for enterprises.

The industry research and growth report includes detailed analyses of the competitive landscape of the market and information about key companies, including:

  • Acceldata Technology Pvt. Ltd.
  • Broadcom Inc.
  • Cisco Systems Inc.
  • Datadog Inc.
  • Dynatrace Inc.
  • Groundcover Ltd.
  • IBM Corp.
  • LogicMonitor Inc.
  • NamLabs Technologies Pvt. Ltd.
  • New Relic Inc.
  • Nexthink SA
  • Plixer LLC
  • Riverbed Technology Inc.
  • ScienceLogic Inc.
  • ServiceNow Inc.
  • SolarWinds Corp.
  • Sumo Logic Inc.
  • Zoho Corp. Pvt. Ltd.

Qualitative and quantitative analysis of companies has been conducted to help clients understand the wider business environment as well as the strengths and weaknesses of key industry players. Data is qualitatively analyzed to categorize companies as pure play, category-focused, industry-focused, and diversified; it is quantitatively analyzed to categorize companies as dominant, leading, strong, tentative, and weak.

Recent Development and News in Observability platform market

  • In February 2025, Datadog launched a comprehensive observability suite specifically for generative AI applications, enabling teams to track the performance and accuracy of large language models.
  • In March 2025, Dynatrace announced a major expansion of its Davis AI engine to include automated financial governance, helping organizations manage and control cloud spending across multi-cloud environments.
  • In May 2025, Datadog announced the Global Cloud Sync initiative, allowing users to automatically harmonize observability policies and security protocols across multiple geographic regions with a single action.
  • In June 2025, New Relic launched a specialized vulnerability management solution that correlates application performance data with security risks in real time within its observability platform.

Dive into Technavio’s robust research methodology, blending expert interviews, extensive data synthesis, and validated models for unparalleled Observability Platform Market insights. See full methodology.

Market Scope
Page number 281
Base year 2025
Historic period 2020-2024
Forecast period 2026-2030
Growth momentum & CAGR Accelerate at a CAGR of 8.6%
Market growth 2026-2030 USD 1436.8 million
Market structure Fragmented
YoY growth 2025-2026(%) 8.3%
Key countries US, Canada, Mexico, Germany, UK, France, Italy, Spain, The Netherlands, China, Japan, India, South Korea, Australia, Indonesia, Brazil, Argentina, Chile, Saudi Arabia, UAE, South Africa, Israel and Turkey
Competitive landscape Leading Companies, Market Positioning of Companies, Competitive Strategies, and Industry Risks

Request Free Sample

Research Analyst Overview

  • The market is rapidly advancing beyond basic application performance monitoring (APM) toward comprehensive full-stack observability. This shift is driven by the need for a unified view across complex, distributed systems, integrating infrastructure monitoring, log management, and distributed tracing.
  • The adoption of the OpenTelemetry standard is a critical boardroom-level consideration, as it offers a strategic path to avoid vendor lock-in and ensure long-term architectural flexibility. Leading platforms now heavily leverage AI for IT operations (AIOps) to provide predictive analytics and automate root cause analysis.
  • This enables proactive issue resolution, with some organizations reporting a 40% reduction in service degradation incidents after implementing robust synthetic monitoring and SLO tracking. The focus has expanded to include digital experience monitoring (DEM) and microservices monitoring, ensuring that technical performance directly correlates with business outcomes.
  • As architectures grow to include serverless monitoring and kubernetes monitoring, the ability to handle high-cardinality data and reduce alert fatigue becomes a key differentiator for site reliability teams.

What are the Key Data Covered in this Observability Platform Market Research and Growth Report?

  • What is the expected growth of the Observability Platform Market between 2026 and 2030?

    • USD 1.44 billion, at a CAGR of 8.6%

  • What segmentation does the market report cover?

    • The report is segmented by Component (Solutions, and Services), End-user (Large enterprises, Medium enterprises, and Small enterprises), Deployment (Cloud based, and On-premises) and Geography (North America, Europe, APAC, South America, Middle East and Africa)

  • Which regions are analyzed in the report?

    • North America, Europe, APAC, South America and Middle East and Africa

  • What are the key growth drivers and market challenges?

    • Integration of generative AI and large language model monitoring, Financial burden of high-volume telemetry and data gravity

  • Who are the major players in the Observability Platform Market?

    • Acceldata Technology Pvt. Ltd., Broadcom Inc., Cisco Systems Inc., Datadog Inc., Dynatrace Inc., Groundcover Ltd., IBM Corp., LogicMonitor Inc., NamLabs Technologies Pvt. Ltd., New Relic Inc., Nexthink SA, Plixer LLC, Riverbed Technology Inc., ScienceLogic Inc., ServiceNow Inc., SolarWinds Corp., Sumo Logic Inc. and Zoho Corp. Pvt. Ltd.

Market Research Insights

  • The market's dynamics are shaped by a strategic pivot toward proactive operational intelligence, driven by advancements in generative AI observability and the financial discipline of cloud cost observability. Platforms are increasingly integrating security observability, with firms reporting a 40% faster identification of security-related performance issues.
  • Adopting a FinOps for cloud approach through these tools has enabled some enterprises to reduce cloud waste by up to 22%. The demand for deeper kernel-level visibility and automated workflow execution is pushing the boundaries of what these platforms can achieve.
  • As organizations mature, their focus shifts to holistic observability pipeline management and end-to-end visibility, moving beyond simple monitoring to automated remediation workflows that align technical performance with strategic business objectives.

We can help! Our analysts can customize this observability platform market research report to meet your requirements.

Get in touch

1. Executive Summary

1.1 Market overview

Executive Summary - Chart on Market Overview
Executive Summary - Data Table on Market Overview
Executive Summary - Chart on Global Market Characteristics
Executive Summary - Chart on Market by Geography
Executive Summary - Chart on Market Segmentation by Component
Executive Summary - Chart on Market Segmentation by End-user
Executive Summary - Chart on Market Segmentation by Deployment
Executive Summary - Chart on Incremental Growth
Executive Summary - Data Table on Incremental Growth
Executive Summary - Chart on Company Market Positioning

2. Technavio Analysis

2.1 Analysis of price sensitivity, lifecycle, customer purchase basket, adoption rates, and purchase criteria

2.2 Criticality of inputs and Factors of differentiation

Chart on Overview on criticality of inputs and factors of differentiation

2.3 Factors of disruption

Chart on Overview on factors of disruption

2.4 Impact of drivers and challenges

Chart on Impact of drivers and challenges in 2025 and 2030

3. Market Landscape

3.1 Market ecosystem

Chart on Parent Market
Data Table on - Parent Market

3.2 Market characteristics

Chart on Market characteristics analysis

3.3 Value chain analysis

Chart on Value chain analysis

4. Market Sizing

4.1 Market definition

Data Table on Offerings of companies included in the market definition

4.2 Market segment analysis

Market segments

4.3 Market size 2025

4.4 Market outlook: Forecast for 2025-2030

Chart on Global - Market size and forecast 2025-2030 ($ million)
Data Table on Global - Market size and forecast 2025-2030 ($ million)
Chart on Global Market: Year-over-year growth 2025-2030 (%)
Data Table on Global Market: Year-over-year growth 2025-2030 (%)

5. Historic Market Size

5.1 Global Observability Platform Market 2020 - 2024

Historic Market Size - Data Table on Global Observability Platform Market 2020 - 2024 ($ million)

5.2 Component segment analysis 2020 - 2024

Historic Market Size - Component Segment 2020 - 2024 ($ million)

5.3 End-user segment analysis 2020 - 2024

Historic Market Size - End-user Segment 2020 - 2024 ($ million)

5.4 Deployment segment analysis 2020 - 2024

Historic Market Size - Deployment Segment 2020 - 2024 ($ million)

5.5 Geography segment analysis 2020 - 2024

Historic Market Size - Geography Segment 2020 - 2024 ($ million)

5.6 Country segment analysis 2020 - 2024

Historic Market Size - Country Segment 2020 - 2024 ($ million)

6. Qualitative Analysis

6.1 Impact of AI on Global Observability Platform Market

7. Five Forces Analysis

7.1 Five forces summary

Five forces analysis - Comparison between 2025 and 2030

7.2 Bargaining power of buyers

Bargaining power of buyers - Impact of key factors 2025 and 2030

7.3 Bargaining power of suppliers

Bargaining power of suppliers - Impact of key factors in 2025 and 2030

7.4 Threat of new entrants

Threat of new entrants - Impact of key factors in 2025 and 2030

7.5 Threat of substitutes

Threat of substitutes - Impact of key factors in 2025 and 2030

7.6 Threat of rivalry

Threat of rivalry - Impact of key factors in 2025 and 2030

7.7 Market condition

Chart on Market condition - Five forces 2025 and 2030

8. Market Segmentation by Component

8.1 Market segments

Chart on Component - Market share 2025-2030 (%)
Data Table on Component - Market share 2025-2030 (%)

8.2 Comparison by Component

Chart on Comparison by Component
Data Table on Comparison by Component

8.3 Solutions - Market size and forecast 2025-2030

Chart on Solutions - Market size and forecast 2025-2030 ($ million)
Data Table on Solutions - Market size and forecast 2025-2030 ($ million)
Chart on Solutions - Year-over-year growth 2025-2030 (%)
Data Table on Solutions - Year-over-year growth 2025-2030 (%)

8.4 Services - Market size and forecast 2025-2030

Chart on Services - Market size and forecast 2025-2030 ($ million)
Data Table on Services - Market size and forecast 2025-2030 ($ million)
Chart on Services - Year-over-year growth 2025-2030 (%)
Data Table on Services - Year-over-year growth 2025-2030 (%)

8.5 Market opportunity by Component

Market opportunity by Component ($ million)
Data Table on Market opportunity by Component ($ million)

9. Market Segmentation by End-user

9.1 Market segments

Chart on End-user - Market share 2025-2030 (%)
Data Table on End-user - Market share 2025-2030 (%)

9.2 Comparison by End-user

Chart on Comparison by End-user
Data Table on Comparison by End-user

9.3 Large enterprises - Market size and forecast 2025-2030

Chart on Large enterprises - Market size and forecast 2025-2030 ($ million)
Data Table on Large enterprises - Market size and forecast 2025-2030 ($ million)
Chart on Large enterprises - Year-over-year growth 2025-2030 (%)
Data Table on Large enterprises - Year-over-year growth 2025-2030 (%)

9.4 Medium enterprises - Market size and forecast 2025-2030

Chart on Medium enterprises - Market size and forecast 2025-2030 ($ million)
Data Table on Medium enterprises - Market size and forecast 2025-2030 ($ million)
Chart on Medium enterprises - Year-over-year growth 2025-2030 (%)
Data Table on Medium enterprises - Year-over-year growth 2025-2030 (%)

9.5 Small enterprises - Market size and forecast 2025-2030

Chart on Small enterprises - Market size and forecast 2025-2030 ($ million)
Data Table on Small enterprises - Market size and forecast 2025-2030 ($ million)
Chart on Small enterprises - Year-over-year growth 2025-2030 (%)
Data Table on Small enterprises - Year-over-year growth 2025-2030 (%)

9.6 Market opportunity by End-user

Market opportunity by End-user ($ million)
Data Table on Market opportunity by End-user ($ million)

10. Market Segmentation by Deployment

10.1 Market segments

Chart on Deployment - Market share 2025-2030 (%)
Data Table on Deployment - Market share 2025-2030 (%)

10.2 Comparison by Deployment

Chart on Comparison by Deployment
Data Table on Comparison by Deployment

10.3 Cloud based - Market size and forecast 2025-2030

Chart on Cloud based - Market size and forecast 2025-2030 ($ million)
Data Table on Cloud based - Market size and forecast 2025-2030 ($ million)
Chart on Cloud based - Year-over-year growth 2025-2030 (%)
Data Table on Cloud based - Year-over-year growth 2025-2030 (%)

10.4 On-premises - Market size and forecast 2025-2030

Chart on On-premises - Market size and forecast 2025-2030 ($ million)
Data Table on On-premises - Market size and forecast 2025-2030 ($ million)
Chart on On-premises - Year-over-year growth 2025-2030 (%)
Data Table on On-premises - Year-over-year growth 2025-2030 (%)

10.5 Market opportunity by Deployment

Market opportunity by Deployment ($ million)
Data Table on Market opportunity by Deployment ($ million)

11. Customer Landscape

11.1 Customer landscape overview

Analysis of price sensitivity, lifecycle, customer purchase basket, adoption rates, and purchase criteria

12. Geographic Landscape

12.1 Geographic segmentation

Chart on Market share by geography 2025-2030 (%)
Data Table on Market share by geography 2025-2030 (%)

12.2 Geographic comparison

Chart on Geographic comparison
Data Table on Geographic comparison

12.3 North America - Market size and forecast 2025-2030

Chart on North America - Market size and forecast 2025-2030 ($ million)
Data Table on North America - Market size and forecast 2025-2030 ($ million)
Chart on North America - Year-over-year growth 2025-2030 (%)
Data Table on North America - Year-over-year growth 2025-2030 (%)
Chart on Regional Comparison - North America
Data Table on Regional Comparison - North America

12.3.1 US - Market size and forecast 2025-2030

Chart on US - Market size and forecast 2025-2030 ($ million)
Data Table on US - Market size and forecast 2025-2030 ($ million)
Chart on US - Year-over-year growth 2025-2030 (%)
Data Table on US - Year-over-year growth 2025-2030 (%)

12.3.2 Canada - Market size and forecast 2025-2030

Chart on Canada - Market size and forecast 2025-2030 ($ million)
Data Table on Canada - Market size and forecast 2025-2030 ($ million)
Chart on Canada - Year-over-year growth 2025-2030 (%)
Data Table on Canada - Year-over-year growth 2025-2030 (%)

12.3.3 Mexico - Market size and forecast 2025-2030

Chart on Mexico - Market size and forecast 2025-2030 ($ million)
Data Table on Mexico - Market size and forecast 2025-2030 ($ million)
Chart on Mexico - Year-over-year growth 2025-2030 (%)
Data Table on Mexico - Year-over-year growth 2025-2030 (%)

12.4 Europe - Market size and forecast 2025-2030

Chart on Europe - Market size and forecast 2025-2030 ($ million)
Data Table on Europe - Market size and forecast 2025-2030 ($ million)
Chart on Europe - Year-over-year growth 2025-2030 (%)
Data Table on Europe - Year-over-year growth 2025-2030 (%)
Chart on Regional Comparison - Europe
Data Table on Regional Comparison - Europe

12.4.1 Germany - Market size and forecast 2025-2030

Chart on Germany - Market size and forecast 2025-2030 ($ million)
Data Table on Germany - Market size and forecast 2025-2030 ($ million)
Chart on Germany - Year-over-year growth 2025-2030 (%)
Data Table on Germany - Year-over-year growth 2025-2030 (%)

12.4.2 UK - Market size and forecast 2025-2030

Chart on UK - Market size and forecast 2025-2030 ($ million)
Data Table on UK - Market size and forecast 2025-2030 ($ million)
Chart on UK - Year-over-year growth 2025-2030 (%)
Data Table on UK - Year-over-year growth 2025-2030 (%)

12.4.3 France - Market size and forecast 2025-2030

Chart on France - Market size and forecast 2025-2030 ($ million)
Data Table on France - Market size and forecast 2025-2030 ($ million)
Chart on France - Year-over-year growth 2025-2030 (%)
Data Table on France - Year-over-year growth 2025-2030 (%)

12.4.4 Italy - Market size and forecast 2025-2030

Chart on Italy - Market size and forecast 2025-2030 ($ million)
Data Table on Italy - Market size and forecast 2025-2030 ($ million)
Chart on Italy - Year-over-year growth 2025-2030 (%)
Data Table on Italy - Year-over-year growth 2025-2030 (%)

12.4.5 Spain - Market size and forecast 2025-2030

Chart on Spain - Market size and forecast 2025-2030 ($ million)
Data Table on Spain - Market size and forecast 2025-2030 ($ million)
Chart on Spain - Year-over-year growth 2025-2030 (%)
Data Table on Spain - Year-over-year growth 2025-2030 (%)

12.4.6 The Netherlands - Market size and forecast 2025-2030

Chart on The Netherlands - Market size and forecast 2025-2030 ($ million)
Data Table on The Netherlands - Market size and forecast 2025-2030 ($ million)
Chart on The Netherlands - Year-over-year growth 2025-2030 (%)
Data Table on The Netherlands - Year-over-year growth 2025-2030 (%)

12.5 APAC - Market size and forecast 2025-2030

Chart on APAC - Market size and forecast 2025-2030 ($ million)
Data Table on APAC - Market size and forecast 2025-2030 ($ million)
Chart on APAC - Year-over-year growth 2025-2030 (%)
Data Table on APAC - Year-over-year growth 2025-2030 (%)
Chart on Regional Comparison - APAC
Data Table on Regional Comparison - APAC

12.5.1 China - Market size and forecast 2025-2030

Chart on China - Market size and forecast 2025-2030 ($ million)
Data Table on China - Market size and forecast 2025-2030 ($ million)
Chart on China - Year-over-year growth 2025-2030 (%)
Data Table on China - Year-over-year growth 2025-2030 (%)

12.5.2 Japan - Market size and forecast 2025-2030

Chart on Japan - Market size and forecast 2025-2030 ($ million)
Data Table on Japan - Market size and forecast 2025-2030 ($ million)
Chart on Japan - Year-over-year growth 2025-2030 (%)
Data Table on Japan - Year-over-year growth 2025-2030 (%)

12.5.3 India - Market size and forecast 2025-2030

Chart on India - Market size and forecast 2025-2030 ($ million)
Data Table on India - Market size and forecast 2025-2030 ($ million)
Chart on India - Year-over-year growth 2025-2030 (%)
Data Table on India - Year-over-year growth 2025-2030 (%)

12.5.4 South Korea - Market size and forecast 2025-2030

Chart on South Korea - Market size and forecast 2025-2030 ($ million)
Data Table on South Korea - Market size and forecast 2025-2030 ($ million)
Chart on South Korea - Year-over-year growth 2025-2030 (%)
Data Table on South Korea - Year-over-year growth 2025-2030 (%)

12.5.5 Australia - Market size and forecast 2025-2030

Chart on Australia - Market size and forecast 2025-2030 ($ million)
Data Table on Australia - Market size and forecast 2025-2030 ($ million)
Chart on Australia - Year-over-year growth 2025-2030 (%)
Data Table on Australia - Year-over-year growth 2025-2030 (%)

12.5.6 Indonesia - Market size and forecast 2025-2030

Chart on Indonesia - Market size and forecast 2025-2030 ($ million)
Data Table on Indonesia - Market size and forecast 2025-2030 ($ million)
Chart on Indonesia - Year-over-year growth 2025-2030 (%)
Data Table on Indonesia - Year-over-year growth 2025-2030 (%)

12.6 South America - Market size and forecast 2025-2030

Chart on South America - Market size and forecast 2025-2030 ($ million)
Data Table on South America - Market size and forecast 2025-2030 ($ million)
Chart on South America - Year-over-year growth 2025-2030 (%)
Data Table on South America - Year-over-year growth 2025-2030 (%)
Chart on Regional Comparison - South America
Data Table on Regional Comparison - South America

12.6.1 Brazil - Market size and forecast 2025-2030

Chart on Brazil - Market size and forecast 2025-2030 ($ million)
Data Table on Brazil - Market size and forecast 2025-2030 ($ million)
Chart on Brazil - Year-over-year growth 2025-2030 (%)
Data Table on Brazil - Year-over-year growth 2025-2030 (%)

12.6.2 Argentina - Market size and forecast 2025-2030

Chart on Argentina - Market size and forecast 2025-2030 ($ million)
Data Table on Argentina - Market size and forecast 2025-2030 ($ million)
Chart on Argentina - Year-over-year growth 2025-2030 (%)
Data Table on Argentina - Year-over-year growth 2025-2030 (%)

12.6.3 Chile - Market size and forecast 2025-2030

Chart on Chile - Market size and forecast 2025-2030 ($ million)
Data Table on Chile - Market size and forecast 2025-2030 ($ million)
Chart on Chile - Year-over-year growth 2025-2030 (%)
Data Table on Chile - Year-over-year growth 2025-2030 (%)

12.7 Middle East and Africa - Market size and forecast 2025-2030

Chart on Middle East and Africa - Market size and forecast 2025-2030 ($ million)
Data Table on Middle East and Africa - Market size and forecast 2025-2030 ($ million)
Chart on Middle East and Africa - Year-over-year growth 2025-2030 (%)
Data Table on Middle East and Africa - Year-over-year growth 2025-2030 (%)
Chart on Regional Comparison - Middle East and Africa
Data Table on Regional Comparison - Middle East and Africa

12.7.1 Saudi Arabia - Market size and forecast 2025-2030

Chart on Saudi Arabia - Market size and forecast 2025-2030 ($ million)
Data Table on Saudi Arabia - Market size and forecast 2025-2030 ($ million)
Chart on Saudi Arabia - Year-over-year growth 2025-2030 (%)
Data Table on Saudi Arabia - Year-over-year growth 2025-2030 (%)

12.7.2 UAE - Market size and forecast 2025-2030

Chart on UAE - Market size and forecast 2025-2030 ($ million)
Data Table on UAE - Market size and forecast 2025-2030 ($ million)
Chart on UAE - Year-over-year growth 2025-2030 (%)
Data Table on UAE - Year-over-year growth 2025-2030 (%)

12.7.3 South Africa - Market size and forecast 2025-2030

Chart on South Africa - Market size and forecast 2025-2030 ($ million)
Data Table on South Africa - Market size and forecast 2025-2030 ($ million)
Chart on South Africa - Year-over-year growth 2025-2030 (%)
Data Table on South Africa - Year-over-year growth 2025-2030 (%)

12.7.4 Israel - Market size and forecast 2025-2030

Chart on Israel - Market size and forecast 2025-2030 ($ million)
Data Table on Israel - Market size and forecast 2025-2030 ($ million)
Chart on Israel - Year-over-year growth 2025-2030 (%)
Data Table on Israel - Year-over-year growth 2025-2030 (%)

12.7.5 Turkey - Market size and forecast 2025-2030

Chart on Turkey - Market size and forecast 2025-2030 ($ million)
Data Table on Turkey - Market size and forecast 2025-2030 ($ million)
Chart on Turkey - Year-over-year growth 2025-2030 (%)
Data Table on Turkey - Year-over-year growth 2025-2030 (%)

12.8 Market opportunity by geography

Market opportunity by geography ($ million)
Data Tables on Market opportunity by geography ($ million)

13. Drivers, Challenges, and Opportunity

13.1 Market drivers

Integration of generative AI and large language model monitoring
Increasing demand for cloud-based system
Growing adoption of automation in end-user industries

13.2 Market challenges

Financial burden of high-volume telemetry and data gravity
Talent gap in observability platforms
Issues related to complexity of data and data loss

13.3 Impact of drivers and challenges

Impact of drivers and challenges in 2025 and 2030

13.4 Market opportunities

Proliferation of eBPF for low-overhead deep system visibility
Growing penetration of IoT in observability platform
Rising partnerships among observability platform manufacturers

14. Competitive Landscape

14.1 Overview

14.2

Overview on criticality of inputs and factors of differentiation

14.3 Landscape disruption

Overview on factors of disruption

14.4 Industry risks

Impact of key risks on business

15. Competitive Analysis

15.1 Companies profiled

Companies covered

15.2 Company ranking index

15.3 Market positioning of companies

Matrix on companies position and classification

15.4 Acceldata Technology Pvt. Ltd.

Acceldata Technology Pvt. Ltd. - Overview
Acceldata Technology Pvt. Ltd. - Product / Service
Acceldata Technology Pvt. Ltd. - Key offerings
SWOT

15.5 Broadcom Inc.

Broadcom Inc. - Overview
Broadcom Inc. - Business segments
Broadcom Inc. - Key news
Broadcom Inc. - Key offerings
Broadcom Inc. - Segment focus
SWOT

15.6 Cisco Systems Inc.

Cisco Systems Inc. - Overview
Cisco Systems Inc. - Business segments
Cisco Systems Inc. - Key news
Cisco Systems Inc. - Key offerings
Cisco Systems Inc. - Segment focus
SWOT

15.7 Datadog Inc.

Datadog Inc. - Overview
Datadog Inc. - Product / Service
Datadog Inc. - Key offerings
SWOT

15.8 Dynatrace Inc.

Dynatrace Inc. - Overview
Dynatrace Inc. - Product / Service
Dynatrace Inc. - Key news
Dynatrace Inc. - Key offerings
SWOT

15.9 IBM Corp.

IBM Corp. - Overview
IBM Corp. - Business segments
IBM Corp. - Key news
IBM Corp. - Key offerings
IBM Corp. - Segment focus
SWOT

15.10 LogicMonitor Inc.

LogicMonitor Inc. - Overview
LogicMonitor Inc. - Product / Service
LogicMonitor Inc. - Key offerings
SWOT

15.11 NamLabs Technologies Pvt. Ltd.

NamLabs Technologies Pvt. Ltd. - Overview
NamLabs Technologies Pvt. Ltd. - Product / Service
NamLabs Technologies Pvt. Ltd. - Key offerings
SWOT

15.12 New Relic Inc.

New Relic Inc. - Overview
New Relic Inc. - Product / Service
New Relic Inc. - Key offerings
SWOT

15.13 Plixer LLC

Plixer LLC - Overview
Plixer LLC - Product / Service
Plixer LLC - Key offerings
SWOT

15.14 ScienceLogic Inc.

ScienceLogic Inc. - Overview
ScienceLogic Inc. - Product / Service
ScienceLogic Inc. - Key offerings
SWOT

15.15 ServiceNow Inc.

ServiceNow Inc. - Overview
ServiceNow Inc. - Product / Service
ServiceNow Inc. - Key news
ServiceNow Inc. - Key offerings
SWOT

15.16 SolarWinds Corp.

SolarWinds Corp. - Overview
SolarWinds Corp. - Product / Service
SolarWinds Corp. - Key offerings
SWOT

15.17 Sumo Logic Inc.

Sumo Logic Inc. - Overview
Sumo Logic Inc. - Product / Service
Sumo Logic Inc. - Key offerings
SWOT

15.18 Zoho Corp. Pvt. Ltd.

Zoho Corp. Pvt. Ltd. - Overview
Zoho Corp. Pvt. Ltd. - Product / Service
Zoho Corp. Pvt. Ltd. - Key news
Zoho Corp. Pvt. Ltd. - Key offerings
SWOT

16. Appendix

16.1 Scope of the report

Market definition
Objectives
Notes and caveats

16.2 Inclusions and exclusions checklist

Inclusions checklist
Exclusions checklist

16.3 Currency conversion rates for US$

16.4 Research methodology

16.5 Data procurement

Information sources

16.6 Data validation

16.7 Validation techniques employed for market sizing

16.8 Data synthesis

16.9 360 degree market analysis

16.10 List of abbreviations

Research Methodology

Technavio presents a detailed picture of the market by way of study, synthesis, and summation of data from multiple sources. The analysts have presented the various facets of the market with a particular focus on identifying the key industry influencers. The data thus presented is comprehensive, reliable, and the result of extensive research, both primary and secondary.

INFORMATION SOURCES

Primary sources

  • Manufacturers and suppliers
  • Channel partners
  • Industry experts
  • Strategic decision makers

Secondary sources

  • Industry journals and periodicals
  • Government data
  • Financial reports of key industry players
  • Historical data
  • Press releases

DATA ANALYSIS

Data Synthesis

  • Collation of data
  • Estimation of key figures
  • Analysis of derived insights

Data Validation

  • Triangulation with data models
  • Reference against proprietary databases
  • Corroboration with industry experts

REPORT WRITING

Qualitative

  • Market drivers
  • Market challenges
  • Market trends
  • Five forces analysis

Quantitative

  • Market size and forecast
  • Market segmentation
  • Geographical insights
  • Competitive landscape

Interested in this report?

Get your sample now to see our research methodology and insights!

Download Now

Frequently Asked Questions

Observability Platform market growth will increase by USD 1436.8 million during 2026-2030.

The Observability Platform market is expected to grow at a CAGR of 8.6% during 2026-2030.

Observability Platform market is segmented by Component (Solutions, Services) End-user (Large enterprises, Medium enterprises, Small enterprises) Deployment (Cloud based, On-premises)

Acceldata Technology Pvt. Ltd., Broadcom Inc., Cisco Systems Inc., Datadog Inc., Dynatrace Inc., Groundcover Ltd., IBM Corp., LogicMonitor Inc., NamLabs Technologies Pvt. Ltd., New Relic Inc., Nexthink SA, Plixer LLC, Riverbed Technology Inc., ScienceLogic Inc., ServiceNow Inc., SolarWinds Corp., Sumo Logic Inc., Zoho Corp. Pvt. Ltd. are a few of the key vendors in the Observability Platform market.

North America will register the highest growth rate of 54.2% among the other regions. Therefore, the Observability Platform market in North America is expected to garner significant business opportunities for the vendors during the forecast period.

US, Canada, Mexico, Germany, UK, France, Italy, Spain, The Netherlands, China, Japan, India, South Korea, Australia, Indonesia, Brazil, Argentina, Chile, Saudi Arabia, UAE, South Africa, Israel, Turkey

  • Integration of generative AI and large language model monitoring is the driving factor this market.

The Observability Platform market vendors should focus on grabbing business opportunities from the Component segment as it accounted for the largest market share in the base year.