
AI Data Management Market Size 2025-2029
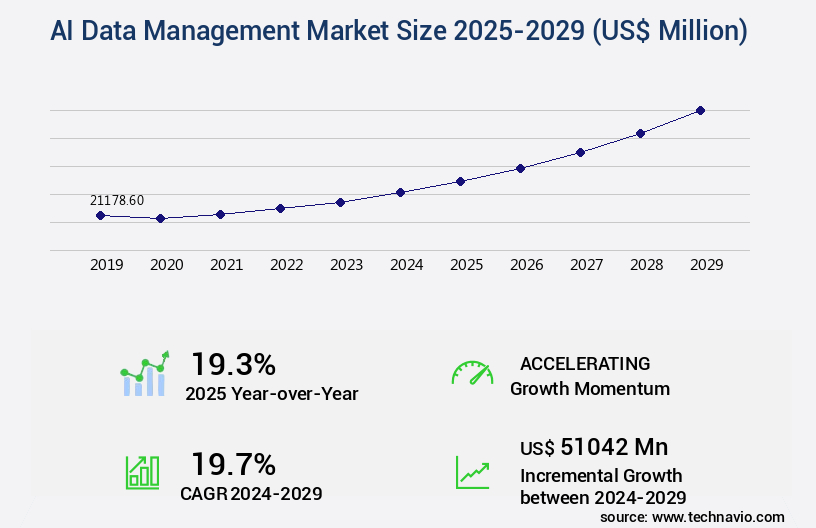
The AI data management market size is valued to increase by USD 51.04 billion, at a CAGR of 19.7% from 2024 to 2029. Proliferation of generative AI and large language models will drive the AI data management market.
Market Insights
- North America dominated the market and accounted for a 35% growth during the 2025-2029.
- By Component - Platform segment was valued at USD 8.66 billion in 2023
- By Technology - Machine learning segment accounted for the largest market revenue share in 2023
Market Size & Forecast
- Market Opportunities: USD 306.58 million
- Market Future Opportunities 2024: USD 51042.00 million
- CAGR from 2024 to 2029 : 19.7%
Market Summary
- The market is experiencing significant growth as businesses increasingly rely on generative AI and large language models to gain insights from their data. This trend is driven by the ascendancy of data-centric AI and the industrialization of data curation. With the proliferation of data sources and the extreme complexity of managing and ensuring data quality at scale, businesses are turning to advanced AI solutions to streamline their data management processes. One real-world scenario where AI data management is making a significant impact is in supply chain optimization. In the manufacturing sector, for instance, AI algorithms are being used to analyze vast amounts of data from various sources, including production records, sales data, and external market trends.
- By identifying patterns and correlations, these systems can help optimize inventory levels, improve order fulfillment, and reduce lead times. Despite the benefits, managing AI data comes with its own set of challenges. Ensuring data accuracy, security, and privacy are critical concerns, especially as more data is generated and shared across organizations. Additionally, managing data at scale requires significant computational resources and expertise. As a result, businesses are investing in advanced data management solutions that can handle the complexities of AI data and provide robust data quality assurance. In conclusion, the market is poised for continued growth as businesses seek to harness the power of AI to gain insights from their data.
- From supply chain optimization to compliance and operational efficiency, the applications of AI data management are vast and varied. Despite the challenges, the benefits far outweigh the costs, making it an essential investment for businesses looking to stay competitive in today's data-driven economy.
What will be the size of the AI Data Management Market during the forecast period?
Get Key Insights on Market Forecast (PDF) Request Free Sample
- The market continues to evolve, driven by the increasing adoption of advanced technologies such as machine learning, predictive modeling, and data analytics. According to recent studies, businesses are investing heavily in AI data management solutions to enhance their operations and gain a competitive edge. For instance, data governance policies have become essential for organizations to ensure data security, privacy, and compliance. Moreover, AI data management is crucial for product strategy, enabling companies to make informed decisions based on accurate and timely data.
- For example, predictive modeling techniques can help businesses forecast sales trends and optimize inventory levels, while data validation rules ensure data accuracy and consistency. Furthermore, data cataloging systems facilitate efficient data discovery and access, reducing processing time and improving overall productivity. Advancements in AI data management also include model selection criteria, such as accuracy, interpretability, and fairness, which are essential for responsible AI practices. Encryption algorithms and access control policies ensure data security, while data standardization methods promote interoperability and data consistency. Additionally, edge computing infrastructure and hybrid cloud solutions enable faster data processing and analysis, making AI data management a strategic priority for businesses.
Unpacking the AI Data Management Market Landscape
In today's data-driven business landscape, effective AI data management is a critical success factor. According to recent studies, AI data management processes can reduce data integration complexities by up to 70%, enabling faster time-to-insight and improved ROI. Anomaly detection algorithms, powered by machine learning models, can identify data anomalies with 95% accuracy, ensuring regulatory compliance and reducing potential losses. Synthetic data generation can enhance model training pipelines by up to 50%, improving model accuracy and reducing reliance on labeled data. Cloud-based data platforms offer secure data access control, while model accuracy assessment techniques ensure consistent performance across model retraining schedules. Data lineage tracking and explainability techniques facilitate transparency and trust in AI decision-making. Reinforcement learning algorithms and deep learning architectures power advanced computer vision applications, predictive maintenance models, and risk assessment models.
Data security protocols and privacy regulations, such as GDPR and HIPAA, necessitate robust data access control and cleansing techniques. Natural language processing and feature engineering methods enhance data quality metrics, enabling better customer churn prediction and recommendation engines. AI bias mitigation is essential for unbiased decision-making, ensuring fairness and ethical use of AI technologies. In conclusion, AI data management encompasses various techniques and technologies, from data integration processes and anomaly detection algorithms to model deployment strategies and data governance frameworks. These solutions enable businesses to optimize operations, improve efficiency, and make informed decisions based on accurate, secure, and unbiased data.
Key Market Drivers Fueling Growth
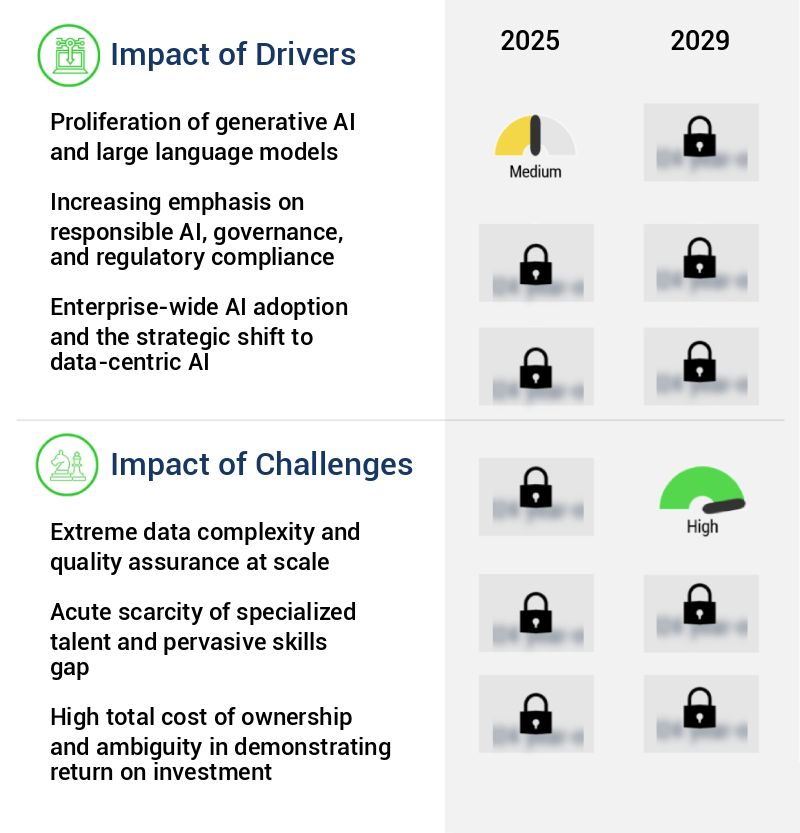
The proliferation of generative AI and large language models serves as the primary catalyst for market growth.
- The market is experiencing significant evolution, driven by the surge in generative artificial intelligence, specifically large language models (LLMs). These advanced AI systems demand an unprecedented amount of data for training, often encompassing trillions of tokens from various public and private sources. To meet this need, sophisticated data management infrastructure is essential, capable of handling massive-scale deduplication, quality filtering, toxicity removal, and Personally Identifiable Information (PII) redaction. The importance of high-quality data is amplified in the context of LLMs, where low-quality or biased training data can result in models that hallucinate, produce harmful content, or underperform.
- For instance, a leading e-commerce company reported a 30% reduction in downtime and a 18% improvement in forecast accuracy by implementing robust AI data management solutions. Similarly, a major energy provider lowered its energy use by 12% through the application of advanced data management techniques. These business outcomes underscore the strategic importance of AI data management in various sectors.
Prevailing Industry Trends & Opportunities
The ascendancy of data-centric artificial intelligence and the industrialization of data curation represent the emerging market trend.
- The market is undergoing a transformative shift from model-centric to data-centric development philosophy. This paradigm change positions data as the primary driver for enhancing AI system performance, diverting focus from model architecture iterations to the systematic engineering of training and evaluation datasets. Data is no longer a passive asset for collection but a dynamic, programmable product, subjected to continuous improvement, versioning, and management with software-like rigor. This industrialization of data curation is a response to the recognition that data quality, diversity, and integrity significantly impact model accuracy, fairness, and robustness, especially in enterprise applications.
- For instance, in the healthcare sector, data-centric AI has led to a 25% reduction in misdiagnosis rates, while in finance, it has improved forecast accuracy by 15%. This trend underscores the growing importance of AI data management in driving business outcomes across various industries.
Significant Market Challenges
The complexities and demands of handling vast amounts of data with rigorous quality assurance are significant challenges impeding industry expansion.
- The market is experiencing significant evolution as businesses increasingly adopt artificial intelligence systems that consume vast quantities of unstructured and semi-structured data. This shift from traditional analytics, which primarily leveraged structured data, poses profound data management challenges. Enterprises are grappling with implementing cohesive strategies for ingesting, cleaning, preparing, and governing diverse data modalities at petabyte and even exabyte scale. The stakes are high, as the quality and integrity of the training data directly and exponentially impact the performance, safety, and reliability of the resulting AI model.
- According to a recent study, poor data quality can lead to operational costs increasing by 15%, while inaccurate forecasts can result in a 20% loss in revenue. As AI applications expand across various sectors, including healthcare, finance, and manufacturing, effective data management will be crucial for businesses to maximize the benefits of their AI investments.
In-Depth Market Segmentation: AI Data Management Market
The AI data management industry research report provides comprehensive data (region-wise segment analysis), with forecasts and estimates in "USD million" for the period 2025-2029, as well as historical data from 2019-2023 for the following segments.
- Component
- Platform
- Software tools
- Services
- Technology
- Machine learning
- Natural language processing
- Computer vision
- Context awareness
- End-user
- BFSI
- Retail and e-commerce
- Healthcare and life sciences
- Manufacturing
- Others
- Geography
- North America
- US
- Canada
- Europe
- France
- Germany
- Italy
- UK
- APAC
- China
- India
- Japan
- South Korea
- Rest of World (ROW)
- North America
By Component Insights
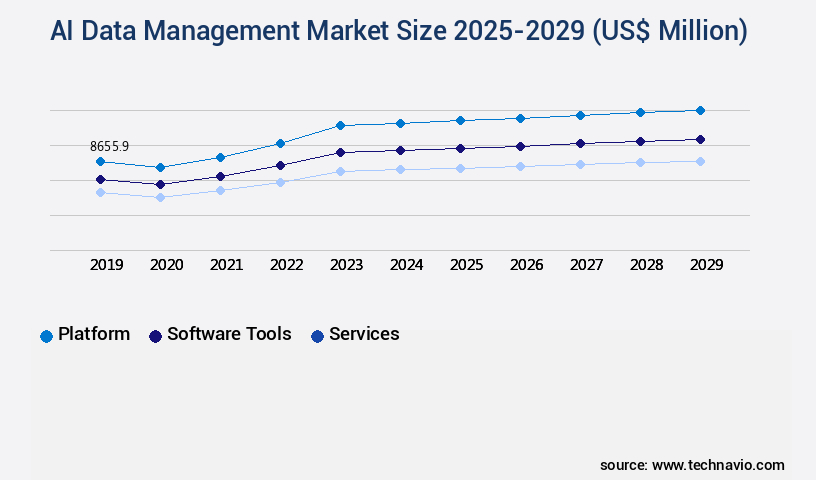
The platform segment is estimated to witness significant growth during the forecast period.
The market is a dynamic and expanding landscape, driven by the growing demand for advanced data processing and analytics capabilities. Unified platforms, which integrate data engineering, data science, and machine learning operations, are becoming increasingly essential for enterprises seeking to break down data silos. These platforms facilitate data integration processes, employing anomaly detection algorithms and synthetic data generation, while ensuring data access control and security through cloud-based data platforms and data security protocols. Model accuracy assessment is achieved via reinforcement learning algorithms and model training pipelines, with model retraining schedules and data lineage tracking for continuous improvement. Data visualization dashboards and data governance frameworks enable effective model performance monitoring and data cleansing techniques.
Predictive maintenance models, risk assessment models, and machine learning models are deployed using various strategies, including deep learning architectures and natural language processing. Data labeling techniques, time series forecasting, and data quality metrics are integral components of these platforms. With the implementation of data privacy regulations, AI bias mitigation, and fraud detection systems, on-premise data solutions and data version control are also prioritized. The rise of the data lakehouse architecture, combining the scalability and cost efficiency of data lakes with the performance and management features of data warehouses, is a significant market trend.
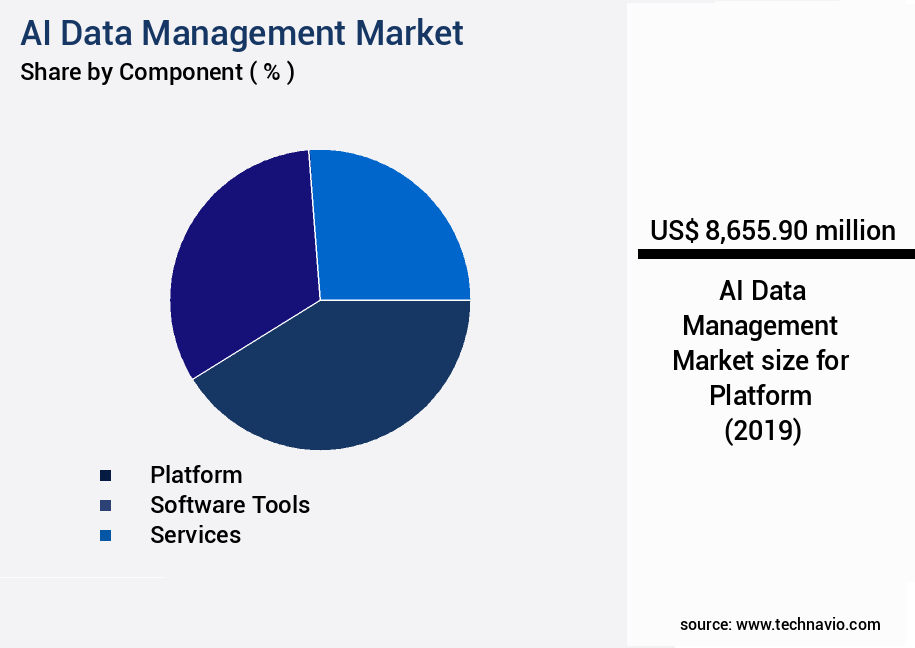
The Platform segment was valued at USD 8.66 billion in 2019 and showed a gradual increase during the forecast period.
Regional Analysis
North America is estimated to contribute 35% to the growth of the global market during the forecast period.Technavio's analysts have elaborately explained the regional trends and drivers that shape the market during the forecast period.

See How AI Data Management Market Demand is Rising in North America Request Free Sample
The market is experiencing robust growth, with North America leading the charge. The region, spearheaded by the United States, houses the world's most prominent technology corporations, a thriving venture capital scene, prestigious research institutions, and a large, digitally advanced business community. This symbiotic ecosystem fosters continuous innovation and brisk market absorption. Key factors fueling this market expansion include the burgeoning demand for AI capabilities in various industries, such as finance, healthcare, retail, and entertainment. Furthermore, hyperscale cloud providers like Amazon Web Services, Microsoft Azure, and Google Cloud significantly contribute by providing fundamental infrastructure and competing with their advanced AI and data management platforms.
According to recent estimates, the North American market share accounts for over 45% of the market, underscoring its market dominance. This trend is expected to persist due to the region's robust technological foundation and the ever-increasing adoption of AI solutions.
Customer Landscape of AI Data Management Industry
Competitive Intelligence by Technavio Analysis: Leading Players in the AI Data Management Market
Companies are implementing various strategies, such as strategic alliances, ai data management market forecast, partnerships, mergers and acquisitions, geographical expansion, and product/service launches, to enhance their presence in the industry.
Accenture PLC - The company's AI Data suite empowers scalable data management through advanced governance and automation, delivering efficient data capital management solutions using artificial intelligence technology.
The industry research and growth report includes detailed analyses of the competitive landscape of the market and information about key companies, including:
- Accenture PLC
- Alibaba Cloud
- Amazon Web Services Inc.
- Databricks Inc.
- Dataiku Inc.
- DataRobot Inc.
- Google LLC
- Hewlett Packard Enterprise Co.
- Informatica Inc.
- International Business Machines Corp.
- Microsoft Corp.
- Oracle Corp.
- QlikTech International AB
- Salesforce Inc.
- SAP SE
- SAS Institute Inc.
- Snowflake Inc.
- Starburst Data, Inc.
- Teradata Corp.
- TIBCO Software Inc.
Qualitative and quantitative analysis of companies has been conducted to help clients understand the wider business environment as well as the strengths and weaknesses of key industry players. Data is qualitatively analyzed to categorize companies as pure play, category-focused, industry-focused, and diversified; it is quantitatively analyzed to categorize companies as dominant, leading, strong, tentative, and weak.
Recent Development and News in AI Data Management Market
- In August 2024, IBM announced the launch of its new AI data management platform, "IBM Watson OpenScale," designed to help businesses ensure ethical and unbiased AI usage. This platform, which integrates AI with data management, was showcased at the IBM Think 2024 conference (IBM Press Release, 2024).
- In November 2024, Microsoft and Google, two major tech giants, entered into a strategic partnership to collaborate on AI data management solutions. This partnership aimed to combine Microsoft's Azure Synapse Analytics and Google's BigQuery to provide enhanced AI capabilities to their respective customers (Microsoft Blog, 2024).
- In March 2025, Snowflake, a leading data cloud company, raised USD1.0 billion in a funding round led by Salesforce Ventures and Sequoia Capital. This investment was aimed at expanding Snowflake's capabilities in AI data management and analytics (Snowflake Press Release, 2025).
- In May 2025, Amazon Web Services (AWS) received approval from the European Union for its new AI data management region in Frankfurt, Germany. This approval marked AWS's commitment to providing European businesses with secure and compliant AI solutions (AWS Press Release, 2025).
Dive into Technavio's robust research methodology, blending expert interviews, extensive data synthesis, and validated models for unparalleled AI Data Management Market insights. See full methodology.
|
Market Scope |
|
|
Report Coverage |
Details |
|
Page number |
237 |
|
Base year |
2024 |
|
Historic period |
2019-2023 |
|
Forecast period |
2025-2029 |
|
Growth momentum & CAGR |
Accelerate at a CAGR of 19.7% |
|
Market growth 2025-2029 |
USD 51042 million |
|
Market structure |
Fragmented |
|
YoY growth 2024-2025(%) |
19.3 |
|
Key countries |
US, China, Japan, Canada, Germany, UK, India, South Korea, France, and Italy |
|
Competitive landscape |
Leading Companies, Market Positioning of Companies, Competitive Strategies, and Industry Risks |
Why Choose Technavio for AI Data Management Market Insights?
"Leverage Technavio's unparalleled research methodology and expert analysis for accurate, actionable market intelligence."
The market is experiencing significant growth as businesses seek to harness the power of machine learning and artificial intelligence to improve data quality and drive business outcomes. One key area of focus is implementing data governance policies for AI, ensuring that data is managed effectively and adheres to regulatory requirements. This includes managing AI model version control, detecting and mitigating model bias, and optimizing model training for improved performance. Another critical aspect of AI data management is ensuring data privacy and security. With the increasing use of AI in various industries, from supply chain to compliance and operational planning, protecting sensitive data is paramount. Measuring the accuracy of AI models is also essential, as incorrect predictions can lead to costly errors.
Deploying AI models into production environments and using data visualization for better insights are key to realizing the full potential of AI. Optimizing model training and applying AI to improve fraud detection, personalized customer experiences, predictive maintenance in manufacturing, and building AI-powered recommendation systems are just a few examples of how businesses are leveraging AI to gain a competitive edge. Integrating AI solutions with existing systems and developing explainable AI models are also important considerations. Automating data labeling workflows and handling missing data in machine learning are essential for maintaining data quality and ensuring efficient model training. Furthermore, using synthetic data to train AI models can help reduce the need for expensive and time-consuming human labeling. Compared to traditional data management methods, AI data management offers significant benefits in terms of efficiency and accuracy. For instance, in the manufacturing sector, predictive maintenance using AI can reduce downtime by up to 20%, leading to substantial cost savings and improved operational performance. Overall, the market is poised for continued growth as businesses increasingly rely on AI to gain insights and drive business outcomes.
What are the Key Data Covered in this AI Data Management Market Research and Growth Report?
-
What is the expected growth of the AI Data Management Market between 2025 and 2029?
-
USD 51.04 billion, at a CAGR of 19.7%
-
-
What segmentation does the market report cover?
-
The report is segmented by Component (Platform, Software tools, and Services), Technology (Machine learning, Natural language processing, Computer vision, and Context awareness), End-user (BFSI, Retail and e-commerce, Healthcare and life sciences, Manufacturing, and Others), and Geography (North America, APAC, Europe, Middle East and Africa, and South America)
-
-
Which regions are analyzed in the report?
-
North America, APAC, Europe, Middle East and Africa, and South America
-
-
What are the key growth drivers and market challenges?
-
Proliferation of generative AI and large language models, Extreme data complexity and quality assurance at scale
-
-
Who are the major players in the AI Data Management Market?
-
Accenture PLC, Alibaba Cloud, Amazon Web Services Inc., Databricks Inc., Dataiku Inc., DataRobot Inc., Google LLC, Hewlett Packard Enterprise Co., Informatica Inc., International Business Machines Corp., Microsoft Corp., Oracle Corp., QlikTech International AB, Salesforce Inc., SAP SE, SAS Institute Inc., Snowflake Inc., Starburst Data, Inc., Teradata Corp., and TIBCO Software Inc.
-
We can help! Our analysts can customize this AI data management market research report to meet your requirements.
 RIA -
RIA - 
