AI And ML In Oil And Gas Market Analysis, Size, and Forecast 2025-2029: North America (US and Canada), Europe (Germany, UK, and France), APAC (China, India, and Japan), Middle East and Africa (Saudi Arabia and UAE), South America (Brazil and Argentina), and Rest of World (ROW)

AI And ML In Oil And Gas Market Analysis, Size, and Forecast 2025-2029:
North America (US and Canada), Europe (Germany, UK, and France), APAC (China, India, and Japan), Middle East and Africa (Saudi Arabia and UAE), South America (Brazil and Argentina), and Rest of World (ROW)

Published: Dec 2025 279 Pages SKU: IRTNTR80992

Market Overview at a Glance

$5.91 B
Market Opportunity
15.1%
CAGR 2024 - 2029
29.6%
APAC Growth
$4.03 B
Solutions segment 2023

AI And ML In Oil And Gas Market Size 2025-2029

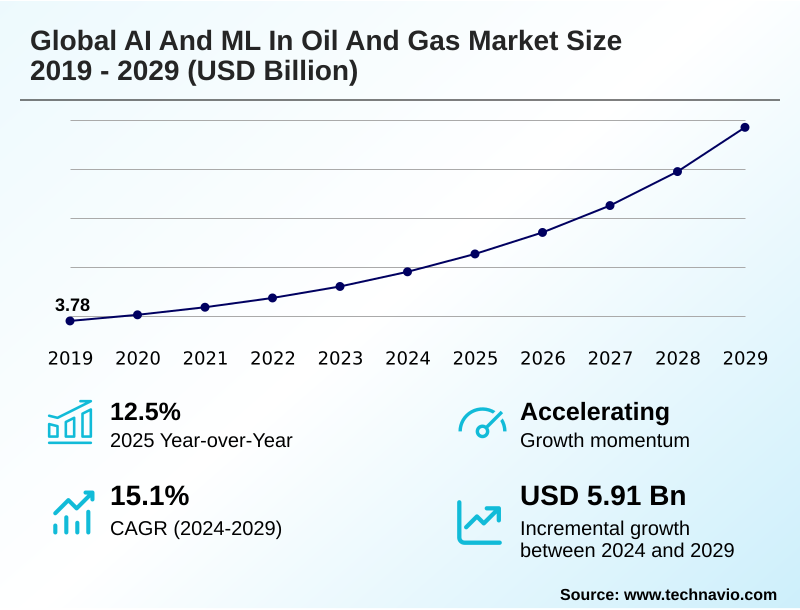
The ai and ml in oil and gas market size is valued to increase by USD 5.91 billion, at a CAGR of 15.1% from 2024 to 2029. Imperative for enhanced operational efficiency and cost reduction will drive the ai and ml in oil and gas market.

Major Market Trends & Insights

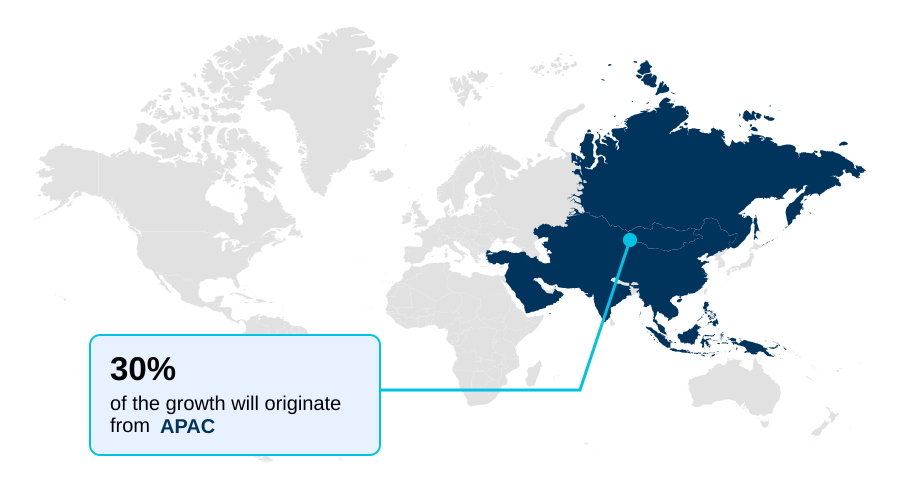
  • APAC dominated the market and accounted for a 29.6% growth during the forecast period.
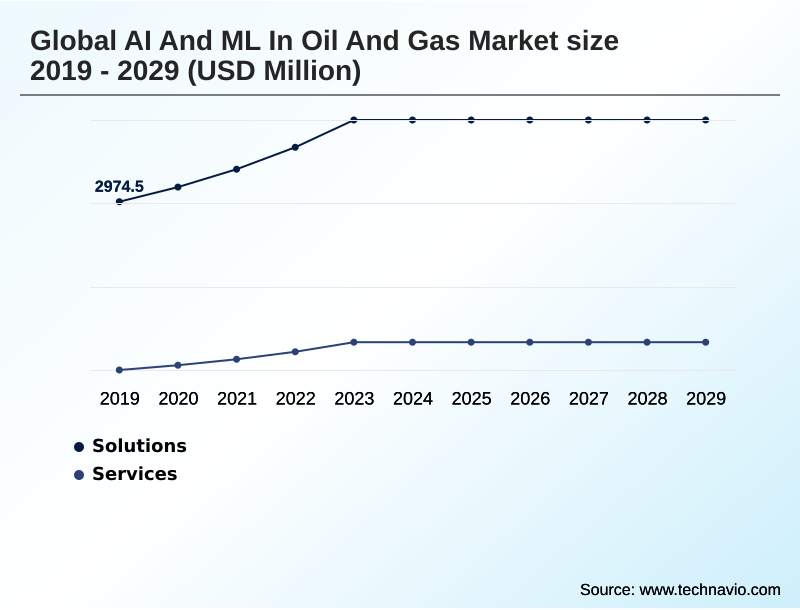
  • By Component - Solutions segment was valued at USD 4.03 billion in 2023
  • By Application - Predictive maintenance segment accounted for the largest market revenue share in 2023

Market Size & Forecast

  • Market Opportunities: USD 7.92 billion
  • Market Future Opportunities: USD 5.91 billion
  • CAGR from 2024 to 2029 : 15.1%

Market Summary

  • The AI and ML in oil and gas market is undergoing a fundamental transformation, driven by the strategic imperative to enhance operational efficiency and meet stringent environmental standards. The proliferation of big data from the industrial internet of things (iiot) and the accessibility of cloud computing have created a fertile ground for ai-based reservoir simulation and deep learning models.
  • These technologies are moving beyond pilot projects to become core components of digital transformation, with applications in prescriptive maintenance ai and automated drilling optimization. For example, a midstream operator can deploy ai-powered inspection robots that use computer vision for safety to autonomously patrol thousands of miles of pipeline.
  • These systems provide real-time pipeline integrity monitoring, detecting minute leaks and enabling a response that is more than 50% faster than traditional methods. This shift from reactive to predictive operations also faces challenges, including data integration complexities and a shortage of talent with hybrid domain and data science skills.
  • However, the demonstrated value in reducing costs, enhancing safety through ai for process safety management, and improving esg compliance with ai continues to accelerate adoption across the industry.

What will be the Size of the AI And ML In Oil And Gas Market during the forecast period?

Get Key Insights on Market Forecast (PDF) Request Free Sample

How is the AI And ML In Oil And Gas Market Segmented?

The ai and ml in oil and gas industry research report provides comprehensive data (region-wise segment analysis), with forecasts and estimates in "USD million" for the period 2025-2029, as well as historical data from 2019-2023 for the following segments.

  • Component
    • Solutions
    • Services
  • Application
    • Predictive maintenance
    • Production optimization
    • Supply chain and logistics
    • Exploration and drilling
    • Others
  • End-user
    • Downstream
    • Upstream
    • Midstream
  • Geography
    • North America
      • US
      • Canada
    • Europe
      • Germany
      • UK
      • France
    • APAC
      • China
      • India
      • Japan
    • Middle East and Africa
      • Saudi Arabia
      • UAE
    • South America
      • Brazil
      • Argentina
    • Rest of World (ROW)

By Component Insights

The solutions segment is estimated to witness significant growth during the forecast period.

The solutions segment is defined by advanced software and platforms enabling data-driven decisions and intelligent automation. This includes comprehensive production optimization platforms that utilize iot sensor data analysis and integrated ecosystems providing ai-powered process control for ml for downstream processes.

Specialized point applications are also critical, offering deep learning models for specific challenges like seismic data interpretation and ai for exploration and production.

These tools leverage high-performance computing for ai to execute complex tasks, improving fault detection in subsurface imaging algorithms by up to 15%. The deployment of ai for hydraulic fracturing and drilling optimization with ai is transforming upstream efficiency.

Solutions focused on generative ai knowledge management and ai in upstream operations are also gaining traction, democratizing access to complex operational insights and enabling cognitive computing for geoscience.

Request Free Sample

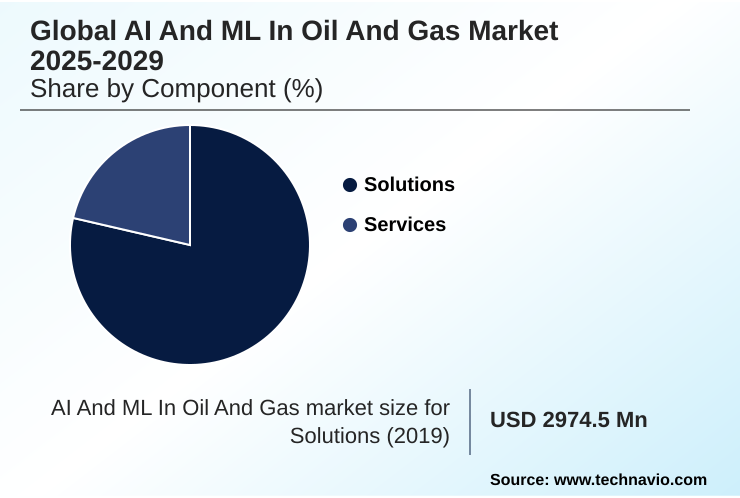
The Solutions segment was valued at USD 4.03 billion in 2023 and showed a gradual increase during the forecast period.

Request Free Sample

Regional Analysis

APAC is estimated to contribute 29.6% to the growth of the global market during the forecast period.Technavio’s analysts have elaborately explained the regional trends and drivers that shape the market during the forecast period.

See How AI And ML In Oil And Gas Market Demand is Rising in APAC Request Free Sample

The geographic landscape of the global AI and ML in oil and gas market 2025-2029 is diverse, with adoption patterns reflecting regional priorities.

North America leads in applying ai for unconventional resources, focusing on drilling optimization with ai and real-time geosteering ai to drive efficiency in shale plays.

Europe’s mature offshore basins prioritize asset integrity management and machine learning for asset integrity, with digital twin simulation being key to extending asset life.

The APAC region is projected to exhibit the fastest growth, with a dynamic expansion rate nearly 4% higher than in Europe, driven by national oil companies investing heavily in modernizing infrastructure and ai for production optimization.

The Middle East is aggressively deploying large-scale ai for enhanced oil recovery and real-time production monitoring. Deployment of ai for subsea systems is critical in deepwater regions like South America, while ai-driven energy trading models are becoming standard globally.

Market Dynamics

Our researchers analyzed the data with 2024 as the base year, along with the key drivers, trends, and challenges. A holistic analysis of drivers will help companies refine their marketing strategies to gain a competitive advantage.

  • Strategic implementation of artificial intelligence is redefining operational benchmarks across the energy value chain. Companies are increasingly focused on using ai to reduce drilling time through better subsurface analysis and real-time adjustments. A key application is the predictive maintenance for electric submersible pumps, which forecasts failures and minimizes costly downtime.
  • In downstream, ai applications for refinery process control and models for optimizing refinery yield with machine learning are becoming standard for maximizing profitability. Upstream, machine learning for seismic fault interpretation and the use of ai models for subsurface reservoir characterization are accelerating exploration cycles. The rise of generative ai for oil and gas reports is unlocking decades of unstructured data.
  • For remote operations, edge ai for remote offshore platforms enables immediate decision-making. In unconventional plays, optimizing hydraulic fracturing with ai and using models to predict parent-child well interference are crucial for maximizing recovery. ESG drivers are pushing the adoption of ai-powered methane leak detection systems.
  • The progress in autonomous drilling platform safety protocols and real-time geosteering for horizontal wells showcases the maturity of these technologies. In logistics, supply chain logistics optimization with ml improves efficiency. Other impactful use cases include enhancing oil recovery with ai models, deploying digital twin for offshore asset management, and leveraging ai for optimizing lng plant throughput.
  • Furthermore, computer vision for ppe compliance monitoring and anomaly detection in scada systems using ai enhance safety and security. This holistic adoption, including using ai for carbon capture modeling and ai-driven demand forecasting for petroleum products, has led to a twofold improvement in project completion timelines compared to legacy methods.

What are the key market drivers leading to the rise in the adoption of AI And ML In Oil And Gas Industry?

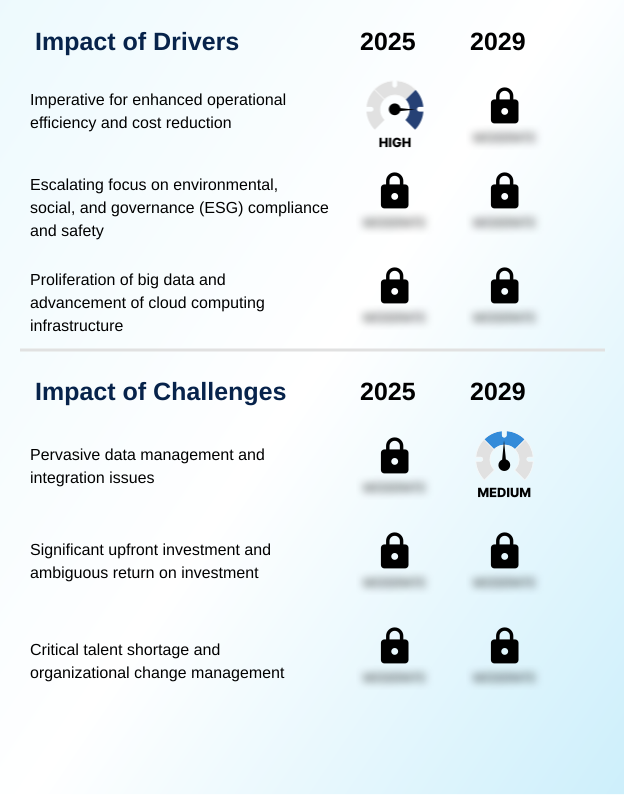
  • The imperative to enhance operational efficiency and reduce costs across the value chain remains a primary driver for market adoption.

  • Market growth is propelled by the imperative for enhanced efficiency and cost reduction. The application of AI in upstream operations and machine learning in midstream logistics delivers tangible returns, with some companies reporting operational efficiency gains of up to 15%.
  • A second major driver is the escalating focus on ESG compliance. AI for emissions tracking and tools for methane emissions detection are no longer optional, enabling operators to achieve a 20% reduction in reported fugitive emissions.
  • Finally, the proliferation of big data, coupled with advanced cloud computing and a robust industrial internet of things (iiot), provides the necessary foundation.
  • This synergy allows for the effective use of ai for petrochemical plants and real-time geosteering systems, turning vast datasets into actionable intelligence.

What are the market trends shaping the AI And ML In Oil And Gas Industry?

  • The emergence of generative AI and large language models is a key market trend, driving new capabilities in knowledge management and data synthesis.

  • The market is shaped by three transformative trends. The emergence of the generative AI in energy sector and large language models is unlocking unstructured data, improving knowledge retrieval speeds by over 50% for applications like ai-based reservoir simulation.
  • Second, a move toward hyper-automation and intelligent automation in oilfield is creating self-optimizing assets, with autonomous drilling systems and ai for process safety management reducing manual interventions. Finally, the proliferation of edge AI for remote assets and edge computing in energy is critical for real-time decision-making where connectivity is limited.
  • This enables immediate responses in machine learning for asset integrity, with anomaly detection algorithms reducing threat identification times by up to 90%, thereby enhancing both safety and operational uptime with ai for production optimization.

What challenges does the AI And ML In Oil And Gas Industry face during its growth?

  • Pervasive data management and integration issues present a significant challenge to the effective deployment and scaling of AI initiatives.

  • Despite significant opportunities, the market faces key challenges. Pervasive data management issues, including data silos and poor quality, remain a primary obstacle, with data integration often consuming over 60% of an AI project's timeline. Second, the significant upfront investment for computer vision in oil and gas and other advanced tools is coupled with ambiguous ROI, causing many initiatives to stall.
  • It's estimated that up to 40% of pilot projects fail to scale due to an unclear business case. Finally, a critical talent shortage of professionals skilled in both domain expertise and data science, alongside organizational resistance to change, hampers the effective adoption of even the most sophisticated wellbore stability analysis and drilling hazard prediction models.

Exclusive Technavio Analysis on Customer Landscape

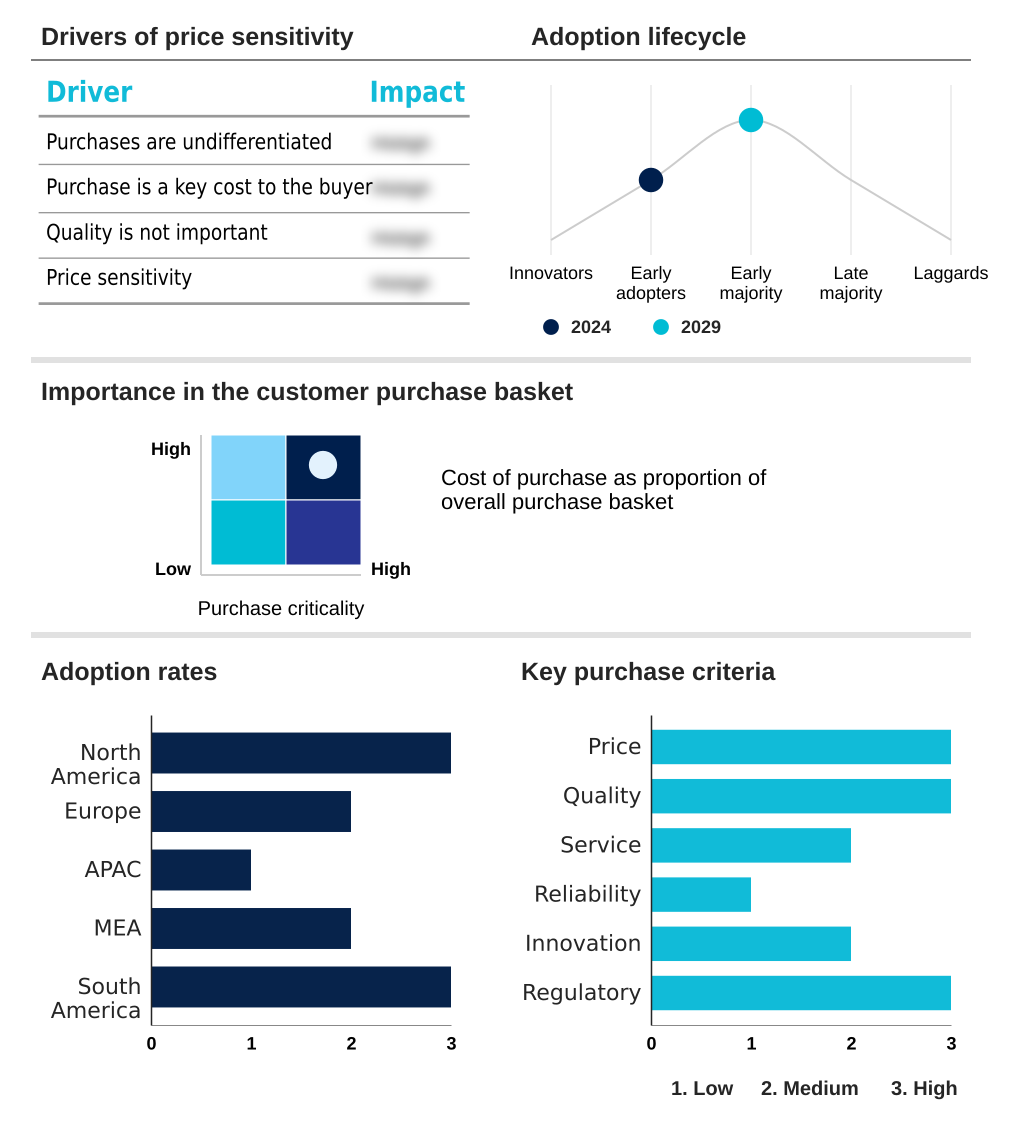
The ai and ml in oil and gas market forecasting report includes the adoption lifecycle of the market, covering from the innovator’s stage to the laggard’s stage. It focuses on adoption rates in different regions based on penetration. Furthermore, the ai and ml in oil and gas market report also includes key purchase criteria and drivers of price sensitivity to help companies evaluate and develop their market growth analysis strategies.

Customer Landscape of AI And ML In Oil And Gas Industry

Competitive Landscape

Companies are implementing various strategies, such as strategic alliances, ai and ml in oil and gas market forecast, partnerships, mergers and acquisitions, geographical expansion, and product/service launches, to enhance their presence in the industry.

ABB Ltd. - Enables real-time process optimization and emissions reduction through AI and ML platforms, driving efficiency in industrial automation and energy management.

The industry research and growth report includes detailed analyses of the competitive landscape of the market and information about key companies, including:

  • ABB Ltd.
  • Accenture PLC
  • Baker Hughes Co.
  • Beyond Limits
  • BP Plc
  • C3.ai Inc.
  • Exxon Mobil Corp.
  • Google LLC
  • Halliburton Co.
  • IBM Corp.
  • Microsoft Corp.
  • Oracle Corp.
  • Saudi Arabian Oil Co.
  • Schlumberger Ltd.
  • SensorUp Inc.
  • Shell plc
  • Siemens AG
  • SparkCognition Inc.
  • TechnipFMC plc

Qualitative and quantitative analysis of companies has been conducted to help clients understand the wider business environment as well as the strengths and weaknesses of key industry players. Data is qualitatively analyzed to categorize companies as pure play, category-focused, industry-focused, and diversified; it is quantitatively analyzed to categorize companies as dominant, leading, strong, tentative, and weak.

Recent Development and News in Ai and ml in oil and gas market

  • In September, 2024, Halliburton Co. announced a strategic partnership with a leading cloud provider to integrate advanced generative AI into its DS365.ai platform, aiming to accelerate subsurface decision analysis and well planning for clients.
  • In November, 2024, Baker Hughes Co. launched a new suite of edge AI solutions designed for real-time monitoring and autonomous control of subsea production systems, enhancing safety and efficiency in deepwater operations.
  • In February, 2025, a consortium of venture capital firms invested a significant sum into SparkCognition Inc. to scale its AI-powered predictive maintenance and asset performance management solutions, specifically targeting the downstream refining sector.
  • In April, 2025, a new industry-wide initiative led by major operators like Shell plc and BP Plc was launched to standardize data formats for AI-driven emissions monitoring, aiming to improve ESG reporting accuracy and interoperability across the sector.

Dive into Technavio’s robust research methodology, blending expert interviews, extensive data synthesis, and validated models for unparalleled AI And ML In Oil And Gas Market insights. See full methodology.

Market Scope
Page number 279
Base year 2024
Historic period 2019-2023
Forecast period 2025-2029
Growth momentum & CAGR Accelerate at a CAGR of 15.1%
Market growth 2025-2029 USD 5912.6 million
Market structure Fragmented
YoY growth 2024-2025(%) 12.5%
Key countries US, Canada, Russia, Germany, UK, France, China, India, Japan, South Korea, Australia, Saudi Arabia, UAE, Brazil and Argentina
Competitive landscape Leading Companies, Market Positioning of Companies, Competitive Strategies, and Industry Risks

Request Free Sample

Research Analyst Overview

  • The global AI and ML in oil and gas market 2025-2029 is defined by the pervasive integration of intelligent technologies across operations. Core applications include ai-powered process control and production optimization platforms, which are now standard for maximizing yields.
  • In the upstream sector, seismic data interpretation and reservoir characterization ml are being revolutionized by subsurface imaging algorithms and deep learning models, enabling more accurate subsurface decision analysis. This is complemented by predictive drilling analytics and the deployment of autonomous drilling systems, which leverage real-time geosteering ai and wellbore stability analysis to mitigate drilling hazard prediction.
  • Asset integrity management is a critical focus, with prescriptive maintenance ai and iot sensor data analysis driving reliability. Midstream operations benefit from pipeline integrity monitoring, while downstream sees advances in refinery optimization ai. A key trend is the use of natural language processing for reports and generative ai knowledge management.
  • Technologically, the market relies on edge ai for remote assets, digital twin simulation, and high-performance computing for ai supported by data mesh architecture. Enhanced oil recovery modeling, carbon capture utilization storage ai, and methane emissions detection are key for sustainability.
  • Other innovations include smart ship operations, automated drilling optimization, real-time production monitoring, ai-driven demand forecasting, and ai-powered inspection robots, with anomaly detection algorithms improving safety. This strategic shift has enabled firms to achieve a 30% reduction in data processing time, directly influencing boardroom decisions on capital allocation and ESG compliance.

What are the Key Data Covered in this AI And ML In Oil And Gas Market Research and Growth Report?

  • What is the expected growth of the AI And ML In Oil And Gas Market between 2025 and 2029?

    • USD 5.91 billion, at a CAGR of 15.1%

  • What segmentation does the market report cover?

    • The report is segmented by Component (Solutions, and Services), Application (Predictive maintenance, Production optimization, Supply chain and logistics, Exploration and drilling, and Others), End-user (Downstream, Upstream, and Midstream) and Geography (North America, Europe, APAC, Middle East and Africa, South America)

  • Which regions are analyzed in the report?

    • North America, Europe, APAC, Middle East and Africa and South America

  • What are the key growth drivers and market challenges?

    • Imperative for enhanced operational efficiency and cost reduction, Pervasive data management and integration issues

  • Who are the major players in the AI And ML In Oil And Gas Market?

    • ABB Ltd., Accenture PLC, Baker Hughes Co., Beyond Limits, BP Plc, C3.ai Inc., Exxon Mobil Corp., Google LLC, Halliburton Co., IBM Corp., Microsoft Corp., Oracle Corp., Saudi Arabian Oil Co., Schlumberger Ltd., SensorUp Inc., Shell plc, Siemens AG, SparkCognition Inc. and TechnipFMC plc

Market Research Insights

  • The AI and ML in oil and gas market is characterized by a rapid shift toward intelligent automation in oilfield operations. The adoption of digital oilfield technologies and ai for exploration and production is accelerating project timelines by over 20%.
  • In parallel, ml for downstream processes, including ai for petrochemical plants and autonomous refinery operations, is cutting energy waste by 15%, while machine learning in midstream enhances smart pipeline management. The deployment of ai-powered predictive maintenance and ai in asset performance management reduces unplanned downtime significantly.
  • A focus on esg compliance with ai is driving investments in ai for emissions tracking and ai for carbon capture projects. The use of generative ai in energy sector and cognitive computing for geoscience is revolutionizing knowledge management.
  • Technologies such as real-time drilling optimization, ai for enhanced oil recovery, and machine learning for well completion are central to maximizing asset value. The market also sees growth in specialized areas like ai for unconventional resources, ai applications in lng plants, and ai for subsea systems.

We can help! Our analysts can customize this ai and ml in oil and gas market research report to meet your requirements.

Get in touch

1. Executive Summary

1.1 Market overview

Executive Summary - Chart on Market Overview
Executive Summary - Data Table on Market Overview
Executive Summary - Chart on Global Market Characteristics
Executive Summary - Chart on Market by Geography
Executive Summary - Chart on Market Segmentation by Component
Executive Summary - Chart on Market Segmentation by Application
Executive Summary - Chart on Market Segmentation by End-user
Executive Summary - Chart on Incremental Growth
Executive Summary - Data Table on Incremental Growth
Executive Summary - Chart on Company Market Positioning

2. Technavio Analysis

2.1 Analysis of price sensitivity, lifecycle, customer purchase basket, adoption rates, and purchase criteria

2.2 Criticality of inputs and Factors of differentiation

Chart on Overview on criticality of inputs and factors of differentiation

2.3 Factors of disruption

Chart on Overview on factors of disruption

2.4 Impact of drivers and challenges

Chart on Impact of drivers and challenges in 2024 and 2029

3. Market Landscape

3.1 Market ecosystem

Chart on Parent Market
Data Table on - Parent Market

3.2 Market characteristics

Chart on Market characteristics analysis

3.3 Value chain analysis

Chart on Value chain analysis

4. Market Sizing

4.1 Market definition

Data Table on Offerings of companies included in the market definition

4.2 Market segment analysis

Market segments

4.3 Market size 2024

4.4 Market outlook: Forecast for 2024-2029

Chart on Global - Market size and forecast 2024-2029 ($ million)
Data Table on Global - Market size and forecast 2024-2029 ($ million)
Chart on Global Market: Year-over-year growth 2024-2029 (%)
Data Table on Global Market: Year-over-year growth 2024-2029 (%)

5. Historic Market Size

5.1 Global AI And ML In Oil And Gas Market 2019 - 2023

Historic Market Size - Data Table on Global AI And ML In Oil And Gas Market 2019 - 2023 ($ million)

5.2 Component segment analysis 2019 - 2023

Historic Market Size - Component Segment 2019 - 2023 ($ million)

5.3 Application segment analysis 2019 - 2023

Historic Market Size - Application Segment 2019 - 2023 ($ million)

5.4 End-user segment analysis 2019 - 2023

Historic Market Size - End-user Segment 2019 - 2023 ($ million)

5.5 Geography segment analysis 2019 - 2023

Historic Market Size - Geography Segment 2019 - 2023 ($ million)

5.6 Country segment analysis 2019 - 2023

Historic Market Size - Country Segment 2019 - 2023 ($ million)

6. Five Forces Analysis

6.1 Five forces summary

Five forces analysis - Comparison between 2024 and 2029

6.2 Bargaining power of buyers

Bargaining power of buyers - Impact of key factors 2024 and 2029

6.3 Bargaining power of suppliers

Bargaining power of suppliers - Impact of key factors in 2024 and 2029

6.4 Threat of new entrants

Threat of new entrants - Impact of key factors in 2024 and 2029

6.5 Threat of substitutes

Threat of substitutes - Impact of key factors in 2024 and 2029

6.6 Threat of rivalry

Threat of rivalry - Impact of key factors in 2024 and 2029

6.7 Market condition

Chart on Market condition - Five forces 2024 and 2029

7. Market Segmentation by Component

7.1 Market segments

Chart on Component - Market share 2024-2029 (%)
Data Table on Component - Market share 2024-2029 (%)

7.2 Comparison by Component

Chart on Comparison by Component
Data Table on Comparison by Component

7.3 Solutions - Market size and forecast 2024-2029

Chart on Solutions - Market size and forecast 2024-2029 ($ million)
Data Table on Solutions - Market size and forecast 2024-2029 ($ million)
Chart on Solutions - Year-over-year growth 2024-2029 (%)
Data Table on Solutions - Year-over-year growth 2024-2029 (%)

7.4 Services - Market size and forecast 2024-2029

Chart on Services - Market size and forecast 2024-2029 ($ million)
Data Table on Services - Market size and forecast 2024-2029 ($ million)
Chart on Services - Year-over-year growth 2024-2029 (%)
Data Table on Services - Year-over-year growth 2024-2029 (%)

7.5 Market opportunity by Component

Market opportunity by Component ($ million)
Data Table on Market opportunity by Component ($ million)

8. Market Segmentation by Application

8.1 Market segments

Chart on Application - Market share 2024-2029 (%)
Data Table on Application - Market share 2024-2029 (%)

8.2 Comparison by Application

Chart on Comparison by Application
Data Table on Comparison by Application

8.3 Predictive maintenance - Market size and forecast 2024-2029

Chart on Predictive maintenance - Market size and forecast 2024-2029 ($ million)
Data Table on Predictive maintenance - Market size and forecast 2024-2029 ($ million)
Chart on Predictive maintenance - Year-over-year growth 2024-2029 (%)
Data Table on Predictive maintenance - Year-over-year growth 2024-2029 (%)

8.4 Production optimization - Market size and forecast 2024-2029

Chart on Production optimization - Market size and forecast 2024-2029 ($ million)
Data Table on Production optimization - Market size and forecast 2024-2029 ($ million)
Chart on Production optimization - Year-over-year growth 2024-2029 (%)
Data Table on Production optimization - Year-over-year growth 2024-2029 (%)

8.5 Supply chain and logistics - Market size and forecast 2024-2029

Chart on Supply chain and logistics - Market size and forecast 2024-2029 ($ million)
Data Table on Supply chain and logistics - Market size and forecast 2024-2029 ($ million)
Chart on Supply chain and logistics - Year-over-year growth 2024-2029 (%)
Data Table on Supply chain and logistics - Year-over-year growth 2024-2029 (%)

8.6 Exploration and drilling - Market size and forecast 2024-2029

Chart on Exploration and drilling - Market size and forecast 2024-2029 ($ million)
Data Table on Exploration and drilling - Market size and forecast 2024-2029 ($ million)
Chart on Exploration and drilling - Year-over-year growth 2024-2029 (%)
Data Table on Exploration and drilling - Year-over-year growth 2024-2029 (%)

8.7 Others - Market size and forecast 2024-2029

Chart on Others - Market size and forecast 2024-2029 ($ million)
Data Table on Others - Market size and forecast 2024-2029 ($ million)
Chart on Others - Year-over-year growth 2024-2029 (%)
Data Table on Others - Year-over-year growth 2024-2029 (%)

8.8 Market opportunity by Application

Market opportunity by Application ($ million)
Data Table on Market opportunity by Application ($ million)

9. Market Segmentation by End-user

9.1 Market segments

Chart on End-user - Market share 2024-2029 (%)
Data Table on End-user - Market share 2024-2029 (%)

9.2 Comparison by End-user

Chart on Comparison by End-user
Data Table on Comparison by End-user

9.3 Downstream - Market size and forecast 2024-2029

Chart on Downstream - Market size and forecast 2024-2029 ($ million)
Data Table on Downstream - Market size and forecast 2024-2029 ($ million)
Chart on Downstream - Year-over-year growth 2024-2029 (%)
Data Table on Downstream - Year-over-year growth 2024-2029 (%)

9.4 Upstream - Market size and forecast 2024-2029

Chart on Upstream - Market size and forecast 2024-2029 ($ million)
Data Table on Upstream - Market size and forecast 2024-2029 ($ million)
Chart on Upstream - Year-over-year growth 2024-2029 (%)
Data Table on Upstream - Year-over-year growth 2024-2029 (%)

9.5 Midstream - Market size and forecast 2024-2029

Chart on Midstream - Market size and forecast 2024-2029 ($ million)
Data Table on Midstream - Market size and forecast 2024-2029 ($ million)
Chart on Midstream - Year-over-year growth 2024-2029 (%)
Data Table on Midstream - Year-over-year growth 2024-2029 (%)

9.6 Market opportunity by End-user

Market opportunity by End-user ($ million)
Data Table on Market opportunity by End-user ($ million)

10. Customer Landscape

10.1 Customer landscape overview

Analysis of price sensitivity, lifecycle, customer purchase basket, adoption rates, and purchase criteria

11. Geographic Landscape

11.1 Geographic segmentation

Chart on Market share by geography 2024-2029 (%)
Data Table on Market share by geography 2024-2029 (%)

11.2 Geographic comparison

Chart on Geographic comparison
Data Table on Geographic comparison

11.3 North America - Market size and forecast 2024-2029

Chart on North America - Market size and forecast 2024-2029 ($ million)
Data Table on North America - Market size and forecast 2024-2029 ($ million)
Chart on North America - Year-over-year growth 2024-2029 (%)
Data Table on North America - Year-over-year growth 2024-2029 (%)
Chart on Regional Comparison - North America
Data Table on Regional Comparison - North America

11.3.1 US - Market size and forecast 2024-2029

Chart on US - Market size and forecast 2024-2029 ($ million)
Data Table on US - Market size and forecast 2024-2029 ($ million)
Chart on US - Year-over-year growth 2024-2029 (%)
Data Table on US - Year-over-year growth 2024-2029 (%)

11.3.2 Canada - Market size and forecast 2024-2029

Chart on Canada - Market size and forecast 2024-2029 ($ million)
Data Table on Canada - Market size and forecast 2024-2029 ($ million)
Chart on Canada - Year-over-year growth 2024-2029 (%)
Data Table on Canada - Year-over-year growth 2024-2029 (%)

11.4 Europe - Market size and forecast 2024-2029

Chart on Europe - Market size and forecast 2024-2029 ($ million)
Data Table on Europe - Market size and forecast 2024-2029 ($ million)
Chart on Europe - Year-over-year growth 2024-2029 (%)
Data Table on Europe - Year-over-year growth 2024-2029 (%)
Chart on Regional Comparison - Europe
Data Table on Regional Comparison - Europe

11.4.1 Russia - Market size and forecast 2024-2029

Chart on Russia - Market size and forecast 2024-2029 ($ million)
Data Table on Russia - Market size and forecast 2024-2029 ($ million)
Chart on Russia - Year-over-year growth 2024-2029 (%)
Data Table on Russia - Year-over-year growth 2024-2029 (%)

11.4.2 Germany - Market size and forecast 2024-2029

Chart on Germany - Market size and forecast 2024-2029 ($ million)
Data Table on Germany - Market size and forecast 2024-2029 ($ million)
Chart on Germany - Year-over-year growth 2024-2029 (%)
Data Table on Germany - Year-over-year growth 2024-2029 (%)

11.4.3 UK - Market size and forecast 2024-2029

Chart on UK - Market size and forecast 2024-2029 ($ million)
Data Table on UK - Market size and forecast 2024-2029 ($ million)
Chart on UK - Year-over-year growth 2024-2029 (%)
Data Table on UK - Year-over-year growth 2024-2029 (%)

11.4.4 France - Market size and forecast 2024-2029

Chart on France - Market size and forecast 2024-2029 ($ million)
Data Table on France - Market size and forecast 2024-2029 ($ million)
Chart on France - Year-over-year growth 2024-2029 (%)
Data Table on France - Year-over-year growth 2024-2029 (%)

11.5 APAC - Market size and forecast 2024-2029

Chart on APAC - Market size and forecast 2024-2029 ($ million)
Data Table on APAC - Market size and forecast 2024-2029 ($ million)
Chart on APAC - Year-over-year growth 2024-2029 (%)
Data Table on APAC - Year-over-year growth 2024-2029 (%)
Chart on Regional Comparison - APAC
Data Table on Regional Comparison - APAC

11.5.1 China - Market size and forecast 2024-2029

Chart on China - Market size and forecast 2024-2029 ($ million)
Data Table on China - Market size and forecast 2024-2029 ($ million)
Chart on China - Year-over-year growth 2024-2029 (%)
Data Table on China - Year-over-year growth 2024-2029 (%)

11.5.2 India - Market size and forecast 2024-2029

Chart on India - Market size and forecast 2024-2029 ($ million)
Data Table on India - Market size and forecast 2024-2029 ($ million)
Chart on India - Year-over-year growth 2024-2029 (%)
Data Table on India - Year-over-year growth 2024-2029 (%)

11.5.3 Japan - Market size and forecast 2024-2029

Chart on Japan - Market size and forecast 2024-2029 ($ million)
Data Table on Japan - Market size and forecast 2024-2029 ($ million)
Chart on Japan - Year-over-year growth 2024-2029 (%)
Data Table on Japan - Year-over-year growth 2024-2029 (%)

11.5.4 South Korea - Market size and forecast 2024-2029

Chart on South Korea - Market size and forecast 2024-2029 ($ million)
Data Table on South Korea - Market size and forecast 2024-2029 ($ million)
Chart on South Korea - Year-over-year growth 2024-2029 (%)
Data Table on South Korea - Year-over-year growth 2024-2029 (%)

11.5.5 Australia - Market size and forecast 2024-2029

Chart on Australia - Market size and forecast 2024-2029 ($ million)
Data Table on Australia - Market size and forecast 2024-2029 ($ million)
Chart on Australia - Year-over-year growth 2024-2029 (%)
Data Table on Australia - Year-over-year growth 2024-2029 (%)

11.6 Middle East and Africa - Market size and forecast 2024-2029

Chart on Middle East and Africa - Market size and forecast 2024-2029 ($ million)
Data Table on Middle East and Africa - Market size and forecast 2024-2029 ($ million)
Chart on Middle East and Africa - Year-over-year growth 2024-2029 (%)
Data Table on Middle East and Africa - Year-over-year growth 2024-2029 (%)
Chart on Regional Comparison - Middle East and Africa
Data Table on Regional Comparison - Middle East and Africa

11.6.1 Saudi Arabia - Market size and forecast 2024-2029

Chart on Saudi Arabia - Market size and forecast 2024-2029 ($ million)
Data Table on Saudi Arabia - Market size and forecast 2024-2029 ($ million)
Chart on Saudi Arabia - Year-over-year growth 2024-2029 (%)
Data Table on Saudi Arabia - Year-over-year growth 2024-2029 (%)

11.6.2 UAE - Market size and forecast 2024-2029

Chart on UAE - Market size and forecast 2024-2029 ($ million)
Data Table on UAE - Market size and forecast 2024-2029 ($ million)
Chart on UAE - Year-over-year growth 2024-2029 (%)
Data Table on UAE - Year-over-year growth 2024-2029 (%)

11.7 South America - Market size and forecast 2024-2029

Chart on South America - Market size and forecast 2024-2029 ($ million)
Data Table on South America - Market size and forecast 2024-2029 ($ million)
Chart on South America - Year-over-year growth 2024-2029 (%)
Data Table on South America - Year-over-year growth 2024-2029 (%)
Chart on Regional Comparison - South America
Data Table on Regional Comparison - South America

11.7.1 Brazil - Market size and forecast 2024-2029

Chart on Brazil - Market size and forecast 2024-2029 ($ million)
Data Table on Brazil - Market size and forecast 2024-2029 ($ million)
Chart on Brazil - Year-over-year growth 2024-2029 (%)
Data Table on Brazil - Year-over-year growth 2024-2029 (%)

11.7.2 Argentina - Market size and forecast 2024-2029

Chart on Argentina - Market size and forecast 2024-2029 ($ million)
Data Table on Argentina - Market size and forecast 2024-2029 ($ million)
Chart on Argentina - Year-over-year growth 2024-2029 (%)
Data Table on Argentina - Year-over-year growth 2024-2029 (%)

11.8 Market opportunity by geography

Market opportunity by geography ($ million)
Data Tables on Market opportunity by geography ($ million)

12. Drivers, Challenges, and Opportunity

12.1 Market drivers

Imperative for enhanced operational efficiency and cost reduction
Escalating focus on environmental, social, and governance (ESG) compliance and safety
Proliferation of big data and advancement of cloud computing infrastructure

12.2 Market challenges

Pervasive data management and integration issues
Significant upfront investment and ambiguous return on investment
Critical talent shortage and organizational change management

12.3 Impact of drivers and challenges

Impact of drivers and challenges in 2024 and 2029

12.4 Market opportunities

Emergence of generative AI and large language models for knowledge management
Hyper-automation and progression towards fully autonomous operations
Proliferation of edge AI for real-time decision making in remote environments

13. Competitive Landscape

13.1 Overview

13.2

Overview on criticality of inputs and factors of differentiation

13.3 Landscape disruption

Overview on factors of disruption

13.4 Industry risks

Impact of key risks on business

14. Competitive Analysis

14.1 Companies profiled

Companies covered

14.2 Company ranking index

14.3 Market positioning of companies

Matrix on companies position and classification

14.4 ABB Ltd.

ABB Ltd. - Overview
ABB Ltd. - Business segments
ABB Ltd. - Key news
ABB Ltd. - Key offerings
ABB Ltd. - Segment focus
SWOT

14.5 Accenture PLC

Accenture PLC - Overview
Accenture PLC - Business segments
Accenture PLC - Key news
Accenture PLC - Key offerings
Accenture PLC - Segment focus
SWOT

14.6 Baker Hughes Co.

Baker Hughes Co. - Overview
Baker Hughes Co. - Business segments
Baker Hughes Co. - Key news
Baker Hughes Co. - Key offerings
Baker Hughes Co. - Segment focus
SWOT

14.7 BP Plc

BP Plc - Overview
BP Plc - Business segments
BP Plc - Key news
BP Plc - Key offerings
BP Plc - Segment focus
SWOT

14.8 C3.ai Inc.

C3.ai Inc. - Overview
C3.ai Inc. - Product / Service
C3.ai Inc. - Key news
C3.ai Inc. - Key offerings
SWOT

14.9 Exxon Mobil Corp.

Exxon Mobil Corp. - Overview
Exxon Mobil Corp. - Business segments
Exxon Mobil Corp. - Key news
Exxon Mobil Corp. - Key offerings
Exxon Mobil Corp. - Segment focus
SWOT

14.10 Google LLC

Google LLC - Overview
Google LLC - Product / Service
Google LLC - Key offerings
SWOT

14.11 Halliburton Co.

Halliburton Co. - Overview
Halliburton Co. - Business segments
Halliburton Co. - Key news
Halliburton Co. - Key offerings
Halliburton Co. - Segment focus
SWOT

14.12 IBM Corp.

IBM Corp. - Overview
IBM Corp. - Business segments
IBM Corp. - Key news
IBM Corp. - Key offerings
IBM Corp. - Segment focus
SWOT

14.13 Microsoft Corp.

Microsoft Corp. - Overview
Microsoft Corp. - Business segments
Microsoft Corp. - Key news
Microsoft Corp. - Key offerings
Microsoft Corp. - Segment focus
SWOT

14.14 Oracle Corp.

Oracle Corp. - Overview
Oracle Corp. - Business segments
Oracle Corp. - Key news
Oracle Corp. - Key offerings
Oracle Corp. - Segment focus
SWOT

14.15 Saudi Arabian Oil Co.

Saudi Arabian Oil Co. - Overview
Saudi Arabian Oil Co. - Product / Service
Saudi Arabian Oil Co. - Key offerings
SWOT

14.16 Schlumberger Ltd.

Schlumberger Ltd. - Overview
Schlumberger Ltd. - Business segments
Schlumberger Ltd. - Key news
Schlumberger Ltd. - Key offerings
Schlumberger Ltd. - Segment focus
SWOT

14.17 Shell plc

Shell plc - Overview
Shell plc - Business segments
Shell plc - Key news
Shell plc - Key offerings
Shell plc - Segment focus
SWOT

14.18 Siemens AG

Siemens AG - Overview
Siemens AG - Business segments
Siemens AG - Key news
Siemens AG - Key offerings
Siemens AG - Segment focus
SWOT

15. Appendix

15.1 Scope of the report

Market definition
Objectives
Notes and caveats

15.2 Inclusions and exclusions checklist

Inclusions checklist
Exclusions checklist

15.3 Currency conversion rates for US$

15.4 Research methodology

15.5 Data procurement

Information sources

15.6 Data validation

15.7 Validation techniques employed for market sizing

15.8 Data synthesis

15.9 360 degree market analysis

15.10 List of abbreviations

Research Methodology

Technavio presents a detailed picture of the market by way of study, synthesis, and summation of data from multiple sources. The analysts have presented the various facets of the market with a particular focus on identifying the key industry influencers. The data thus presented is comprehensive, reliable, and the result of extensive research, both primary and secondary.

INFORMATION SOURCES

Primary sources

  • Manufacturers and suppliers
  • Channel partners
  • Industry experts
  • Strategic decision makers

Secondary sources

  • Industry journals and periodicals
  • Government data
  • Financial reports of key industry players
  • Historical data
  • Press releases

DATA ANALYSIS

Data Synthesis

  • Collation of data
  • Estimation of key figures
  • Analysis of derived insights

Data Validation

  • Triangulation with data models
  • Reference against proprietary databases
  • Corroboration with industry experts

REPORT WRITING

Qualitative

  • Market drivers
  • Market challenges
  • Market trends
  • Five forces analysis

Quantitative

  • Market size and forecast
  • Market segmentation
  • Geographical insights
  • Competitive landscape

Interested in this report?

Get your sample now to see our research methodology and insights!

Download Now

Frequently Asked Questions

AI And ML In Oil And Gas market growth will increase by USD 5912.6 million during 2025-2029.

The AI And ML In Oil And Gas market is expected to grow at a CAGR of 15.1% during 2025-2029.

AI And ML In Oil And Gas market is segmented by Component (Solutions, Services) Application (Predictive maintenance, Production optimization, Supply chain and logistics, Exploration and drilling, Others) End-user (Downstream, Upstream, Midstream)

ABB Ltd., Accenture PLC, Baker Hughes Co., Beyond Limits, BP Plc, C3.ai Inc., Exxon Mobil Corp., Google LLC, Halliburton Co., IBM Corp., Microsoft Corp., Oracle Corp., Saudi Arabian Oil Co., Schlumberger Ltd., SensorUp Inc., Shell plc, Siemens AG, SparkCognition Inc., TechnipFMC plc are a few of the key vendors in the AI And ML In Oil And Gas market.

APAC will register the highest growth rate of 29.6% among the other regions. Therefore, the AI And ML In Oil And Gas market in APAC is expected to garner significant business opportunities for the vendors during the forecast period.

US, Canada, Russia, Germany, UK, France, China, India, Japan, South Korea, Australia, Saudi Arabia, UAE, Brazil, Argentina

  • Imperative for enhanced operational efficiency and cost reduction is the driving factor this market.

The AI And ML In Oil And Gas market vendors should focus on grabbing business opportunities from the Component segment as it accounted for the largest market share in the base year.