
AI And RAN Traffic Optimization Market Size 2025-2029
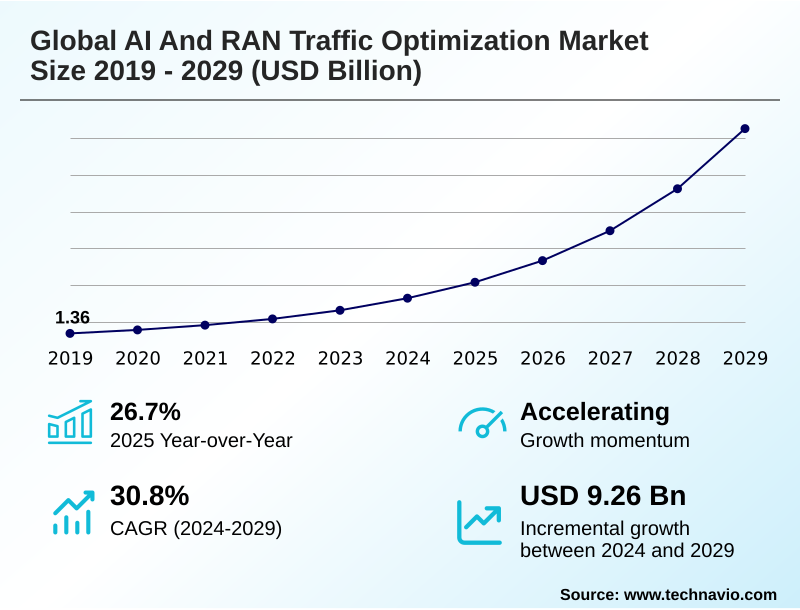
The ai and ran traffic optimization market size is valued to increase by USD 9.26 billion, at a CAGR of 30.8% from 2024 to 2029. Escalating network complexity with 5G and evolution towards 6G will drive the ai and ran traffic optimization market.
Major Market Trends & Insights
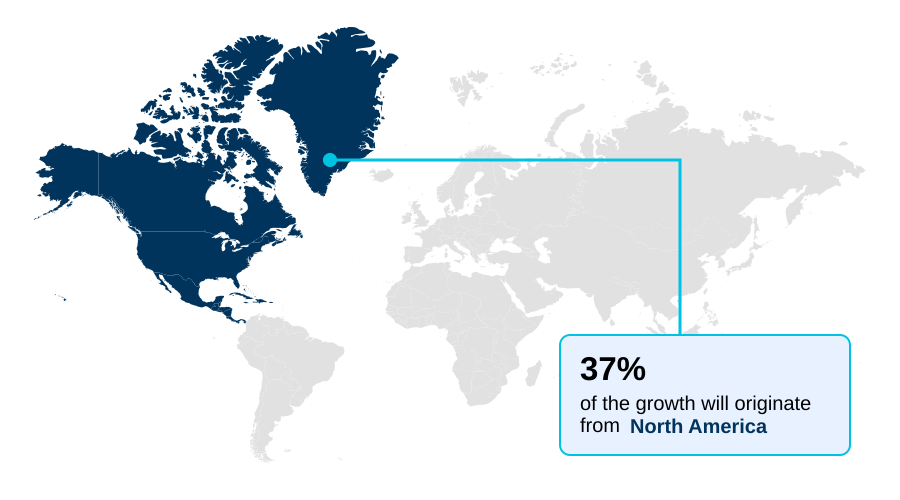
- North America dominated the market and accounted for a 36.7% growth during the forecast period.
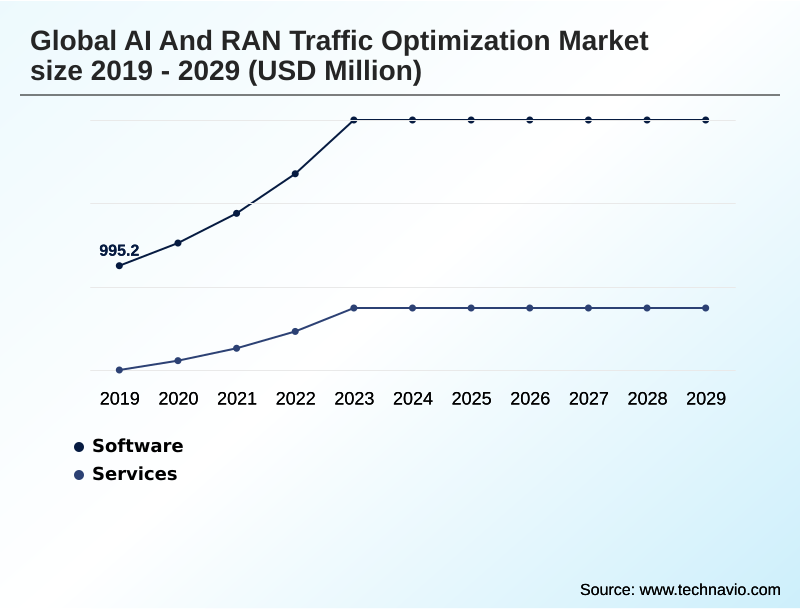
- By Component - Software segment was valued at USD 1.88 billion in 2023
- By End-user - Telecom service providers segment accounted for the largest market revenue share in 2023
Market Size & Forecast
- Market Opportunities: USD 11.18 billion
- Market Future Opportunities: USD 9.26 billion
- CAGR from 2024 to 2029 : 30.8%
Market Summary
- The AI and RAN traffic optimization market is fundamentally reshaping telecommunications infrastructure by embedding intelligence directly into network operations. This transition is driven by the operational necessity to manage the immense complexity of 5G and future networks, which feature technologies like massive MIMO and dynamic spectrum sharing that are beyond the scope of manual control.
- Key trends include the use of generative AI to create self-healing networks capable of automated root cause analysis and the intense focus on AI-driven energy savings to reduce significant operational expenditures. For instance, an operator can deploy AI to predict traffic lulls and autonomously power down network components, reducing energy costs without affecting service quality.
- The emergence of the Open RAN ecosystem, with its RAN Intelligent Controller (RIC), creates a new marketplace for specialized AI applications (xApps and rApps) from a diverse set of vendors. However, the market faces challenges related to data complexity, with operators struggling to build clean, high-quality data pipelines for training AI models.
- System integration in multi-vendor environments and the high initial investment required for AI infrastructure also present significant hurdles to widespread adoption.
What will be the Size of the AI And RAN Traffic Optimization Market during the forecast period?
Get Key Insights on Market Forecast (PDF) Get Free Sample
How is the AI And RAN Traffic Optimization Market Segmented?
The ai and ran traffic optimization industry research report provides comprehensive data (region-wise segment analysis), with forecasts and estimates in "USD million" for the period 2025-2029, as well as historical data from 2019-2023 for the following segments.
- Component
- Software
- Services
- End-user
- Telecom service providers
- Enterprise 5G users
- Equipment companies
- System integrators
- Deployment
- Cloud-based
- On-premises
- Geography
- North America
- US
- Canada
- Europe
- Germany
- UK
- France
- APAC
- China
- India
- Japan
- South America
- Brazil
- Argentina
- Colombia
- Middle East and Africa
- UAE
- Saudi Arabia
- Rest of World (ROW)
- North America
By Component Insights
The software segment is estimated to witness significant growth during the forecast period.
The software segment is the core intelligence layer, driving innovation through algorithms and applications that enable software-defined RAN control.
This includes platforms for the RAN intelligent controller, which hosts a growing AI application marketplace of xApps and rApps for specific tasks. Key functionalities focus on achieving significant network OPEX reduction through intelligent power management and advanced automation.
For example, solutions targeting AI-driven energy savings can reduce site power usage by up to 15% without impacting user experience.
Other critical software capabilities include dynamic vRAN resource management and sophisticated network slicing automation, which are essential for delivering differentiated services and meeting stringent performance guarantees in 5G environments. This innovation is transforming network operations from reactive to proactive.
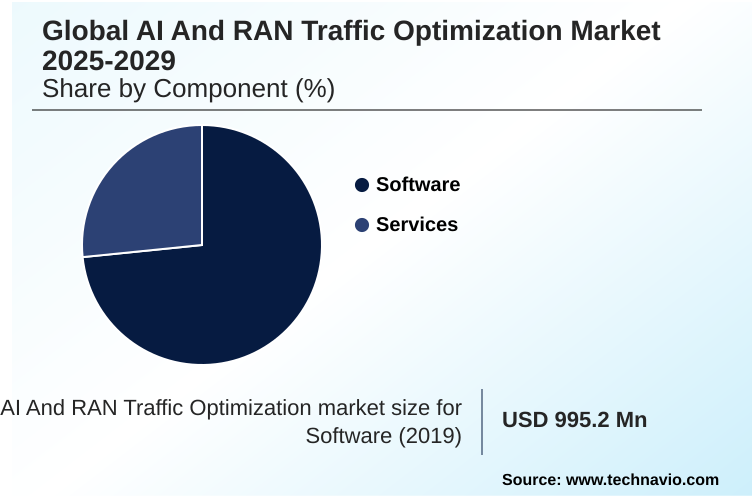
The Software segment was valued at USD 1.88 billion in 2023 and showed a gradual increase during the forecast period.
Regional Analysis
North America is estimated to contribute 36.7% to the growth of the global market during the forecast period.Technavio’s analysts have elaborately explained the regional trends and drivers that shape the market during the forecast period.
See How AI And RAN Traffic Optimization Market Demand is Rising in North America Get Free Sample
The global landscape is varied, with North America and parts of APAC leading in the deployment of zero-touch network concepts.
Operators in these regions leverage both the non-real-time RIC for planning and the near-real-time RIC for dynamic control, deploying RAN intelligent agents to manage operations.
A key focus is on AI-powered spectrum efficiency, with trials in Europe showing that advanced interference mitigation algorithms can boost capacity in dense areas by 18%.
In developing markets across South America and Africa, the focus is more on operational efficiency, using AI for predictive maintenance scheduling. The move toward network function virtualization is a global enabler, creating a common platform for these AI-driven optimizations.
Market Dynamics
Our researchers analyzed the data with 2024 as the base year, along with the key drivers, trends, and challenges. A holistic analysis of drivers will help companies refine their marketing strategies to gain a competitive advantage.
- Achieving superior network performance now hinges on the strategic implementation of AI. The process of optimizing massive MIMO with AI and reducing RAN energy consumption AI are no longer theoretical concepts but critical business objectives.
- Operators are focused on AI-driven network slice management to guarantee quality of service for diverse enterprise use cases, particularly in AI for private 5G network optimization. The use of generative AI in network operations is transforming the Network Operations Center by automating RAN configuration with AI and enabling predictive analytics for RAN performance.
- A key component is the RIC xApp for traffic steering, which works in concert with a robust AI model for network congestion to manage traffic flow dynamically. Further efficiencies are gained through AI powered spectrum sharing techniques. The challenge of managing multi-vendor Open RAN environments is being addressed through advanced closed-loop RAN performance tuning and zero touch RAN deployment automation.
- Central to this is ensuring the security for AI in telecommunications. The real-time beamforming AI algorithm is vital for improving QoE with predictive AI. This requires careful consideration of the AI workload on RAN hardware and scaling vRAN with AI orchestration.
- The entire system relies on training AI models with RAN data to perform tasks like anomaly detection for cell outages, with initial results showing that automated systems can identify precursor events twice as fast as manual analysis, significantly reducing the impact of potential service disruptions.
What are the key market drivers leading to the rise in the adoption of AI And RAN Traffic Optimization Industry?
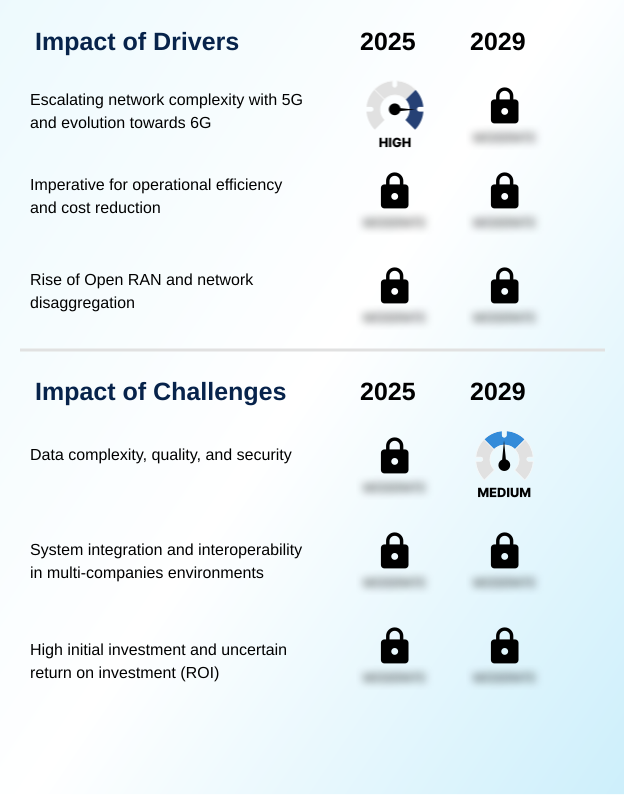
- The escalating network complexity associated with 5G deployment and the evolution toward 6G is a key driver for the market.
- The market is driven by 5G advanced network complexity, which makes manual optimization untenable. The rise of the open RAN ecosystem fosters innovation but demands solutions that ensure multi-vendor interoperability.
- Technologies like dynamic spectrum sharing and massive MIMO optimization require sophisticated AI for effective radio resource management. AI enables real-time traffic steering and dynamic beamforming pattern adjustment to support latency-sensitive applications with guaranteed performance.
- For instance, intelligent traffic management can improve spectral efficiency by up to 30% in dense urban deployments. This operational necessity positions AI as the fundamental control plane for next-generation networks.
What are the market trends shaping the AI And RAN Traffic Optimization Industry?
- The integration of generative AI is an emerging trend, enabling a shift toward more proactive and autonomous network operations. This evolution moves beyond predictive analytics to automated problem resolution.
- A key trend is the move toward an AI-native network architecture that supports fully autonomous network operations. This involves leveraging generative AI for NOC (Network Operations Center) environments to perform automated root cause analysis, which has been shown to accelerate issue resolution by over 40%.
- The goal is a state of closed-loop automation where proactive network optimization occurs without human intervention. By using a network digital twin, operators can simulate changes and predict outcomes, ensuring high predictive quality of experience. This focus on quality of experience management allows for the pre-emptive resolution of issues before they affect subscribers, representing a significant shift in operational strategy.
What challenges does the AI And RAN Traffic Optimization Industry face during its growth?
- The complexity, quality, and security of network data represent a key challenge affecting industry growth.
- A primary challenge is managing the complexity of the AI model training pipeline, which requires vast amounts of clean RAN telemetry data for accurate traffic pattern analysis and data-driven network planning. Deploying carrier-grade AI solutions that can perform reliable anomaly detection in RAN is non-trivial. Furthermore, executing low-latency AI inference at the edge demands significant compute resources, adding to costs.
- While self-organizing networks have existed, their capabilities are insufficient for modern demands. Integration in a hybrid cloud AI deployment model also introduces security and data governance hurdles, with initial integration testing showing that misconfigured data pipelines can increase processing overhead by 25%.
Exclusive Technavio Analysis on Customer Landscape
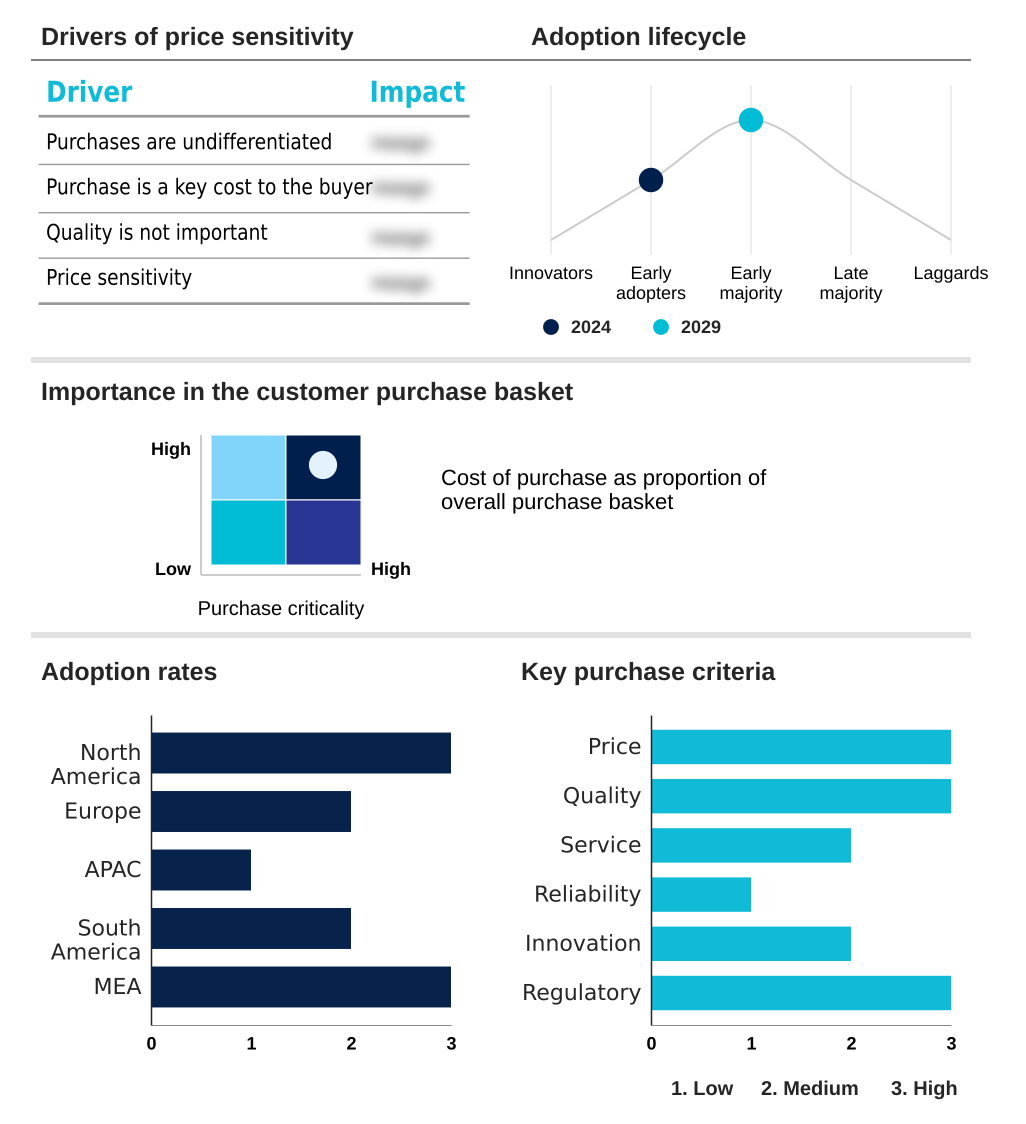
The ai and ran traffic optimization market forecasting report includes the adoption lifecycle of the market, covering from the innovator’s stage to the laggard’s stage. It focuses on adoption rates in different regions based on penetration. Furthermore, the ai and ran traffic optimization market report also includes key purchase criteria and drivers of price sensitivity to help companies evaluate and develop their market growth analysis strategies.
Customer Landscape of AI And RAN Traffic Optimization Industry
Competitive Landscape
Companies are implementing various strategies, such as strategic alliances, ai and ran traffic optimization market forecast, partnerships, mergers and acquisitions, geographical expansion, and product/service launches, to enhance their presence in the industry.
AirHop Communications Inc. - Offers AI-powered RAN automation and optimization via xApps and rApps for Open RAN, enhancing 4G and 5G network performance and efficiency.
The industry research and growth report includes detailed analyses of the competitive landscape of the market and information about key companies, including:
- AirHop Communications Inc.
- Amdocs Ltd.
- Cisco Systems Inc.
- Cohere Technologies
- Huawei Technologies Co. Ltd.
- Infovista SAS
- Intel Corp.
- Juniper Networks Inc.
- Mavenir Systems Inc.
- NEC Corp.
- Nokia Corp.
- Qualcomm Inc.
- Radisys Corp.
- RIMEDO
- Samsung Electronics Co. Ltd.
- Telefonaktiebolaget Ericsson
- Teoco
- ZTE Corp.
Qualitative and quantitative analysis of companies has been conducted to help clients understand the wider business environment as well as the strengths and weaknesses of key industry players. Data is qualitatively analyzed to categorize companies as pure play, category-focused, industry-focused, and diversified; it is quantitatively analyzed to categorize companies as dominant, leading, strong, tentative, and weak.
Recent Development and News in Ai and ran traffic optimization market
- In March 2025, Cohere Technologies announced the successful field testing of its AI-powered Universal Spectrum Multiplier software, an Open RAN application proven to enhance network capacity.
- In February 2025, Amdocs partnered with Google Cloud to launch a Network AIOps solution aimed at automating network operations for service providers.
- In November 2024, a major European operator expanded its trial of generative AI for network management, aiming to use large language models to automate root cause analysis for network faults.
- In September 2024, a leading equipment vendor released a new software upgrade integrating real-time AI traffic prediction directly into its RAN Compute architecture, enhancing 5G coverage without new hardware.
Dive into Technavio’s robust research methodology, blending expert interviews, extensive data synthesis, and validated models for unparalleled AI And RAN Traffic Optimization Market insights. See full methodology.
| Market Scope | |
|---|---|
| Page number | 269 |
| Base year | 2024 |
| Historic period | 2019-2023 |
| Forecast period | 2025-2029 |
| Growth momentum & CAGR | Accelerate at a CAGR of 30.8% |
| Market growth 2025-2029 | USD 9257.3 million |
| Market structure | Fragmented |
| YoY growth 2024-2025(%) | 26.7% |
| Key countries | US, Canada, Germany, UK, France, China, India, Japan, South Korea, Brazil, Argentina, Colombia, UAE and Saudi Arabia |
| Competitive landscape | Leading Companies, Market Positioning of Companies, Competitive Strategies, and Industry Risks |
Research Analyst Overview
- The market's evolution is centered on the RAN intelligent controller, which serves as the brain for the next-generation zero-touch network. This platform, comprising both a near-real-time RIC and a non-real-time RIC, enables closed-loop automation through a vibrant ecosystem of xApps and rApps.
- Boardroom decisions are increasingly focused on leveraging this AI-native network architecture for strategic advantage, particularly in the realm of AI-driven energy savings, which directly impacts sustainability reporting and operational margins. The technology facilitates advanced capabilities like massive MIMO optimization and network slicing automation.
- For example, deployments have shown that AI-powered spectrum efficiency can increase network capacity by up to 25%, delaying costly infrastructure upgrades. This requires a robust AI model training pipeline using rich RAN telemetry to enable real-time traffic steering and predictive quality of experience, which are crucial for maintaining a competitive edge.
What are the Key Data Covered in this AI And RAN Traffic Optimization Market Research and Growth Report?
-
What is the expected growth of the AI And RAN Traffic Optimization Market between 2025 and 2029?
-
USD 9.26 billion, at a CAGR of 30.8%
-
-
What segmentation does the market report cover?
-
The report is segmented by Component (Software, and Services), End-user (Telecom service providers, Enterprise 5G users, Equipment companies, and System integrators), Deployment (Cloud-based, and On-premises) and Geography (North America, Europe, APAC, South America, Middle East and Africa)
-
-
Which regions are analyzed in the report?
-
North America, Europe, APAC, South America and Middle East and Africa
-
-
What are the key growth drivers and market challenges?
-
Escalating network complexity with 5G and evolution towards 6G, Data complexity, quality, and security
-
-
Who are the major players in the AI And RAN Traffic Optimization Market?
-
AirHop Communications Inc., Amdocs Ltd., Cisco Systems Inc., Cohere Technologies, Huawei Technologies Co. Ltd., Infovista SAS, Intel Corp., Juniper Networks Inc., Mavenir Systems Inc., NEC Corp., Nokia Corp., Qualcomm Inc., Radisys Corp., RIMEDO, Samsung Electronics Co. Ltd., Telefonaktiebolaget Ericsson, Teoco and ZTE Corp.
-
Market Research Insights
- The move toward autonomous network operations is accelerating, driven by the need for network OPEX reduction and improved efficiency. Carrier-grade AI solutions are enabling proactive network optimization through advanced traffic pattern analysis and automated root cause analysis. This data-driven approach has demonstrated a reduction in network downtime by over 30% in early deployments.
- Furthermore, intelligent power management systems have lowered energy consumption at cell sites by up to 15%, directly impacting profitability. The adoption of an open RAN ecosystem further fuels this dynamic, creating a competitive AI application marketplace. This shift toward software-defined RAN control is essential for managing 5G advanced network complexity and supporting new latency-sensitive applications.
We can help! Our analysts can customize this ai and ran traffic optimization market research report to meet your requirements.
 RIA -
RIA - 
