AI Based 3D Vision System Market Analysis, Size, and Forecast 2025-2029: North America (US, Canada, and Mexico), APAC (China, Japan, and South Korea), Europe (Germany, UK, and France), South America (Brazil, Argentina, and Colombia), Middle East and Africa (UAE, Saudi Arabia, and Israel), and Rest of World (ROW)

AI Based 3D Vision System Market Analysis, Size, and Forecast 2025-2029:
North America (US, Canada, and Mexico), APAC (China, Japan, and South Korea), Europe (Germany, UK, and France), South America (Brazil, Argentina, and Colombia), Middle East and Africa (UAE, Saudi Arabia, and Israel), and Rest of World (ROW)

Published: Dec 2025 296 Pages SKU: IRTNTR81000

Market Overview at a Glance

$589.98 Mn
Market Opportunity
22.8%
CAGR 2024 - 2029
33.1%
North America Growth
$186.84 Mn
Hardware segment 2023

AI Based 3D Vision System Market Size 2025-2029

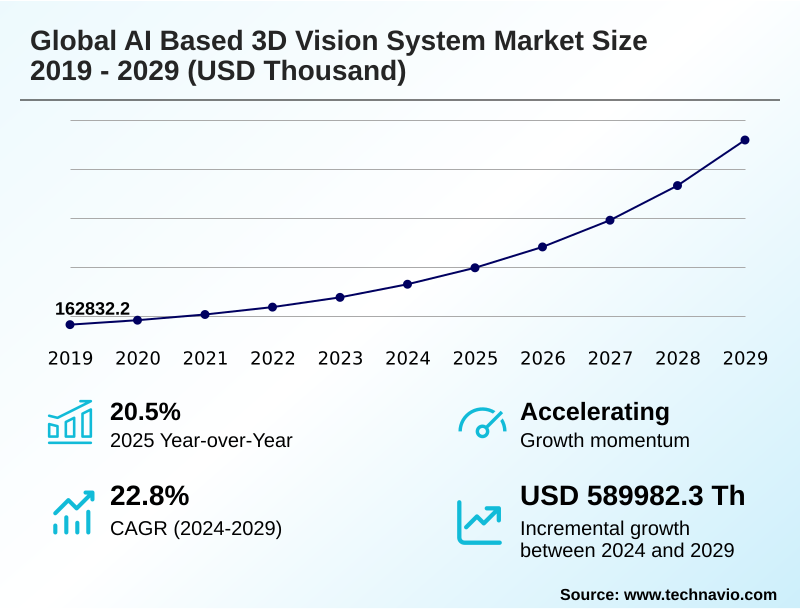
The ai based 3d vision system market size is valued to increase by USD 589.98 million, at a CAGR of 22.8% from 2024 to 2029. Rising imperative for automation and enhanced quality control across industries will drive the ai based 3d vision system market.

Major Market Trends & Insights

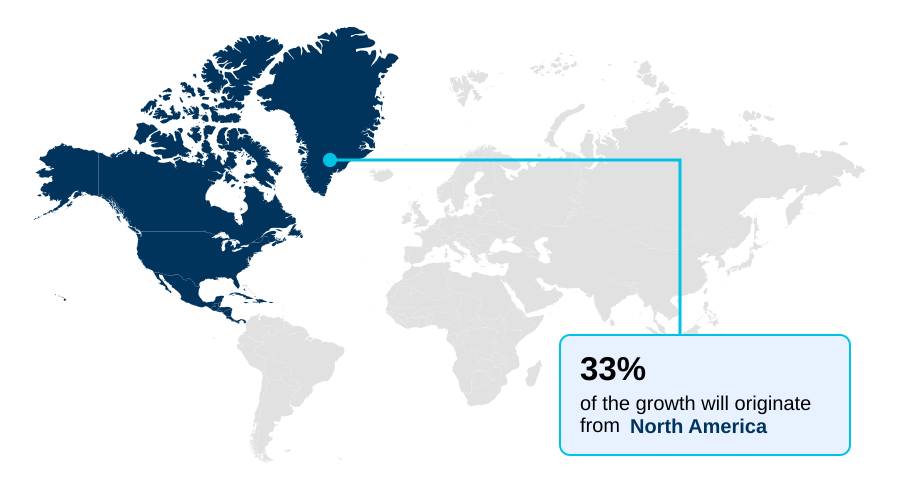
  • North America dominated the market and accounted for a 33.1% growth during the forecast period.
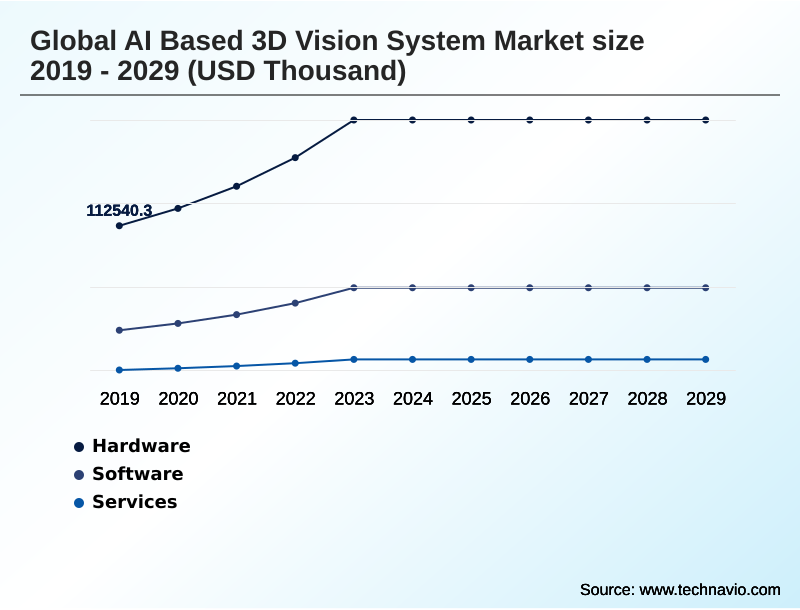
  • By Component - Hardware segment was valued at USD 186.84 million in 2023
  • By Type - PC based segment accounted for the largest market revenue share in 2023

Market Size & Forecast

  • Market Opportunities:
  • Market Future Opportunities: USD 589.98 million
  • CAGR from 2024 to 2029 : 22.8%

Market Summary

  • The AI based 3D vision system market is defined by the integration of advanced 3d imaging technologies with powerful artificial intelligence to grant machines sophisticated visual perception. This synergy enables systems to move beyond simple 2D analysis, utilizing technologies like stereo vision and structured light scanners to interpret depth and volume for complex tasks.
  • Key market drivers include the push for Industry 4.0 automation and superior quality assurance in manufacturing. A key trend is the convergence of AI with edge computing, allowing for real-time processing and decision-making directly on devices.
  • For instance, in a smart factory environment, an assembly line robot uses an embedded vision system for real-time robotic guidance, instantly detecting and adjusting for misaligned components, thereby preventing defects without halting production. This capability relies on sophisticated computer vision and deep learning models to perform dimensional measurement and automated inspection with high precision.
  • However, challenges such as high implementation costs, the need for skilled personnel, and concerns over data privacy temper the pace of adoption. The market's evolution is geared towards more accessible, powerful, and integrated solutions that address these operational hurdles, expanding applications into sectors like logistics and healthcare.

What will be the Size of the AI Based 3D Vision System Market during the forecast period?

Get Key Insights on Market Forecast (PDF) Request Free Sample

How is the AI Based 3D Vision System Market Segmented?

The ai based 3d vision system industry research report provides comprehensive data (region-wise segment analysis), with forecasts and estimates in "USD thousand" for the period 2025-2029, as well as historical data from 2019-2023 for the following segments.

  • Component
    • Hardware
    • Software
    • Services
  • Type
    • PC based
    • Smart camera based
    • Others
  • Application
    • Quality assurance and inspection
    • Positioning and guidance
    • Measurement
  • Geography
    • North America
      • US
      • Canada
      • Mexico
    • APAC
      • China
      • Japan
      • South Korea
    • Europe
      • Germany
      • UK
      • France
    • South America
      • Brazil
      • Argentina
      • Colombia
    • Middle East and Africa
      • UAE
      • Saudi Arabia
      • Israel
    • Rest of World (ROW)

By Component Insights

The hardware segment is estimated to witness significant growth during the forecast period.

The hardware segment, encompassing high-resolution cameras, graphic processing units, and specialized sensor fusion technologies, forms the essential physical foundation for the market.

Continuous innovation in hardware is a primary engine of market expansion, with advancements in time-of-flight sensors and structured light scanners making 3d imaging technologies more accessible.

A pivotal trend is the integration of AI with edge computing, which allows for real-time processing of point clouds directly on devices. This powerful combination is critical for applications demanding instantaneous decision-making, such as robotic guidance in manufacturing.

By localizing data processing, these systems can reduce data transmission needs by over 90%, enhancing both speed and cybersecurity for critical infrastructure. This supports complex tasks like dimensional measurement and quality assurance.

Request Free Sample

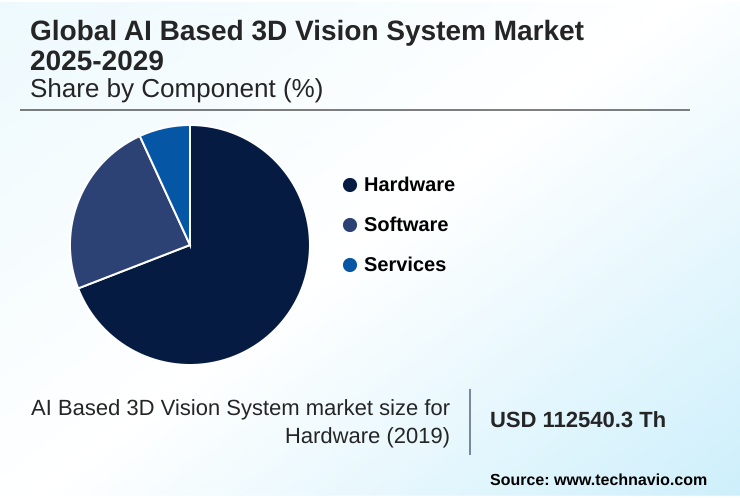
The Hardware segment was valued at USD 186.84 million in 2023 and showed a gradual increase during the forecast period.

Request Free Sample

Regional Analysis

North America is estimated to contribute 33.1% to the growth of the global market during the forecast period.Technavio’s analysts have elaborately explained the regional trends and drivers that shape the market during the forecast period.

See How AI Based 3D Vision System Market Demand is Rising in North America Request Free Sample

The geographic landscape of the AI based 3D vision system market is shaped by regional industrial strengths and strategic technology investments.

North America leads, contributing over 33% of the market's incremental growth, driven by its advanced manufacturing and logistics sectors' demand for robotic automation solutions and process automation. The region is a hub for innovation in neural networks and software platforms.

APAC is the largest market, characterized by government-led smart manufacturing initiatives and a massive electronics production base, fostering rapid adoption of automated inspection and quality control systems.

In Europe, the focus on Industry 4.0 principles fuels demand for systems that improve operational efficiency; implementations can reduce production line downtime by up to 20%.

Both regions heavily leverage vision intelligence platforms and machine learning algorithms to maintain a competitive edge through enhanced visual perception and predictive maintenance.

Market Dynamics

Our researchers analyzed the data with 2024 as the base year, along with the key drivers, trends, and challenges. A holistic analysis of drivers will help companies refine their marketing strategies to gain a competitive advantage.

  • The strategic implementation of AI based 3D vision systems is reshaping industrial operations, with a strong focus on specialized applications. The use of deep learning for automated inspection is becoming a standard in high-precision manufacturing, where machine vision systems for defect detection can identify microscopic flaws that are invisible to the human eye.
  • In the logistics sector, the adoption of AI based 3D vision for logistics is crucial for enabling computer vision for warehouse automation, allowing robots to perform complex bin-picking tasks with high accuracy.
  • The trend towards ai vision systems with edge computing addresses latency issues, which is critical for ai for real time robotic guidance on fast-moving production lines and in ai vision in autonomous vehicle navigation. The development of generative AI for 3d model generation is further expanding capabilities, allowing for rapid digital twin creation.
  • As industries advance, the demand for ai powered predictive analytics in manufacturing grows, leveraging data from vision systems to prevent equipment failure. Applications are also expanding into healthcare with ai algorithms for 3d medical imaging and ai based vision for surgical navigation.
  • However, challenges persist, including the complexity of integrating ai vision with legacy equipment and ensuring data security in cloud based vision systems. The industry is also tackling the need for a skilled workforce for AI vision deployment, addressing everything from the nuances of ai vision for driver monitoring systems to the detailed cost analysis of AI 3d vision systems.
  • The use of time of flight sensors for robotics and structured light scanning for quality control is becoming more widespread, even in areas like ai vision for food and beverage processing, where solutions that are more than twice as efficient as manual methods are being deployed.

What are the key market drivers leading to the rise in the adoption of AI Based 3D Vision System Industry?

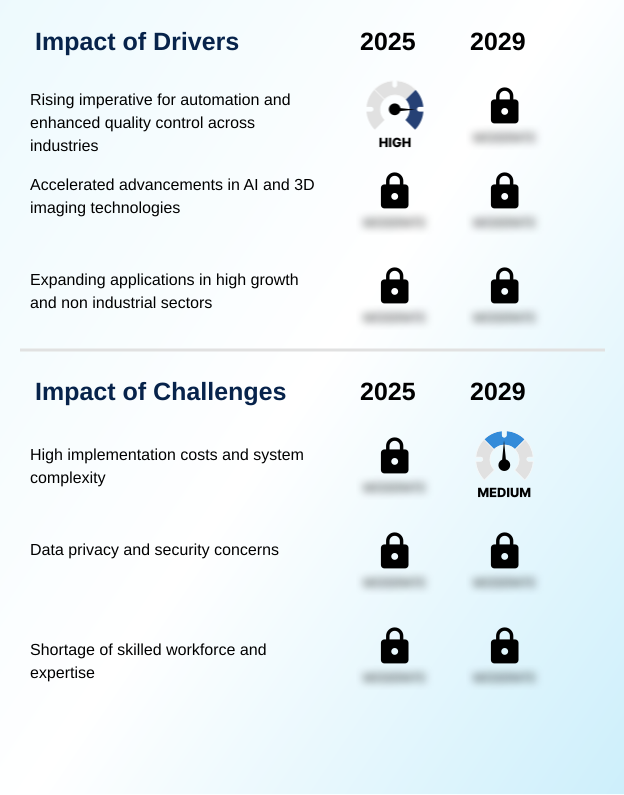
  • The rising imperative for enhanced quality control and widespread automation across industries serves as the primary driver for market growth.

  • Market growth is fundamentally driven by the industrial imperative for higher efficiency and quality.
  • The integration of robotic guidance systems powered by 3d imaging technologies and neural networks is automating complex tasks, leading to scrap rate reductions of up to 15% in high-volume manufacturing.
  • Accelerated advancements in AI and 3D imaging are making real-time processing more accessible, allowing for immediate quality assurance checks on production lines.
  • In the logistics sector, the use of AI-powered robotic bin picking and sorting is improving order fulfillment accuracy to over 99.9%.
  • The expansion into non-industrial sectors like healthcare is also significant, with medical imaging and surgical navigation benefiting from the precision offered by these technologies, enabling better patient outcomes. These drivers reflect a broad-based demand for enhanced visual perception across industries.

What are the market trends shaping the AI Based 3D Vision System Industry?

  • The proliferation of deep learning is revolutionizing automated quality control and inspection processes. This represents a significant upcoming trend, driving superior performance and cognitive capabilities in the market.

  • Market trends are defined by the convergence of intelligent software and powerful hardware, expanding the scope of automated tasks. The proliferation of deep learning is enabling superior object recognition and defect detection, with adoption rates in logistics projected to more than double as firms replace manual processes.
  • This is driven by advanced vision AI platform solutions and the use of large language models to simplify system interaction. A significant trend is the shift toward edge computing, where new system-on-chips (SoCs) enable real-time processing and contextual decision-making directly on devices like autonomous mobile robots.
  • This approach enhances data privacy and supports applications in surgical navigation and augmented reality, where latency is critical. These advancements in computer vision and machine learning algorithms are making systems more intuitive and powerful.

What challenges does the AI Based 3D Vision System Industry face during its growth?

  • High implementation costs combined with inherent system complexity present a key challenge that affects the industry's growth trajectory.

  • Despite strong drivers, market adoption faces significant hurdles related to cost, complexity, and security. The total cost of ownership for an AI vision system can be three to five times the initial hardware price due to expenses for software platforms, system integration, and specialized expertise. This financial barrier is particularly challenging for small and medium-sized enterprises.
  • Furthermore, profound data privacy and cybersecurity concerns arise from the collection of detailed visual data, including biometric information, which can be targets for industrial espionage. Navigating complex regulatory landscapes adds another layer of difficulty.
  • The shortage of a skilled workforce with expertise in computer vision, robotics, and machine learning leads to intense competition for talent, with acquisition costs increasing by over 20% in some regions.

Exclusive Technavio Analysis on Customer Landscape

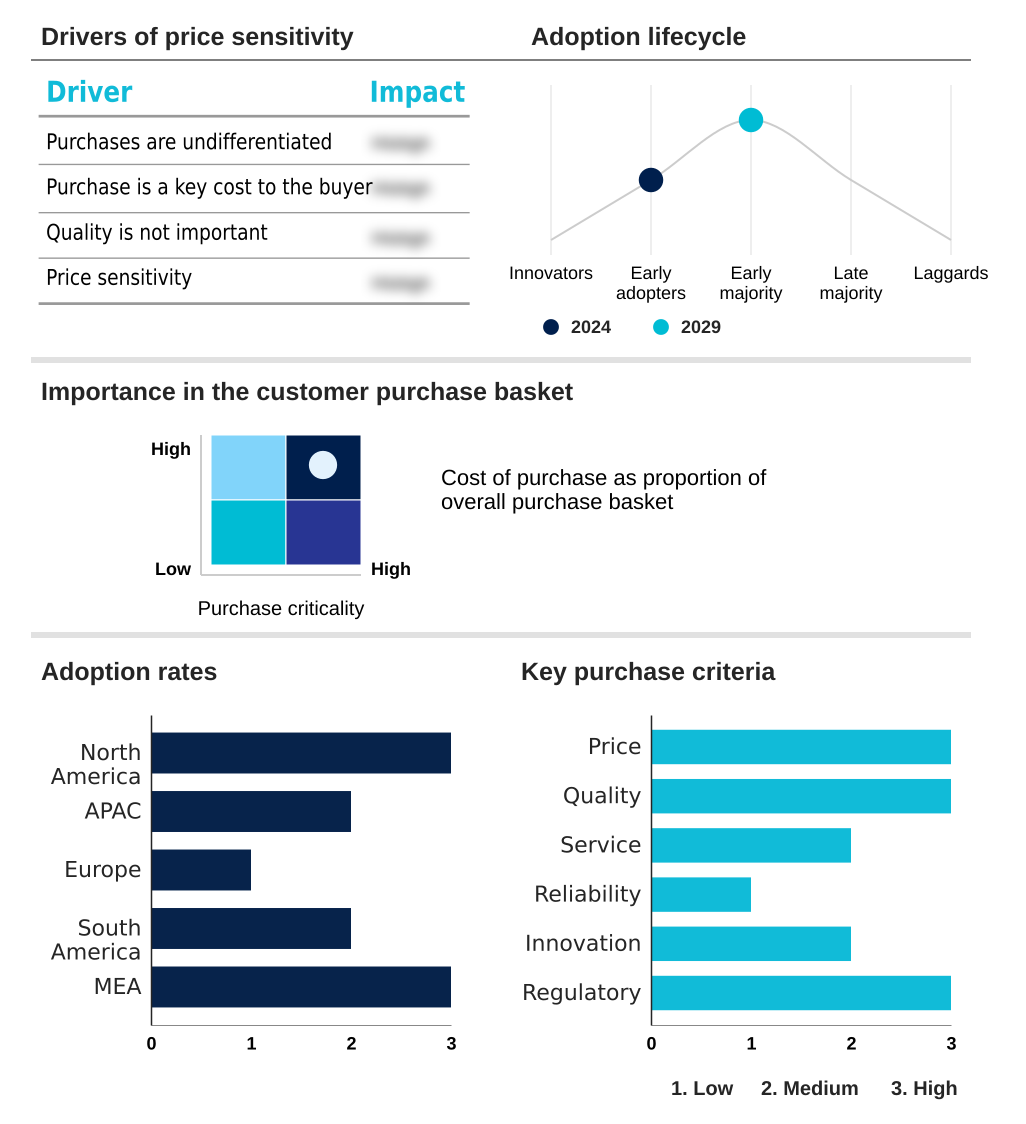
The ai based 3d vision system market forecasting report includes the adoption lifecycle of the market, covering from the innovator’s stage to the laggard’s stage. It focuses on adoption rates in different regions based on penetration. Furthermore, the ai based 3d vision system market report also includes key purchase criteria and drivers of price sensitivity to help companies evaluate and develop their market growth analysis strategies.

Customer Landscape of AI Based 3D Vision System Industry

Competitive Landscape

Companies are implementing various strategies, such as strategic alliances, ai based 3d vision system market forecast, partnerships, mergers and acquisitions, geographical expansion, and product/service launches, to enhance their presence in the industry.

Amazon Web Services Inc. - Cutting-edge robotic automation solutions are delivered through proprietary 4D vision technology and specialized robotic vision software, enabling ultra-fast, precise, and reliable vision-guided tasks for complex operations.

The industry research and growth report includes detailed analyses of the competitive landscape of the market and information about key companies, including:

  • Amazon Web Services Inc.
  • Apera AI
  • AVEVA Group Plc
  • Avnet Inc.
  • Chooch Intelligence Technologies Co.
  • Cognex Corp.
  • Google LLC
  • Intel Corp.
  • IBM Corp.
  • Landing AI
  • Microsoft Corp.
  • NVIDIA Corp.
  • Oracle Corp.
  • Qualcomm Inc.
  • Robovision BV
  • Skyhaus BV
  • STMicroelectronics NV
  • Symphony Innovation LLC

Qualitative and quantitative analysis of companies has been conducted to help clients understand the wider business environment as well as the strengths and weaknesses of key industry players. Data is qualitatively analyzed to categorize companies as pure play, category-focused, industry-focused, and diversified; it is quantitatively analyzed to categorize companies as dominant, leading, strong, tentative, and weak.

Recent Development and News in Ai based 3d vision system market

  • In August 2024, Zebra Technologies Corp. revealed a major upgrade to its Aurora machine vision software, introducing a new suite of AI tools to address complex visual inspection challenges with sophisticated deep learning models.
  • In December 2024, Zivid announced the availability of its Zivid 2+ R-series cameras, specifically engineered to improve robot cycle times in logistics applications, including for historically difficult transparent and shiny objects.
  • In January 2025, Zebra Technologies announced the acquisition of Photoneo, a move designed to strengthen its 3D machine vision capabilities and expand its portfolio for industrial automation in manufacturing and logistics.
  • In February 2025, Fabrica Machinale Srl's Roboticom division showcased its SandRob system, a robotic solution for surface finishing that utilizes an AI-driven vision system and advanced learning algorithms to recognize surface defects and optimize processes.

Dive into Technavio’s robust research methodology, blending expert interviews, extensive data synthesis, and validated models for unparalleled AI Based 3D Vision System Market insights. See full methodology.

Market Scope
Page number 296
Base year 2024
Historic period 2019-2023
Forecast period 2025-2029
Growth momentum & CAGR Accelerate at a CAGR of 22.8%
Market growth 2025-2029 USD 589982.3 thousand
Market structure Fragmented
YoY growth 2024-2025(%) 20.5%
Key countries US, Canada, Mexico, China, Japan, South Korea, India, Australia, Indonesia, Germany, UK, France, Italy, The Netherlands, Spain, Brazil, Argentina, Colombia, UAE, Saudi Arabia, Israel, South Africa and Turkey
Competitive landscape Leading Companies, Market Positioning of Companies, Competitive Strategies, and Industry Risks

Request Free Sample

Research Analyst Overview

  • The market is undergoing a significant transformation driven by the fusion of 3d imaging technologies with sophisticated AI. The core of this evolution lies in the enhanced visual perception and scene comprehension these systems provide for industrial automation.
  • The deployment of deep learning models and neural networks enables unprecedented levels of precision in defect detection and robotic guidance, moving far beyond traditional machine vision capabilities. A critical development fueling this adoption is the dramatic reduction in complexity and time required for system training; the training duration for complex AI models has been reduced from weeks to mere hours.
  • This acceleration is making advanced automated inspection and dimensional measurement accessible to a broader range of applications. Technologies such as stereo vision and time of flight sensors, processed by powerful graphic processing units, are foundational.
  • The market is now focused on optimizing system integration and overcoming challenges related to high initial costs and cybersecurity to unlock the full potential of real-time processing and spatial awareness in manufacturing and beyond.

What are the Key Data Covered in this AI Based 3D Vision System Market Research and Growth Report?

  • What is the expected growth of the AI Based 3D Vision System Market between 2025 and 2029?

    • USD 589.98 million, at a CAGR of 22.8%

  • What segmentation does the market report cover?

    • The report is segmented by Component (Hardware, Software, Services), Type (PC based, Smart camera based, Others), Application (Quality assurance and inspection, Positioning and guidance, Measurement) and Geography (North America, APAC, Europe, South America, Middle East and Africa)

  • Which regions are analyzed in the report?

    • North America, APAC, Europe, South America and Middle East and Africa

  • What are the key growth drivers and market challenges?

    • Rising imperative for automation and enhanced quality control across industries, High implementation costs and system complexity

  • Who are the major players in the AI Based 3D Vision System Market?

    • Amazon Web Services Inc., Apera AI, AVEVA Group Plc, Avnet Inc., Chooch Intelligence Technologies Co., Cognex Corp., Google LLC, Intel Corp., IBM Corp., Landing AI, Microsoft Corp., NVIDIA Corp., Oracle Corp., Qualcomm Inc., Robovision BV, Skyhaus BV, STMicroelectronics NV and Symphony Innovation LLC

Market Research Insights

  • The market is characterized by a dynamic interplay of advanced hardware and intelligent software, driving significant efficiency gains across industries. The adoption of AI-enabled vision systems in warehouse operations has surged, with projections indicating usage will more than double as companies replace traditional scanning methods.
  • This shift is enabled by robust robotic automation solutions and sophisticated vision AI assistant platforms that deliver contextual decision-making. These systems leverage multi-camera edge AI and advanced vision intelligence platforms to achieve operational excellence. For instance, manufacturers are reporting defect detection accuracy rates exceeding 99.5%, a substantial improvement over manual inspection.
  • This precision minimizes waste and enhances product quality, underscoring the technology's transformative impact on process automation and quality control, leading to a strong return on investment.

We can help! Our analysts can customize this ai based 3d vision system market research report to meet your requirements.

Get in touch

1. Executive Summary

1.1 Market overview

Executive Summary - Chart on Market Overview
Executive Summary - Data Table on Market Overview
Executive Summary - Chart on Global Market Characteristics
Executive Summary - Chart on Market by Geography
Executive Summary - Chart on Market Segmentation by Component
Executive Summary - Chart on Market Segmentation by Type
Executive Summary - Chart on Market Segmentation by Application
Executive Summary - Chart on Incremental Growth
Executive Summary - Data Table on Incremental Growth
Executive Summary - Chart on Company Market Positioning

2. Technavio Analysis

2.1 Analysis of price sensitivity, lifecycle, customer purchase basket, adoption rates, and purchase criteria

2.2 Criticality of inputs and Factors of differentiation

Chart on Overview on criticality of inputs and factors of differentiation

2.3 Factors of disruption

Chart on Overview on factors of disruption

2.4 Impact of drivers and challenges

Chart on Impact of drivers and challenges in 2024 and 2029

3. Market Landscape

3.1 Market ecosystem

Chart on Parent Market
Data Table on - Parent Market

3.2 Market characteristics

Chart on Market characteristics analysis

3.3 Value chain analysis

Chart on Value chain analysis

4. Market Sizing

4.1 Market definition

Data Table on Offerings of companies included in the market definition

4.2 Market segment analysis

Market segments

4.3 Market size 2024

4.4 Market outlook: Forecast for 2024-2029

Chart on Global - Market size and forecast 2024-2029 ($ thousand)
Data Table on Global - Market size and forecast 2024-2029 ($ thousand)
Chart on Global Market: Year-over-year growth 2024-2029 (%)
Data Table on Global Market: Year-over-year growth 2024-2029 (%)

5. Historic Market Size

5.1 Global AI Based 3D Vision System Market 2019 - 2023

Historic Market Size - Data Table on Global AI Based 3D Vision System Market 2019 - 2023 ($ thousand)

5.2 Component segment analysis 2019 - 2023

Historic Market Size - Component Segment 2019 - 2023 ($ thousand)

5.3 Type segment analysis 2019 - 2023

Historic Market Size - Type Segment 2019 - 2023 ($ thousand)

5.4 Application segment analysis 2019 - 2023

Historic Market Size - Application Segment 2019 - 2023 ($ thousand)

5.5 Geography segment analysis 2019 - 2023

Historic Market Size - Geography Segment 2019 - 2023 ($ thousand)

5.6 Country segment analysis 2019 - 2023

Historic Market Size - Country Segment 2019 - 2023 ($ thousand)

6. Five Forces Analysis

6.1 Five forces summary

Five forces analysis - Comparison between 2024 and 2029

6.2 Bargaining power of buyers

Bargaining power of buyers - Impact of key factors 2024 and 2029

6.3 Bargaining power of suppliers

Bargaining power of suppliers - Impact of key factors in 2024 and 2029

6.4 Threat of new entrants

Threat of new entrants - Impact of key factors in 2024 and 2029

6.5 Threat of substitutes

Threat of substitutes - Impact of key factors in 2024 and 2029

6.6 Threat of rivalry

Threat of rivalry - Impact of key factors in 2024 and 2029

6.7 Market condition

Chart on Market condition - Five forces 2024 and 2029

7. Market Segmentation by Component

7.1 Market segments

Chart on Component - Market share 2024-2029 (%)
Data Table on Component - Market share 2024-2029 (%)

7.2 Comparison by Component

Chart on Comparison by Component
Data Table on Comparison by Component

7.3 Hardware - Market size and forecast 2024-2029

Chart on Hardware - Market size and forecast 2024-2029 ($ thousand)
Data Table on Hardware - Market size and forecast 2024-2029 ($ thousand)
Chart on Hardware - Year-over-year growth 2024-2029 (%)
Data Table on Hardware - Year-over-year growth 2024-2029 (%)

7.4 Software - Market size and forecast 2024-2029

Chart on Software - Market size and forecast 2024-2029 ($ thousand)
Data Table on Software - Market size and forecast 2024-2029 ($ thousand)
Chart on Software - Year-over-year growth 2024-2029 (%)
Data Table on Software - Year-over-year growth 2024-2029 (%)

7.5 Services - Market size and forecast 2024-2029

Chart on Services - Market size and forecast 2024-2029 ($ thousand)
Data Table on Services - Market size and forecast 2024-2029 ($ thousand)
Chart on Services - Year-over-year growth 2024-2029 (%)
Data Table on Services - Year-over-year growth 2024-2029 (%)

7.6 Market opportunity by Component

Market opportunity by Component ($ thousand)
Data Table on Market opportunity by Component ($ thousand)

8. Market Segmentation by Type

8.1 Market segments

Chart on Type - Market share 2024-2029 (%)
Data Table on Type - Market share 2024-2029 (%)

8.2 Comparison by Type

Chart on Comparison by Type
Data Table on Comparison by Type

8.3 PC based - Market size and forecast 2024-2029

Chart on PC based - Market size and forecast 2024-2029 ($ thousand)
Data Table on PC based - Market size and forecast 2024-2029 ($ thousand)
Chart on PC based - Year-over-year growth 2024-2029 (%)
Data Table on PC based - Year-over-year growth 2024-2029 (%)

8.4 Smart camera based - Market size and forecast 2024-2029

Chart on Smart camera based - Market size and forecast 2024-2029 ($ thousand)
Data Table on Smart camera based - Market size and forecast 2024-2029 ($ thousand)
Chart on Smart camera based - Year-over-year growth 2024-2029 (%)
Data Table on Smart camera based - Year-over-year growth 2024-2029 (%)

8.5 Others - Market size and forecast 2024-2029

Chart on Others - Market size and forecast 2024-2029 ($ thousand)
Data Table on Others - Market size and forecast 2024-2029 ($ thousand)
Chart on Others - Year-over-year growth 2024-2029 (%)
Data Table on Others - Year-over-year growth 2024-2029 (%)

8.6 Market opportunity by Type

Market opportunity by Type ($ thousand)
Data Table on Market opportunity by Type ($ thousand)

9. Market Segmentation by Application

9.1 Market segments

Chart on Application - Market share 2024-2029 (%)
Data Table on Application - Market share 2024-2029 (%)

9.2 Comparison by Application

Chart on Comparison by Application
Data Table on Comparison by Application

9.3 Quality assurance and inspection - Market size and forecast 2024-2029

Chart on Quality assurance and inspection - Market size and forecast 2024-2029 ($ thousand)
Data Table on Quality assurance and inspection - Market size and forecast 2024-2029 ($ thousand)
Chart on Quality assurance and inspection - Year-over-year growth 2024-2029 (%)
Data Table on Quality assurance and inspection - Year-over-year growth 2024-2029 (%)

9.4 Positioning and guidance - Market size and forecast 2024-2029

Chart on Positioning and guidance - Market size and forecast 2024-2029 ($ thousand)
Data Table on Positioning and guidance - Market size and forecast 2024-2029 ($ thousand)
Chart on Positioning and guidance - Year-over-year growth 2024-2029 (%)
Data Table on Positioning and guidance - Year-over-year growth 2024-2029 (%)

9.5 Measurement - Market size and forecast 2024-2029

Chart on Measurement - Market size and forecast 2024-2029 ($ thousand)
Data Table on Measurement - Market size and forecast 2024-2029 ($ thousand)
Chart on Measurement - Year-over-year growth 2024-2029 (%)
Data Table on Measurement - Year-over-year growth 2024-2029 (%)

9.6 Market opportunity by Application

Market opportunity by Application ($ thousand)
Data Table on Market opportunity by Application ($ thousand)

10. Customer Landscape

10.1 Customer landscape overview

Analysis of price sensitivity, lifecycle, customer purchase basket, adoption rates, and purchase criteria

11. Geographic Landscape

11.1 Geographic segmentation

Chart on Market share by geography 2024-2029 (%)
Data Table on Market share by geography 2024-2029 (%)

11.2 Geographic comparison

Chart on Geographic comparison
Data Table on Geographic comparison

11.3 North America - Market size and forecast 2024-2029

Chart on North America - Market size and forecast 2024-2029 ($ thousand)
Data Table on North America - Market size and forecast 2024-2029 ($ thousand)
Chart on North America - Year-over-year growth 2024-2029 (%)
Data Table on North America - Year-over-year growth 2024-2029 (%)
Chart on Regional Comparison - North America
Data Table on Regional Comparison - North America

11.3.1 US - Market size and forecast 2024-2029

Chart on US - Market size and forecast 2024-2029 ($ thousand)
Data Table on US - Market size and forecast 2024-2029 ($ thousand)
Chart on US - Year-over-year growth 2024-2029 (%)
Data Table on US - Year-over-year growth 2024-2029 (%)

11.3.2 Canada - Market size and forecast 2024-2029

Chart on Canada - Market size and forecast 2024-2029 ($ thousand)
Data Table on Canada - Market size and forecast 2024-2029 ($ thousand)
Chart on Canada - Year-over-year growth 2024-2029 (%)
Data Table on Canada - Year-over-year growth 2024-2029 (%)

11.3.3 Mexico - Market size and forecast 2024-2029

Chart on Mexico - Market size and forecast 2024-2029 ($ thousand)
Data Table on Mexico - Market size and forecast 2024-2029 ($ thousand)
Chart on Mexico - Year-over-year growth 2024-2029 (%)
Data Table on Mexico - Year-over-year growth 2024-2029 (%)

11.4 APAC - Market size and forecast 2024-2029

Chart on APAC - Market size and forecast 2024-2029 ($ thousand)
Data Table on APAC - Market size and forecast 2024-2029 ($ thousand)
Chart on APAC - Year-over-year growth 2024-2029 (%)
Data Table on APAC - Year-over-year growth 2024-2029 (%)
Chart on Regional Comparison - APAC
Data Table on Regional Comparison - APAC

11.4.1 China - Market size and forecast 2024-2029

Chart on China - Market size and forecast 2024-2029 ($ thousand)
Data Table on China - Market size and forecast 2024-2029 ($ thousand)
Chart on China - Year-over-year growth 2024-2029 (%)
Data Table on China - Year-over-year growth 2024-2029 (%)

11.4.2 Japan - Market size and forecast 2024-2029

Chart on Japan - Market size and forecast 2024-2029 ($ thousand)
Data Table on Japan - Market size and forecast 2024-2029 ($ thousand)
Chart on Japan - Year-over-year growth 2024-2029 (%)
Data Table on Japan - Year-over-year growth 2024-2029 (%)

11.4.3 South Korea - Market size and forecast 2024-2029

Chart on South Korea - Market size and forecast 2024-2029 ($ thousand)
Data Table on South Korea - Market size and forecast 2024-2029 ($ thousand)
Chart on South Korea - Year-over-year growth 2024-2029 (%)
Data Table on South Korea - Year-over-year growth 2024-2029 (%)

11.4.4 India - Market size and forecast 2024-2029

Chart on India - Market size and forecast 2024-2029 ($ thousand)
Data Table on India - Market size and forecast 2024-2029 ($ thousand)
Chart on India - Year-over-year growth 2024-2029 (%)
Data Table on India - Year-over-year growth 2024-2029 (%)

11.4.5 Australia - Market size and forecast 2024-2029

Chart on Australia - Market size and forecast 2024-2029 ($ thousand)
Data Table on Australia - Market size and forecast 2024-2029 ($ thousand)
Chart on Australia - Year-over-year growth 2024-2029 (%)
Data Table on Australia - Year-over-year growth 2024-2029 (%)

11.4.6 Indonesia - Market size and forecast 2024-2029

Chart on Indonesia - Market size and forecast 2024-2029 ($ thousand)
Data Table on Indonesia - Market size and forecast 2024-2029 ($ thousand)
Chart on Indonesia - Year-over-year growth 2024-2029 (%)
Data Table on Indonesia - Year-over-year growth 2024-2029 (%)

11.5 Europe - Market size and forecast 2024-2029

Chart on Europe - Market size and forecast 2024-2029 ($ thousand)
Data Table on Europe - Market size and forecast 2024-2029 ($ thousand)
Chart on Europe - Year-over-year growth 2024-2029 (%)
Data Table on Europe - Year-over-year growth 2024-2029 (%)
Chart on Regional Comparison - Europe
Data Table on Regional Comparison - Europe

11.5.1 Germany - Market size and forecast 2024-2029

Chart on Germany - Market size and forecast 2024-2029 ($ thousand)
Data Table on Germany - Market size and forecast 2024-2029 ($ thousand)
Chart on Germany - Year-over-year growth 2024-2029 (%)
Data Table on Germany - Year-over-year growth 2024-2029 (%)

11.5.2 UK - Market size and forecast 2024-2029

Chart on UK - Market size and forecast 2024-2029 ($ thousand)
Data Table on UK - Market size and forecast 2024-2029 ($ thousand)
Chart on UK - Year-over-year growth 2024-2029 (%)
Data Table on UK - Year-over-year growth 2024-2029 (%)

11.5.3 France - Market size and forecast 2024-2029

Chart on France - Market size and forecast 2024-2029 ($ thousand)
Data Table on France - Market size and forecast 2024-2029 ($ thousand)
Chart on France - Year-over-year growth 2024-2029 (%)
Data Table on France - Year-over-year growth 2024-2029 (%)

11.5.4 Italy - Market size and forecast 2024-2029

Chart on Italy - Market size and forecast 2024-2029 ($ thousand)
Data Table on Italy - Market size and forecast 2024-2029 ($ thousand)
Chart on Italy - Year-over-year growth 2024-2029 (%)
Data Table on Italy - Year-over-year growth 2024-2029 (%)

11.5.5 The Netherlands - Market size and forecast 2024-2029

Chart on The Netherlands - Market size and forecast 2024-2029 ($ thousand)
Data Table on The Netherlands - Market size and forecast 2024-2029 ($ thousand)
Chart on The Netherlands - Year-over-year growth 2024-2029 (%)
Data Table on The Netherlands - Year-over-year growth 2024-2029 (%)

11.5.6 Spain - Market size and forecast 2024-2029

Chart on Spain - Market size and forecast 2024-2029 ($ thousand)
Data Table on Spain - Market size and forecast 2024-2029 ($ thousand)
Chart on Spain - Year-over-year growth 2024-2029 (%)
Data Table on Spain - Year-over-year growth 2024-2029 (%)

11.6 South America - Market size and forecast 2024-2029

Chart on South America - Market size and forecast 2024-2029 ($ thousand)
Data Table on South America - Market size and forecast 2024-2029 ($ thousand)
Chart on South America - Year-over-year growth 2024-2029 (%)
Data Table on South America - Year-over-year growth 2024-2029 (%)
Chart on Regional Comparison - South America
Data Table on Regional Comparison - South America

11.6.1 Brazil - Market size and forecast 2024-2029

Chart on Brazil - Market size and forecast 2024-2029 ($ thousand)
Data Table on Brazil - Market size and forecast 2024-2029 ($ thousand)
Chart on Brazil - Year-over-year growth 2024-2029 (%)
Data Table on Brazil - Year-over-year growth 2024-2029 (%)

11.6.2 Argentina - Market size and forecast 2024-2029

Chart on Argentina - Market size and forecast 2024-2029 ($ thousand)
Data Table on Argentina - Market size and forecast 2024-2029 ($ thousand)
Chart on Argentina - Year-over-year growth 2024-2029 (%)
Data Table on Argentina - Year-over-year growth 2024-2029 (%)

11.6.3 Colombia - Market size and forecast 2024-2029

Chart on Colombia - Market size and forecast 2024-2029 ($ thousand)
Data Table on Colombia - Market size and forecast 2024-2029 ($ thousand)
Chart on Colombia - Year-over-year growth 2024-2029 (%)
Data Table on Colombia - Year-over-year growth 2024-2029 (%)

11.7 Middle East and Africa - Market size and forecast 2024-2029

Chart on Middle East and Africa - Market size and forecast 2024-2029 ($ thousand)
Data Table on Middle East and Africa - Market size and forecast 2024-2029 ($ thousand)
Chart on Middle East and Africa - Year-over-year growth 2024-2029 (%)
Data Table on Middle East and Africa - Year-over-year growth 2024-2029 (%)
Chart on Regional Comparison - Middle East and Africa
Data Table on Regional Comparison - Middle East and Africa

11.7.1 UAE - Market size and forecast 2024-2029

Chart on UAE - Market size and forecast 2024-2029 ($ thousand)
Data Table on UAE - Market size and forecast 2024-2029 ($ thousand)
Chart on UAE - Year-over-year growth 2024-2029 (%)
Data Table on UAE - Year-over-year growth 2024-2029 (%)

11.7.2 Saudi Arabia - Market size and forecast 2024-2029

Chart on Saudi Arabia - Market size and forecast 2024-2029 ($ thousand)
Data Table on Saudi Arabia - Market size and forecast 2024-2029 ($ thousand)
Chart on Saudi Arabia - Year-over-year growth 2024-2029 (%)
Data Table on Saudi Arabia - Year-over-year growth 2024-2029 (%)

11.7.3 Israel - Market size and forecast 2024-2029

Chart on Israel - Market size and forecast 2024-2029 ($ thousand)
Data Table on Israel - Market size and forecast 2024-2029 ($ thousand)
Chart on Israel - Year-over-year growth 2024-2029 (%)
Data Table on Israel - Year-over-year growth 2024-2029 (%)

11.7.4 South Africa - Market size and forecast 2024-2029

Chart on South Africa - Market size and forecast 2024-2029 ($ thousand)
Data Table on South Africa - Market size and forecast 2024-2029 ($ thousand)
Chart on South Africa - Year-over-year growth 2024-2029 (%)
Data Table on South Africa - Year-over-year growth 2024-2029 (%)

11.7.5 Turkey - Market size and forecast 2024-2029

Chart on Turkey - Market size and forecast 2024-2029 ($ thousand)
Data Table on Turkey - Market size and forecast 2024-2029 ($ thousand)
Chart on Turkey - Year-over-year growth 2024-2029 (%)
Data Table on Turkey - Year-over-year growth 2024-2029 (%)

11.8 Market opportunity by geography

Market opportunity by geography ($ thousand)
Data Tables on Market opportunity by geography ($ thousand)

12. Drivers, Challenges, and Opportunity

12.1 Market drivers

Rising imperative for automation and enhanced quality control across industries
Accelerated advancements in AI and 3D imaging technologies
Expanding applications in high growth and non industrial sectors

12.2 Market challenges

High implementation costs and system complexity
Data privacy and security concerns
Shortage of skilled workforce and expertise

12.3 Impact of drivers and challenges

Impact of drivers and challenges in 2024 and 2029

12.4 Market opportunities

Proliferation of deep learning for superior automated quality control and inspection
Expansion into logistics and warehousing automation
Convergence of AI based 3D vision with edge computing

13. Competitive Landscape

13.1 Overview

13.2

Overview on criticality of inputs and factors of differentiation

13.3 Landscape disruption

Overview on factors of disruption

13.4 Industry risks

Impact of key risks on business

14. Competitive Analysis

14.1 Companies profiled

Companies covered

14.2 Company ranking index

14.3 Market positioning of companies

Matrix on companies position and classification

14.4 Amazon Web Services Inc.

Amazon Web Services Inc. - Overview
Amazon Web Services Inc. - Product / Service
Amazon Web Services Inc. - Key news
Amazon Web Services Inc. - Key offerings
SWOT

14.5 Apera AI

Apera AI - Overview
Apera AI - Product / Service
Apera AI - Key offerings
SWOT

14.6 AVEVA Group Plc

AVEVA Group Plc - Overview
AVEVA Group Plc - Business segments
AVEVA Group Plc - Key offerings
AVEVA Group Plc - Segment focus
SWOT

14.7 Avnet Inc.

Avnet Inc. - Overview
Avnet Inc. - Business segments
Avnet Inc. - Key offerings
Avnet Inc. - Segment focus
SWOT

14.8 Chooch Intelligence Technologies Co.

Chooch Intelligence Technologies Co. - Overview
Chooch Intelligence Technologies Co. - Product / Service
Chooch Intelligence Technologies Co. - Key offerings
SWOT

14.9 Cognex Corp.

Cognex Corp. - Overview
Cognex Corp. - Product / Service
Cognex Corp. - Key news
Cognex Corp. - Key offerings
SWOT

14.10 Google LLC

Google LLC - Overview
Google LLC - Product / Service
Google LLC - Key offerings
SWOT

14.11 Intel Corp.

Intel Corp. - Overview
Intel Corp. - Business segments
Intel Corp. - Key news
Intel Corp. - Key offerings
Intel Corp. - Segment focus
SWOT

14.12 IBM Corp.

IBM Corp. - Overview
IBM Corp. - Business segments
IBM Corp. - Key news
IBM Corp. - Key offerings
IBM Corp. - Segment focus
SWOT

14.13 Microsoft Corp.

Microsoft Corp. - Overview
Microsoft Corp. - Business segments
Microsoft Corp. - Key news
Microsoft Corp. - Key offerings
Microsoft Corp. - Segment focus
SWOT

14.14 NVIDIA Corp.

NVIDIA Corp. - Overview
NVIDIA Corp. - Business segments
NVIDIA Corp. - Key news
NVIDIA Corp. - Key offerings
NVIDIA Corp. - Segment focus
SWOT

14.15 Oracle Corp.

Oracle Corp. - Overview
Oracle Corp. - Business segments
Oracle Corp. - Key news
Oracle Corp. - Key offerings
Oracle Corp. - Segment focus
SWOT

14.16 Qualcomm Inc.

Qualcomm Inc. - Overview
Qualcomm Inc. - Business segments
Qualcomm Inc. - Key news
Qualcomm Inc. - Key offerings
Qualcomm Inc. - Segment focus
SWOT

14.17 STMicroelectronics NV

STMicroelectronics NV - Overview
STMicroelectronics NV - Business segments
STMicroelectronics NV - Key news
STMicroelectronics NV - Key offerings
STMicroelectronics NV - Segment focus
SWOT

14.18 Symphony Innovation LLC

Symphony Innovation LLC - Overview
Symphony Innovation LLC - Product / Service
Symphony Innovation LLC - Key offerings
SWOT

15. Appendix

15.1 Scope of the report

Market definition
Objectives
Notes and caveats

15.2 Inclusions and exclusions checklist

Inclusions checklist
Exclusions checklist

15.3 Currency conversion rates for US$

15.4 Research methodology

15.5 Data procurement

Information sources

15.6 Data validation

15.7 Validation techniques employed for market sizing

15.8 Data synthesis

15.9 360 degree market analysis

15.10 List of abbreviations

Research Methodology

Technavio presents a detailed picture of the market by way of study, synthesis, and summation of data from multiple sources. The analysts have presented the various facets of the market with a particular focus on identifying the key industry influencers. The data thus presented is comprehensive, reliable, and the result of extensive research, both primary and secondary.

INFORMATION SOURCES

Primary sources

  • Manufacturers and suppliers
  • Channel partners
  • Industry experts
  • Strategic decision makers

Secondary sources

  • Industry journals and periodicals
  • Government data
  • Financial reports of key industry players
  • Historical data
  • Press releases

DATA ANALYSIS

Data Synthesis

  • Collation of data
  • Estimation of key figures
  • Analysis of derived insights

Data Validation

  • Triangulation with data models
  • Reference against proprietary databases
  • Corroboration with industry experts

REPORT WRITING

Qualitative

  • Market drivers
  • Market challenges
  • Market trends
  • Five forces analysis

Quantitative

  • Market size and forecast
  • Market segmentation
  • Geographical insights
  • Competitive landscape

Interested in this report?

Get your sample now to see our research methodology and insights!

Download Now

Frequently Asked Questions

AI Based 3D Vision System market growth will increase by USD 589982.3 thousand thousand during 2025-2029.

The AI Based 3D Vision System market is expected to grow at a CAGR of 22.8% during 2025-2029.

AI Based 3D Vision System market is segmented by Component (Hardware, Software, Services) Type (PC based, Smart camera based, Others) Application (Quality assurance and inspection, Positioning and guidance, Measurement)

Amazon Web Services Inc., Apera AI, AVEVA Group Plc, Avnet Inc., Chooch Intelligence Technologies Co., Cognex Corp., Google LLC, Intel Corp., IBM Corp., Landing AI, Microsoft Corp., NVIDIA Corp., Oracle Corp., Qualcomm Inc., Robovision BV, Skyhaus BV, STMicroelectronics NV, Symphony Innovation LLC are a few of the key vendors in the AI Based 3D Vision System market.

North America will register the highest growth rate of 33.1% among the other regions. Therefore, the AI Based 3D Vision System market in North America is expected to garner significant business opportunities for the vendors during the forecast period.

US, Canada, Mexico, China, Japan, South Korea, India, Australia, Indonesia, Germany, UK, France, Italy, The Netherlands, Spain, Brazil, Argentina, Colombia, UAE, Saudi Arabia, Israel, South Africa, Turkey

  • Rising imperative for automation and enhanced quality control across industries is the driving factor this market.

The AI Based 3D Vision System market vendors should focus on grabbing business opportunities from the Component segment as it accounted for the largest market share in the base year.