Ai-based Chemical Manufacturing Market Analysis, Size, and Forecast 2025-2029: North America (US, Canada, and Mexico), APAC (China, Japan, and Australia), Europe (Germany, UK, and France), South America (Brazil, Argentina, and Colombia), Middle East and Africa (Saudi Arabia, UAE, and South Africa), and Rest of World (ROW)

Ai-based Chemical Manufacturing Market Analysis, Size, and Forecast 2025-2029:
North America (US, Canada, and Mexico), APAC (China, Japan, and Australia), Europe (Germany, UK, and France), South America (Brazil, Argentina, and Colombia), Middle East and Africa (Saudi Arabia, UAE, and South Africa), and Rest of World (ROW)

Published: Dec 2025 300 Pages SKU: IRTNTR81055

Market Overview at a Glance

$10.29 B
Market Opportunity
41.4%
CAGR 2024 - 2029
37%
North America Growth
$977.6 Mn
Software segment 2023

Ai-based Chemical Manufacturing Market Size 2025-2029

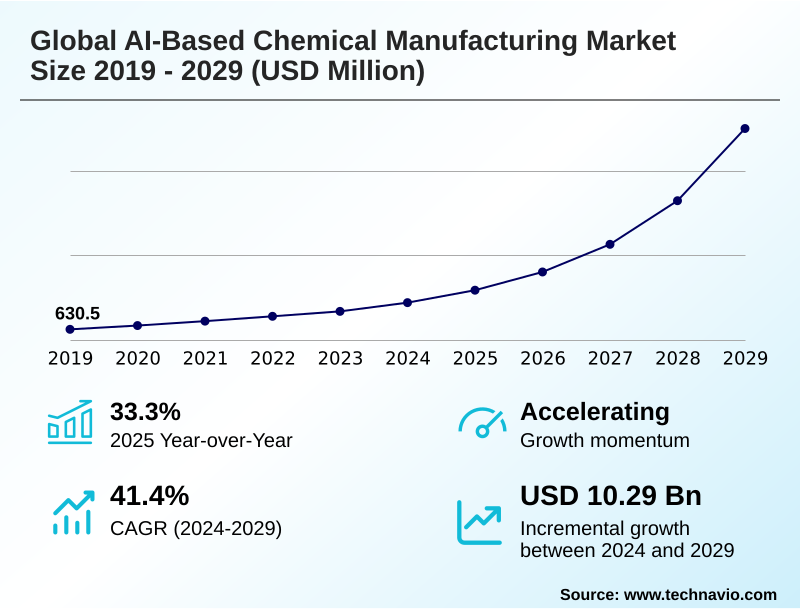
The ai-based chemical manufacturing market size is valued to increase by USD 10.29 billion, at a CAGR of 41.4% from 2024 to 2029. Optimization of production processes and operational efficiency will drive the ai-based chemical manufacturing market.

Major Market Trends & Insights

  • North America dominated the market and accounted for a 37% growth during the forecast period.
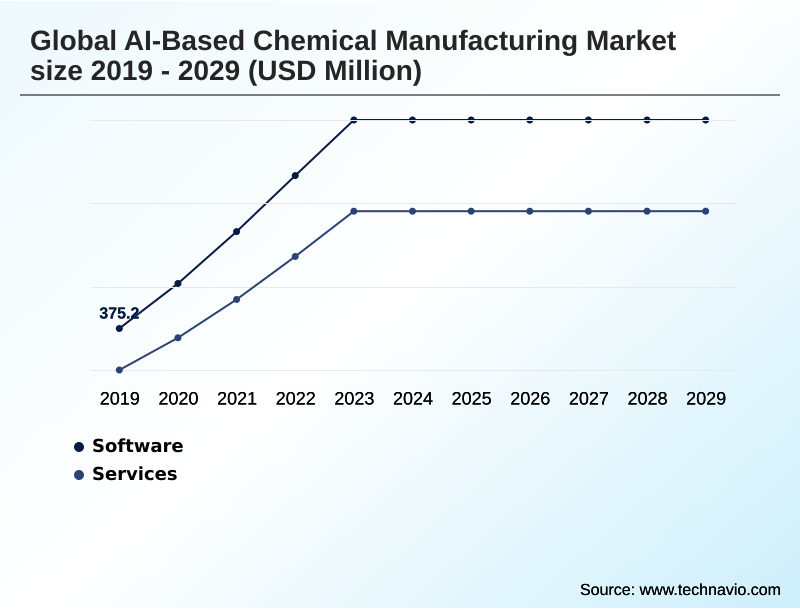
  • By Type - Software segment was valued at USD 977.6 million in 2023
  • By End-user - Chemicals and petrochemicals segment accounted for the largest market revenue share in 2023

Market Size & Forecast

  • Market Opportunities: USD 11.87 billion
  • Market Future Opportunities: USD 10.29 billion
  • CAGR from 2024 to 2029 : 41.4%

Market Summary

  • The AI-based chemical manufacturing market is undergoing a significant transformation, driven by the integration of artificial intelligence across the entire production lifecycle. This shift is fueled by the imperative for enhanced operational efficiency, accelerated product innovation, and improved sustainability.
  • Key trends include the use of generative chemistry and predictive modeling to fast-track the discovery of novel materials, dramatically shortening R&D cycles. For example, a company might use AI-guided synthesis to screen millions of compounds virtually, identifying optimal formulations that would have previously required years of physical experimentation.
  • Concurrently, AI-powered monitoring systems are being deployed for predictive maintenance and process control, which minimizes downtime and reduces waste. However, the industry faces challenges related to high implementation costs, the need for robust data security to protect intellectual property, and a shortage of skilled professionals who can manage both chemical engineering and advanced computational algorithms.
  • Successfully navigating these factors is crucial for leveraging AI to achieve a competitive advantage through data-driven predictive paradigms and enhanced quality assurance.

What will be the Size of the Ai-based Chemical Manufacturing Market during the forecast period?

Get Key Insights on Market Forecast (PDF) Request Free Sample

How is the Ai-based Chemical Manufacturing Market Segmented?

The ai-based chemical manufacturing industry research report provides comprehensive data (region-wise segment analysis), with forecasts and estimates in "USD million" for the period 2025-2029, as well as historical data from 2019-2023 for the following segments.

  • Type
    • Software
    • Services
  • End-user
    • Chemicals and petrochemicals
    • Specialty chemicals
    • Agricultural chemicals
  • Application
    • Production optimization
    • New material innovation
    • Operational process management
    • Pricing optimization
  • Geography
    • North America
      • US
      • Canada
      • Mexico
    • APAC
      • China
      • Japan
      • Australia
    • Europe
      • Germany
      • UK
      • France
    • South America
      • Brazil
      • Argentina
      • Colombia
    • Middle East and Africa
      • Saudi Arabia
      • UAE
      • South Africa
    • Rest of World (ROW)

By Type Insights

The software segment is estimated to witness significant growth during the forecast period.

Software platforms are the core technological framework driving the AI-based chemical manufacturing market, providing advanced algorithms and applications for strategic and operational goals. These solutions, incorporating generative chemistry and intelligent protein design, leverage sophisticated machine learning models to accelerate innovation.

Modern systems utilize agentic AI and multi-agent orchestration within integrated environments like an AI refinery platform to manage complex industrial workflows and automate processes. Tools leveraging generative pre-trained transformers are optimizing reaction pathway optimization and streamlining data-based R&D.

By enabling next-generation generative AI models, these software tools are helping firms achieve significant performance gains, with some platforms reducing materials discovery timelines by up to 70%.

Request Free Sample

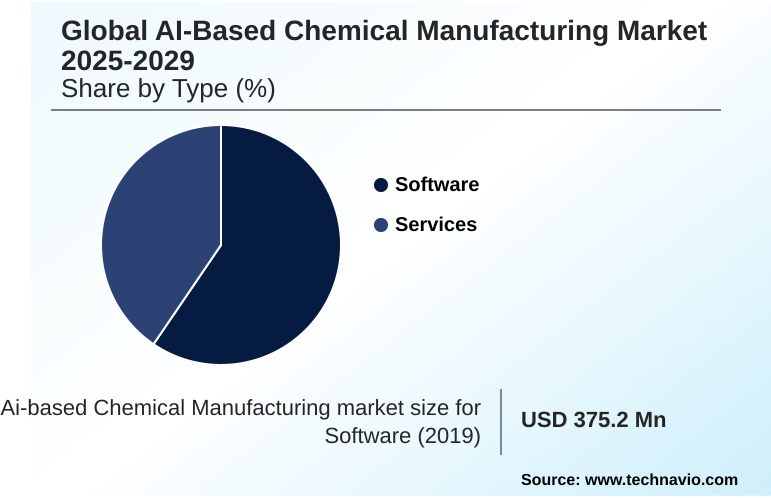
The Software segment was valued at USD 977.6 million in 2023 and showed a gradual increase during the forecast period.

Request Free Sample

Regional Analysis

North America is estimated to contribute 37% to the growth of the global market during the forecast period.Technavio’s analysts have elaborately explained the regional trends and drivers that shape the market during the forecast period.

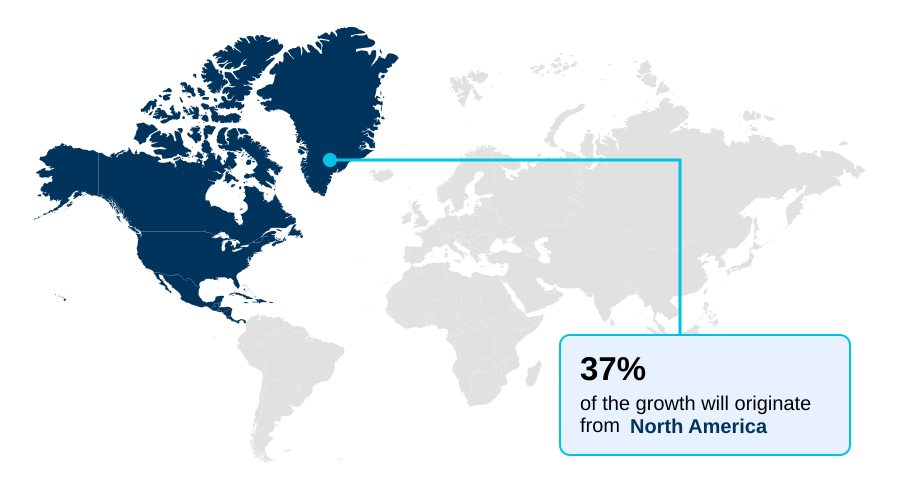
See How Ai-based Chemical Manufacturing Market Demand is Rising in North America Request Free Sample

The geographic landscape of the market is characterized by distinct regional dynamics and adoption drivers.

North America leads in investment and innovation, with a 27% surge in AI adoption priority among manufacturers reflecting a focus on agentic AI and supercomputing for complex industrial problems.

Europe is driven by sustainability mandates and regulatory compliance, fostering a need for AI ethics specialists and the deployment of industrial AI agents for transparent operations.

The APAC region is experiencing rapid growth fueled by government-backed smart manufacturing initiatives that leverage GPU-accelerated simulations and large language models for scalable production.

In the Middle East and Africa, AI is being positioned as a cornerstone of economic diversification, with a focus on federated learning for secure data sharing and enhanced supply chain management.

Market Dynamics

Our researchers analyzed the data with 2024 as the base year, along with the key drivers, trends, and challenges. A holistic analysis of drivers will help companies refine their marketing strategies to gain a competitive advantage.

  • The strategic implementation of artificial intelligence is revolutionizing chemical manufacturing, with companies achieving significant gains by targeting specific operational areas. Initial efforts often focus on energy management, using AI models for cooling tower operations and AI models for boiler efficiency optimization to reduce consumption.
  • For specialty chemical producers, AI applications for batch process optimization are critical for ensuring consistent quality and yield. In research and development, the focus shifts to AI for molecular property prediction and deep learning for crystal structure generation, which drastically accelerates innovation timelines.
  • These advancements are part of a broader strategy that includes AI integration for supply chain optimization and the use of AI models for demand forecasting, creating a more resilient and agile operational framework. Businesses that adopt these technologies are reportedly twice as likely to meet their sustainability goals compared to their peers.
  • This holistic approach, from AI for chemical composition analysis and AI for real-time process adjustments to AI for industrial workflow optimization, defines the new frontier of proactive operational management. As a result, AI solutions for waste generation reduction and AI for optimizing chemical injection performance are becoming standard practice, driven by the clear return on investment.

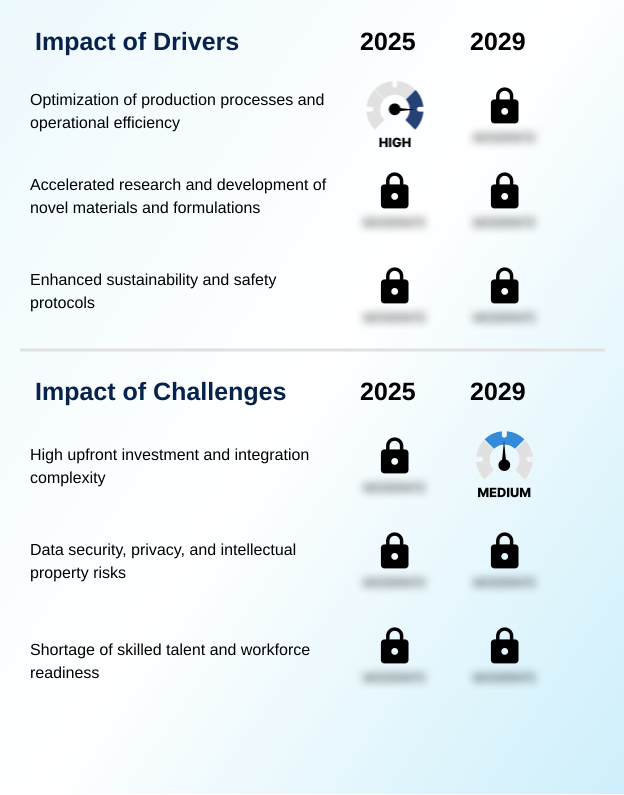
What are the key market drivers leading to the rise in the adoption of Ai-based Chemical Manufacturing Industry?

  • The optimization of production processes and the pursuit of greater operational efficiency are primary drivers of market growth.

  • Market growth is primarily driven by the pursuit of operational excellence, accelerated R&D, and enhanced sustainability.
  • AI-powered monitoring systems and AI-driven control systems are central to this, enabling predictive maintenance that has led to an 81% reduction in repair costs in certain applications.
  • In R&D, AI-driven discovery platforms and the CropKey system are being used to design novel molecules, shortening early research phases from years to months. Sustainability is a major impetus, with smart spraying technology and AI-powered analytics optimizing resource use.
  • The deployment of a deep learning system for safety, using pose estimation networks and sequential models, has also gained traction.
  • Furthermore, digital twin technology combined with predictive modeling allows for process simulation and optimization, directly contributing to waste reduction and efficiency improvements.

What are the market trends shaping the Ai-based Chemical Manufacturing Industry?

  • The increasing adoption of AI-driven process optimization and predictive maintenance represents a key market trend, shifting operations toward proactive and intelligent management.

  • Key trends are reshaping the market, centered on accelerated innovation and intelligent operations. The rise of generative AI for sustainability and AI-guided synthesis is transforming materials discovery, enabling inverse design and computational reaction screening to identify novel compounds. An end-to-end R&D platform leveraging industrial AI solutions can reduce product development timelines by up to 70%.
  • Concurrently, AI-assisted refining solutions and real-time spectroscopic analysis are enhancing plant efficiency. The integration of a custom electrolyte design using a molecular insight transformer exemplifies the push toward high-value, specialized applications. This advanced analytical capability allows for precise forecasting of maintenance needs, with some deployments reducing assembly process failures by over 70%, marking a substantial improvement in operational reliability.

What challenges does the Ai-based Chemical Manufacturing Industry face during its growth?

  • High upfront investment costs and the complexity of integrating new technologies with legacy systems present a key challenge to market growth.

  • Significant challenges hinder widespread market adoption, primarily high upfront costs and integration complexity. High implementation costs affect 37% of manufacturers, while technical integration with legacy systems remains a barrier for 44%. Establishing a robust AI infrastructure capable of running advanced computational algorithms for molecular design and process control requires substantial capital.
  • Data governance is another major concern, as protecting proprietary information used for high-throughput experimentation is critical for maintaining a competitive edge. Moreover, a persistent shortage of skilled professionals proficient in data-driven predictive paradigms, asset performance management, and digital knowledge management complicates the deployment and maintenance of AI systems, slowing the transition to smarter manufacturing operations.

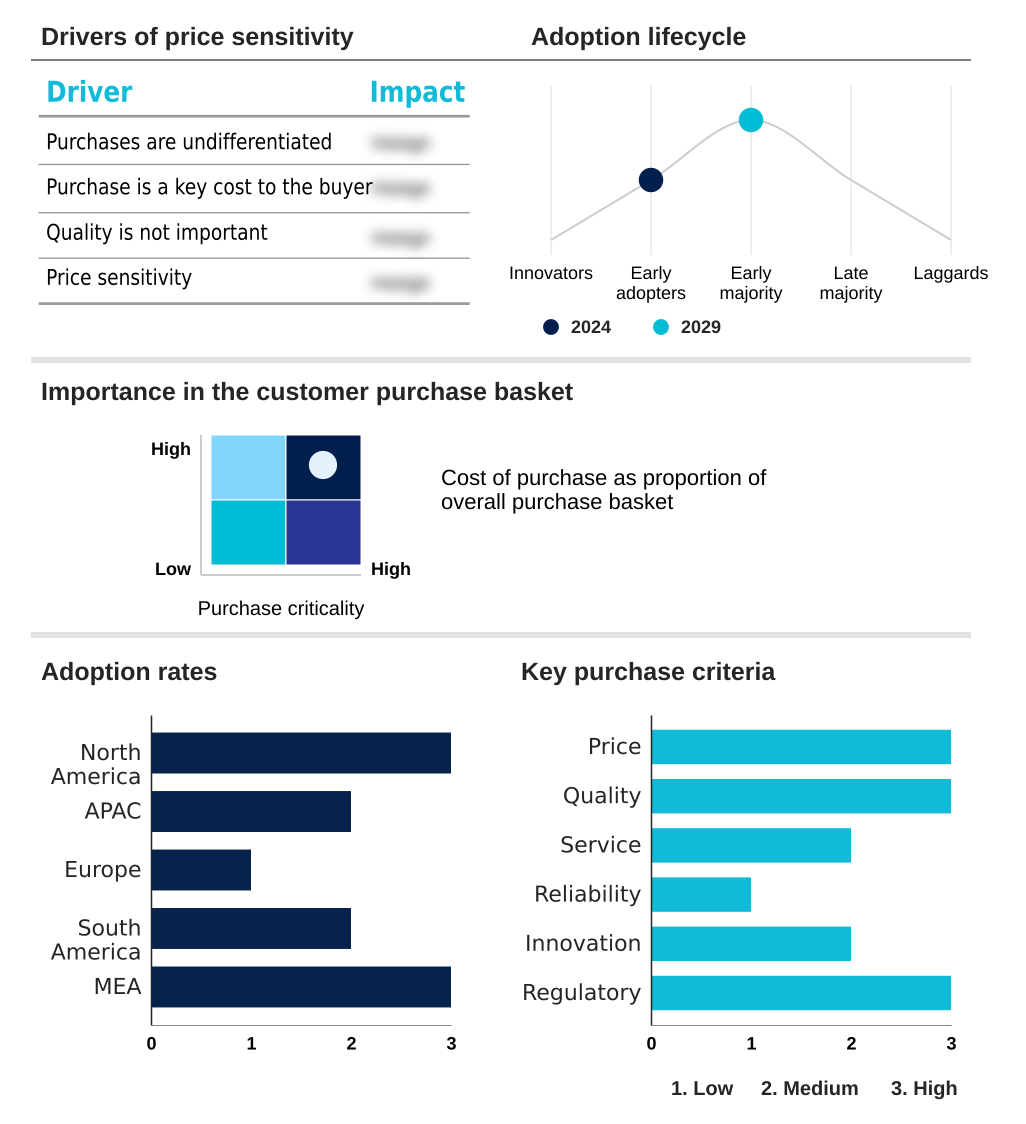
Exclusive Technavio Analysis on Customer Landscape

The ai-based chemical manufacturing market forecasting report includes the adoption lifecycle of the market, covering from the innovator’s stage to the laggard’s stage. It focuses on adoption rates in different regions based on penetration. Furthermore, the ai-based chemical manufacturing market report also includes key purchase criteria and drivers of price sensitivity to help companies evaluate and develop their market growth analysis strategies.

Customer Landscape of Ai-based Chemical Manufacturing Industry

Competitive Landscape

Companies are implementing various strategies, such as strategic alliances, ai-based chemical manufacturing market forecast, partnerships, mergers and acquisitions, geographical expansion, and product/service launches, to enhance their presence in the industry.

Accenture PLC - The AI Refinery platform utilizes agentic AI to optimize industrial workflows, accelerate R&D, and enhance process automation for chemical manufacturing.

The industry research and growth report includes detailed analyses of the competitive landscape of the market and information about key companies, including:

  • Accenture PLC
  • Aionics Inc.
  • Albert Invent Corp.
  • Arzeda Corp.
  • AVEVA Group Plc
  • BASF SE
  • ChemAI Ltd.
  • Citrine Informatics Inc.
  • Evonik Industries AG
  • Google LLC
  • Honeywell International Inc.
  • Insilico Medicine
  • IBM Corp.
  • Kebotix Inc.
  • Microsoft Corp.
  • NVIDIA Corp.
  • Schlumberger Ltd.
  • Siemens AG

Qualitative and quantitative analysis of companies has been conducted to help clients understand the wider business environment as well as the strengths and weaknesses of key industry players. Data is qualitatively analyzed to categorize companies as pure play, category-focused, industry-focused, and diversified; it is quantitatively analyzed to categorize companies as dominant, leading, strong, tentative, and weak.

Recent Development and News in Ai-based chemical manufacturing market

  • In December 2024, BASF, in collaboration with Endress+Hauser, TechnoCompound, and academic institutions, launched the SpecReK project to advance mechanical recycling of plastics using real-time spectroscopic analysis and AI.
  • In May 2025, Dow and Google X The Moonshot Factory announced a partnership to use AI for improving the circularity and recycling of hard-to-recycle plastics like films and flexibles.
  • In October 2024, Honeywell and Chevron collaborated to deploy AI-assisted refining solutions designed to improve efficiency, safety, and reliability in refining processes.
  • In April 2024, Insilico Medicine launched a Generative AI for Sustainability initiative, leveraging its AI platform to develop sustainable chemicals, fuels, and materials alongside traditional drug discovery.

Dive into Technavio’s robust research methodology, blending expert interviews, extensive data synthesis, and validated models for unparalleled Ai-based Chemical Manufacturing Market insights. See full methodology.

Market Scope
Page number 300
Base year 2024
Historic period 2019-2023
Forecast period 2025-2029
Growth momentum & CAGR Accelerate at a CAGR of 41.4%
Market growth 2025-2029 USD 10289.3 million
Market structure Fragmented
YoY growth 2024-2025(%) 33.3%
Key countries US, Canada, Mexico, China, Japan, Australia, India, South Korea, Indonesia, Germany, UK, France, The Netherlands, Italy, Spain, Brazil, Argentina, Colombia, Saudi Arabia, UAE, South Africa, Israel and Turkey
Competitive landscape Leading Companies, Market Positioning of Companies, Competitive Strategies, and Industry Risks

Request Free Sample

Research Analyst Overview

  • The AI-based chemical manufacturing market is advancing through the comprehensive integration of intelligent systems across the value chain. At the forefront is R&D, where generative chemistry and graph networks for materials are revolutionizing molecular design and reaction pathway optimization.
  • A predictive chemistry platform leveraging AI-guided synthesis and computational reaction screening now facilitates inverse design, with some initiatives shortening discovery times by up to 70%. In production, AI-powered monitoring systems, AI-driven control systems, and AI-powered analytics are enabling a shift to proactive operations.
  • This is enhanced by digital twin technology and industrial AI agents that provide real-time insights for process control and quality assurance. Leading firms are deploying agentic AI and supercomputing with GPU-accelerated simulations and chemistry-informed LLMs for complex problem-solving. This data-driven predictive paradigm extends to predictive maintenance and supply chain management, where federated learning and large language models optimize logistics.
  • The adoption of technologies like intelligent protein design and high-throughput experimentation, supported by multi-agent orchestration and machine learning models, is becoming a boardroom-level imperative for maintaining competitive advantage and driving generative AI for sustainability.

What are the Key Data Covered in this Ai-based Chemical Manufacturing Market Research and Growth Report?

  • What is the expected growth of the Ai-based Chemical Manufacturing Market between 2025 and 2029?

    • USD 10.29 billion, at a CAGR of 41.4%

  • What segmentation does the market report cover?

    • The report is segmented by Type (Software, Services), End-user (Chemicals and petrochemicals, Specialty chemicals, Agricultural chemicals), Application (Production optimization, New material innovation, Operational process management, Pricing optimization) and Geography (North America, APAC, Europe, South America, Middle East and Africa)

  • Which regions are analyzed in the report?

    • North America, APAC, Europe, South America and Middle East and Africa

  • What are the key growth drivers and market challenges?

    • Optimization of production processes and operational efficiency, High upfront investment and integration complexity

  • Who are the major players in the Ai-based Chemical Manufacturing Market?

    • Accenture PLC, Aionics Inc., Albert Invent Corp., Arzeda Corp., AVEVA Group Plc, BASF SE, ChemAI Ltd., Citrine Informatics Inc., Evonik Industries AG, Google LLC, Honeywell International Inc., Insilico Medicine, IBM Corp., Kebotix Inc., Microsoft Corp., NVIDIA Corp., Schlumberger Ltd. and Siemens AG

Market Research Insights

  • The market's momentum is defined by the strategic adoption of intelligent platforms and advanced analytics. An AI refinery platform is transforming industrial workflows by enabling autonomous screening and real-time monitoring, while an end-to-end R&D platform integrates digital knowledge management with predictive analytics.
  • This shift has produced measurable outcomes, with a reported 27% surge in AI adoption as a priority among manufacturers and a 70% reduction in some assembly process failures. The use of a molecular insight transformer for custom electrolyte design and virtual screenings has become central to materials innovation.
  • As companies leverage tools like watson discovery and generative pre-trained transformers, the focus sharpens on enhancing process automation and accelerating data-based R&D, pushing the boundaries of what next-generation generative AI models and industrial AI solutions can achieve.

We can help! Our analysts can customize this ai-based chemical manufacturing market research report to meet your requirements.

Get in touch

1. Executive Summary

1.1 Market overview

Executive Summary - Chart on Market Overview
Executive Summary - Data Table on Market Overview
Executive Summary - Chart on Global Market Characteristics
Executive Summary - Chart on Market by Geography
Executive Summary - Chart on Market Segmentation by Type
Executive Summary - Chart on Market Segmentation by End-user
Executive Summary - Chart on Market Segmentation by Application
Executive Summary - Chart on Incremental Growth
Executive Summary - Data Table on Incremental Growth
Executive Summary - Chart on Company Market Positioning

2. Technavio Analysis

2.1 Analysis of price sensitivity, lifecycle, customer purchase basket, adoption rates, and purchase criteria

2.2 Criticality of inputs and Factors of differentiation

Chart on Overview on criticality of inputs and factors of differentiation

2.3 Factors of disruption

Chart on Overview on factors of disruption

2.4 Impact of drivers and challenges

Chart on Impact of drivers and challenges in 2024 and 2029

3. Market Landscape

3.1 Market ecosystem

Chart on Parent Market
Data Table on - Parent Market

3.2 Market characteristics

Chart on Market characteristics analysis

3.3 Value chain analysis

Chart on Value chain analysis

4. Market Sizing

4.1 Market definition

Data Table on Offerings of companies included in the market definition

4.2 Market segment analysis

Market segments

4.3 Market size 2024

4.4 Market outlook: Forecast for 2024-2029

Chart on Global - Market size and forecast 2024-2029 ($ million)
Data Table on Global - Market size and forecast 2024-2029 ($ million)
Chart on Global Market: Year-over-year growth 2024-2029 (%)
Data Table on Global Market: Year-over-year growth 2024-2029 (%)

5. Historic Market Size

5.1 Global AI-Based Chemical Manufacturing Market 2019 - 2023

Historic Market Size - Data Table on Global AI-Based Chemical Manufacturing Market 2019 - 2023 ($ million)

5.2 Type segment analysis 2019 - 2023

Historic Market Size - Type Segment 2019 - 2023 ($ million)

5.3 End-user segment analysis 2019 - 2023

Historic Market Size - End-user Segment 2019 - 2023 ($ million)

5.4 Application segment analysis 2019 - 2023

Historic Market Size - Application Segment 2019 - 2023 ($ million)

5.5 Geography segment analysis 2019 - 2023

Historic Market Size - Geography Segment 2019 - 2023 ($ million)

5.6 Country segment analysis 2019 - 2023

Historic Market Size - Country Segment 2019 - 2023 ($ million)

6. Five Forces Analysis

6.1 Five forces summary

Five forces analysis - Comparison between 2024 and 2029

6.2 Bargaining power of buyers

Bargaining power of buyers - Impact of key factors 2024 and 2029

6.3 Bargaining power of suppliers

Bargaining power of suppliers - Impact of key factors in 2024 and 2029

6.4 Threat of new entrants

Threat of new entrants - Impact of key factors in 2024 and 2029

6.5 Threat of substitutes

Threat of substitutes - Impact of key factors in 2024 and 2029

6.6 Threat of rivalry

Threat of rivalry - Impact of key factors in 2024 and 2029

6.7 Market condition

Chart on Market condition - Five forces 2024 and 2029

7. Market Segmentation by Type

7.1 Market segments

Chart on Type - Market share 2024-2029 (%)
Data Table on Type - Market share 2024-2029 (%)

7.2 Comparison by Type

Chart on Comparison by Type
Data Table on Comparison by Type

7.3 Software - Market size and forecast 2024-2029

Chart on Software - Market size and forecast 2024-2029 ($ million)
Data Table on Software - Market size and forecast 2024-2029 ($ million)
Chart on Software - Year-over-year growth 2024-2029 (%)
Data Table on Software - Year-over-year growth 2024-2029 (%)

7.4 Services - Market size and forecast 2024-2029

Chart on Services - Market size and forecast 2024-2029 ($ million)
Data Table on Services - Market size and forecast 2024-2029 ($ million)
Chart on Services - Year-over-year growth 2024-2029 (%)
Data Table on Services - Year-over-year growth 2024-2029 (%)

7.5 Market opportunity by Type

Market opportunity by Type ($ million)
Data Table on Market opportunity by Type ($ million)

8. Market Segmentation by End-user

8.1 Market segments

Chart on End-user - Market share 2024-2029 (%)
Data Table on End-user - Market share 2024-2029 (%)

8.2 Comparison by End-user

Chart on Comparison by End-user
Data Table on Comparison by End-user

8.3 Chemicals and petrochemicals - Market size and forecast 2024-2029

Chart on Chemicals and petrochemicals - Market size and forecast 2024-2029 ($ million)
Data Table on Chemicals and petrochemicals - Market size and forecast 2024-2029 ($ million)
Chart on Chemicals and petrochemicals - Year-over-year growth 2024-2029 (%)
Data Table on Chemicals and petrochemicals - Year-over-year growth 2024-2029 (%)

8.4 Specialty chemicals - Market size and forecast 2024-2029

Chart on Specialty chemicals - Market size and forecast 2024-2029 ($ million)
Data Table on Specialty chemicals - Market size and forecast 2024-2029 ($ million)
Chart on Specialty chemicals - Year-over-year growth 2024-2029 (%)
Data Table on Specialty chemicals - Year-over-year growth 2024-2029 (%)

8.5 Agricultural chemicals - Market size and forecast 2024-2029

Chart on Agricultural chemicals - Market size and forecast 2024-2029 ($ million)
Data Table on Agricultural chemicals - Market size and forecast 2024-2029 ($ million)
Chart on Agricultural chemicals - Year-over-year growth 2024-2029 (%)
Data Table on Agricultural chemicals - Year-over-year growth 2024-2029 (%)

8.6 Market opportunity by End-user

Market opportunity by End-user ($ million)
Data Table on Market opportunity by End-user ($ million)

9. Market Segmentation by Application

9.1 Market segments

Chart on Application - Market share 2024-2029 (%)
Data Table on Application - Market share 2024-2029 (%)

9.2 Comparison by Application

Chart on Comparison by Application
Data Table on Comparison by Application

9.3 Production optimization - Market size and forecast 2024-2029

Chart on Production optimization - Market size and forecast 2024-2029 ($ million)
Data Table on Production optimization - Market size and forecast 2024-2029 ($ million)
Chart on Production optimization - Year-over-year growth 2024-2029 (%)
Data Table on Production optimization - Year-over-year growth 2024-2029 (%)

9.4 New material innovation - Market size and forecast 2024-2029

Chart on New material innovation - Market size and forecast 2024-2029 ($ million)
Data Table on New material innovation - Market size and forecast 2024-2029 ($ million)
Chart on New material innovation - Year-over-year growth 2024-2029 (%)
Data Table on New material innovation - Year-over-year growth 2024-2029 (%)

9.5 Operational process management - Market size and forecast 2024-2029

Chart on Operational process management - Market size and forecast 2024-2029 ($ million)
Data Table on Operational process management - Market size and forecast 2024-2029 ($ million)
Chart on Operational process management - Year-over-year growth 2024-2029 (%)
Data Table on Operational process management - Year-over-year growth 2024-2029 (%)

9.6 Pricing optimization - Market size and forecast 2024-2029

Chart on Pricing optimization - Market size and forecast 2024-2029 ($ million)
Data Table on Pricing optimization - Market size and forecast 2024-2029 ($ million)
Chart on Pricing optimization - Year-over-year growth 2024-2029 (%)
Data Table on Pricing optimization - Year-over-year growth 2024-2029 (%)

9.7 Market opportunity by Application

Market opportunity by Application ($ million)
Data Table on Market opportunity by Application ($ million)

10. Customer Landscape

10.1 Customer landscape overview

Analysis of price sensitivity, lifecycle, customer purchase basket, adoption rates, and purchase criteria

11. Geographic Landscape

11.1 Geographic segmentation

Chart on Market share by geography 2024-2029 (%)
Data Table on Market share by geography 2024-2029 (%)

11.2 Geographic comparison

Chart on Geographic comparison
Data Table on Geographic comparison

11.3 North America - Market size and forecast 2024-2029

Chart on North America - Market size and forecast 2024-2029 ($ million)
Data Table on North America - Market size and forecast 2024-2029 ($ million)
Chart on North America - Year-over-year growth 2024-2029 (%)
Data Table on North America - Year-over-year growth 2024-2029 (%)
Chart on Regional Comparison - North America
Data Table on Regional Comparison - North America

11.3.1 US - Market size and forecast 2024-2029

Chart on US - Market size and forecast 2024-2029 ($ million)
Data Table on US - Market size and forecast 2024-2029 ($ million)
Chart on US - Year-over-year growth 2024-2029 (%)
Data Table on US - Year-over-year growth 2024-2029 (%)

11.3.2 Canada - Market size and forecast 2024-2029

Chart on Canada - Market size and forecast 2024-2029 ($ million)
Data Table on Canada - Market size and forecast 2024-2029 ($ million)
Chart on Canada - Year-over-year growth 2024-2029 (%)
Data Table on Canada - Year-over-year growth 2024-2029 (%)

11.3.3 Mexico - Market size and forecast 2024-2029

Chart on Mexico - Market size and forecast 2024-2029 ($ million)
Data Table on Mexico - Market size and forecast 2024-2029 ($ million)
Chart on Mexico - Year-over-year growth 2024-2029 (%)
Data Table on Mexico - Year-over-year growth 2024-2029 (%)

11.4 APAC - Market size and forecast 2024-2029

Chart on APAC - Market size and forecast 2024-2029 ($ million)
Data Table on APAC - Market size and forecast 2024-2029 ($ million)
Chart on APAC - Year-over-year growth 2024-2029 (%)
Data Table on APAC - Year-over-year growth 2024-2029 (%)
Chart on Regional Comparison - APAC
Data Table on Regional Comparison - APAC

11.4.1 China - Market size and forecast 2024-2029

Chart on China - Market size and forecast 2024-2029 ($ million)
Data Table on China - Market size and forecast 2024-2029 ($ million)
Chart on China - Year-over-year growth 2024-2029 (%)
Data Table on China - Year-over-year growth 2024-2029 (%)

11.4.2 Japan - Market size and forecast 2024-2029

Chart on Japan - Market size and forecast 2024-2029 ($ million)
Data Table on Japan - Market size and forecast 2024-2029 ($ million)
Chart on Japan - Year-over-year growth 2024-2029 (%)
Data Table on Japan - Year-over-year growth 2024-2029 (%)

11.4.3 Australia - Market size and forecast 2024-2029

Chart on Australia - Market size and forecast 2024-2029 ($ million)
Data Table on Australia - Market size and forecast 2024-2029 ($ million)
Chart on Australia - Year-over-year growth 2024-2029 (%)
Data Table on Australia - Year-over-year growth 2024-2029 (%)

11.4.4 India - Market size and forecast 2024-2029

Chart on India - Market size and forecast 2024-2029 ($ million)
Data Table on India - Market size and forecast 2024-2029 ($ million)
Chart on India - Year-over-year growth 2024-2029 (%)
Data Table on India - Year-over-year growth 2024-2029 (%)

11.4.5 South Korea - Market size and forecast 2024-2029

Chart on South Korea - Market size and forecast 2024-2029 ($ million)
Data Table on South Korea - Market size and forecast 2024-2029 ($ million)
Chart on South Korea - Year-over-year growth 2024-2029 (%)
Data Table on South Korea - Year-over-year growth 2024-2029 (%)

11.4.6 Indonesia - Market size and forecast 2024-2029

Chart on Indonesia - Market size and forecast 2024-2029 ($ million)
Data Table on Indonesia - Market size and forecast 2024-2029 ($ million)
Chart on Indonesia - Year-over-year growth 2024-2029 (%)
Data Table on Indonesia - Year-over-year growth 2024-2029 (%)

11.5 Europe - Market size and forecast 2024-2029

Chart on Europe - Market size and forecast 2024-2029 ($ million)
Data Table on Europe - Market size and forecast 2024-2029 ($ million)
Chart on Europe - Year-over-year growth 2024-2029 (%)
Data Table on Europe - Year-over-year growth 2024-2029 (%)
Chart on Regional Comparison - Europe
Data Table on Regional Comparison - Europe

11.5.1 Germany - Market size and forecast 2024-2029

Chart on Germany - Market size and forecast 2024-2029 ($ million)
Data Table on Germany - Market size and forecast 2024-2029 ($ million)
Chart on Germany - Year-over-year growth 2024-2029 (%)
Data Table on Germany - Year-over-year growth 2024-2029 (%)

11.5.2 UK - Market size and forecast 2024-2029

Chart on UK - Market size and forecast 2024-2029 ($ million)
Data Table on UK - Market size and forecast 2024-2029 ($ million)
Chart on UK - Year-over-year growth 2024-2029 (%)
Data Table on UK - Year-over-year growth 2024-2029 (%)

11.5.3 France - Market size and forecast 2024-2029

Chart on France - Market size and forecast 2024-2029 ($ million)
Data Table on France - Market size and forecast 2024-2029 ($ million)
Chart on France - Year-over-year growth 2024-2029 (%)
Data Table on France - Year-over-year growth 2024-2029 (%)

11.5.4 The Netherlands - Market size and forecast 2024-2029

Chart on The Netherlands - Market size and forecast 2024-2029 ($ million)
Data Table on The Netherlands - Market size and forecast 2024-2029 ($ million)
Chart on The Netherlands - Year-over-year growth 2024-2029 (%)
Data Table on The Netherlands - Year-over-year growth 2024-2029 (%)

11.5.5 Italy - Market size and forecast 2024-2029

Chart on Italy - Market size and forecast 2024-2029 ($ million)
Data Table on Italy - Market size and forecast 2024-2029 ($ million)
Chart on Italy - Year-over-year growth 2024-2029 (%)
Data Table on Italy - Year-over-year growth 2024-2029 (%)

11.5.6 Spain - Market size and forecast 2024-2029

Chart on Spain - Market size and forecast 2024-2029 ($ million)
Data Table on Spain - Market size and forecast 2024-2029 ($ million)
Chart on Spain - Year-over-year growth 2024-2029 (%)
Data Table on Spain - Year-over-year growth 2024-2029 (%)

11.6 South America - Market size and forecast 2024-2029

Chart on South America - Market size and forecast 2024-2029 ($ million)
Data Table on South America - Market size and forecast 2024-2029 ($ million)
Chart on South America - Year-over-year growth 2024-2029 (%)
Data Table on South America - Year-over-year growth 2024-2029 (%)
Chart on Regional Comparison - South America
Data Table on Regional Comparison - South America

11.6.1 Brazil - Market size and forecast 2024-2029

Chart on Brazil - Market size and forecast 2024-2029 ($ million)
Data Table on Brazil - Market size and forecast 2024-2029 ($ million)
Chart on Brazil - Year-over-year growth 2024-2029 (%)
Data Table on Brazil - Year-over-year growth 2024-2029 (%)

11.6.2 Argentina - Market size and forecast 2024-2029

Chart on Argentina - Market size and forecast 2024-2029 ($ million)
Data Table on Argentina - Market size and forecast 2024-2029 ($ million)
Chart on Argentina - Year-over-year growth 2024-2029 (%)
Data Table on Argentina - Year-over-year growth 2024-2029 (%)

11.6.3 Colombia - Market size and forecast 2024-2029

Chart on Colombia - Market size and forecast 2024-2029 ($ million)
Data Table on Colombia - Market size and forecast 2024-2029 ($ million)
Chart on Colombia - Year-over-year growth 2024-2029 (%)
Data Table on Colombia - Year-over-year growth 2024-2029 (%)

11.7 Middle East and Africa - Market size and forecast 2024-2029

Chart on Middle East and Africa - Market size and forecast 2024-2029 ($ million)
Data Table on Middle East and Africa - Market size and forecast 2024-2029 ($ million)
Chart on Middle East and Africa - Year-over-year growth 2024-2029 (%)
Data Table on Middle East and Africa - Year-over-year growth 2024-2029 (%)
Chart on Regional Comparison - Middle East and Africa
Data Table on Regional Comparison - Middle East and Africa

11.7.1 Saudi Arabia - Market size and forecast 2024-2029

Chart on Saudi Arabia - Market size and forecast 2024-2029 ($ million)
Data Table on Saudi Arabia - Market size and forecast 2024-2029 ($ million)
Chart on Saudi Arabia - Year-over-year growth 2024-2029 (%)
Data Table on Saudi Arabia - Year-over-year growth 2024-2029 (%)

11.7.2 UAE - Market size and forecast 2024-2029

Chart on UAE - Market size and forecast 2024-2029 ($ million)
Data Table on UAE - Market size and forecast 2024-2029 ($ million)
Chart on UAE - Year-over-year growth 2024-2029 (%)
Data Table on UAE - Year-over-year growth 2024-2029 (%)

11.7.3 South Africa - Market size and forecast 2024-2029

Chart on South Africa - Market size and forecast 2024-2029 ($ million)
Data Table on South Africa - Market size and forecast 2024-2029 ($ million)
Chart on South Africa - Year-over-year growth 2024-2029 (%)
Data Table on South Africa - Year-over-year growth 2024-2029 (%)

11.7.4 Israel - Market size and forecast 2024-2029

Chart on Israel - Market size and forecast 2024-2029 ($ million)
Data Table on Israel - Market size and forecast 2024-2029 ($ million)
Chart on Israel - Year-over-year growth 2024-2029 (%)
Data Table on Israel - Year-over-year growth 2024-2029 (%)

11.7.5 Turkey - Market size and forecast 2024-2029

Chart on Turkey - Market size and forecast 2024-2029 ($ million)
Data Table on Turkey - Market size and forecast 2024-2029 ($ million)
Chart on Turkey - Year-over-year growth 2024-2029 (%)
Data Table on Turkey - Year-over-year growth 2024-2029 (%)

11.8 Market opportunity by geography

Market opportunity by geography ($ million)
Data Tables on Market opportunity by geography ($ million)

12. Drivers, Challenges, and Opportunity

12.1 Market drivers

Optimization of production processes and operational efficiency
Accelerated research and development of novel materials and formulations
Enhanced sustainability and safety protocols

12.2 Market challenges

High upfront investment and integration complexity
Data security, privacy, and intellectual property risks
Shortage of skilled talent and workforce readiness

12.3 Impact of drivers and challenges

Impact of drivers and challenges in 2024 and 2029

12.4 Market opportunities

AI-driven process optimization and predictive maintenance
Accelerated materials discovery and product development with generative AI
Integration of AI with digital twins for enhanced operational visibility and control

13. Competitive Landscape

13.1 Overview

13.2

Overview on criticality of inputs and factors of differentiation

13.3 Landscape disruption

Overview on factors of disruption

13.4 Industry risks

Impact of key risks on business

14. Competitive Analysis

14.1 Companies profiled

Companies covered

14.2 Company ranking index

14.3 Market positioning of companies

Matrix on companies position and classification

14.4 Accenture PLC

Accenture PLC - Overview
Accenture PLC - Business segments
Accenture PLC - Key news
Accenture PLC - Key offerings
Accenture PLC - Segment focus
SWOT

14.5 Aionics Inc.

Aionics Inc. - Overview
Aionics Inc. - Product / Service
Aionics Inc. - Key offerings
SWOT

14.6 Arzeda Corp.

Arzeda Corp. - Overview
Arzeda Corp. - Product / Service
Arzeda Corp. - Key offerings
SWOT

14.7 BASF SE

BASF SE - Overview
BASF SE - Business segments
BASF SE - Key news
BASF SE - Key offerings
BASF SE - Segment focus
SWOT

14.8 ChemAI Ltd.

ChemAI Ltd. - Overview
ChemAI Ltd. - Product / Service
ChemAI Ltd. - Key offerings
SWOT

14.9 Citrine Informatics Inc.

Citrine Informatics Inc. - Overview
Citrine Informatics Inc. - Product / Service
Citrine Informatics Inc. - Key offerings
SWOT

14.10 Evonik Industries AG

Evonik Industries AG - Overview
Evonik Industries AG - Business segments
Evonik Industries AG - Key news
Evonik Industries AG - Key offerings
Evonik Industries AG - Segment focus
SWOT

14.11 Google LLC

Google LLC - Overview
Google LLC - Product / Service
Google LLC - Key offerings
SWOT

14.12 Honeywell International Inc.

Honeywell International Inc. - Overview
Honeywell International Inc. - Business segments
Honeywell International Inc. - Key news
Honeywell International Inc. - Key offerings
Honeywell International Inc. - Segment focus
SWOT

14.13 Insilico Medicine

Insilico Medicine - Overview
Insilico Medicine - Product / Service
Insilico Medicine - Key offerings
SWOT

14.14 IBM Corp.

IBM Corp. - Overview
IBM Corp. - Business segments
IBM Corp. - Key news
IBM Corp. - Key offerings
IBM Corp. - Segment focus
SWOT

14.15 Microsoft Corp.

Microsoft Corp. - Overview
Microsoft Corp. - Business segments
Microsoft Corp. - Key news
Microsoft Corp. - Key offerings
Microsoft Corp. - Segment focus
SWOT

14.16 NVIDIA Corp.

NVIDIA Corp. - Overview
NVIDIA Corp. - Business segments
NVIDIA Corp. - Key news
NVIDIA Corp. - Key offerings
NVIDIA Corp. - Segment focus
SWOT

14.17 Schlumberger Ltd.

Schlumberger Ltd. - Overview
Schlumberger Ltd. - Business segments
Schlumberger Ltd. - Key news
Schlumberger Ltd. - Key offerings
Schlumberger Ltd. - Segment focus
SWOT

14.18 Siemens AG

Siemens AG - Overview
Siemens AG - Business segments
Siemens AG - Key news
Siemens AG - Key offerings
Siemens AG - Segment focus
SWOT

15. Appendix

15.1 Scope of the report

Market definition
Objectives
Notes and caveats

15.2 Inclusions and exclusions checklist

Inclusions checklist
Exclusions checklist

15.3 Currency conversion rates for US$

15.4 Research methodology

15.5 Data procurement

Information sources

15.6 Data validation

15.7 Validation techniques employed for market sizing

15.8 Data synthesis

15.9 360 degree market analysis

15.10 List of abbreviations

Research Methodology

Technavio presents a detailed picture of the market by way of study, synthesis, and summation of data from multiple sources. The analysts have presented the various facets of the market with a particular focus on identifying the key industry influencers. The data thus presented is comprehensive, reliable, and the result of extensive research, both primary and secondary.

INFORMATION SOURCES

Primary sources

  • Manufacturers and suppliers
  • Channel partners
  • Industry experts
  • Strategic decision makers

Secondary sources

  • Industry journals and periodicals
  • Government data
  • Financial reports of key industry players
  • Historical data
  • Press releases

DATA ANALYSIS

Data Synthesis

  • Collation of data
  • Estimation of key figures
  • Analysis of derived insights

Data Validation

  • Triangulation with data models
  • Reference against proprietary databases
  • Corroboration with industry experts

REPORT WRITING

Qualitative

  • Market drivers
  • Market challenges
  • Market trends
  • Five forces analysis

Quantitative

  • Market size and forecast
  • Market segmentation
  • Geographical insights
  • Competitive landscape

Interested in this report?

Get your sample now to see our research methodology and insights!

Download Now

Frequently Asked Questions

Ai-based Chemical Manufacturing market growth will increase by USD 10289.3 million during 2025-2029.

The Ai-based Chemical Manufacturing market is expected to grow at a CAGR of 41.4% during 2025-2029.

Ai-based Chemical Manufacturing market is segmented by Type (Software, Services) End-user (Chemicals and petrochemicals, Specialty chemicals, Agricultural chemicals) Application (Production optimization, New material innovation, Operational process management, Pricing optimization)

Accenture PLC, Aionics Inc., Albert Invent Corp., Arzeda Corp., AVEVA Group Plc, BASF SE, ChemAI Ltd., Citrine Informatics Inc., Evonik Industries AG, Google LLC, Honeywell International Inc., Insilico Medicine, IBM Corp., Kebotix Inc., Microsoft Corp., NVIDIA Corp., Schlumberger Ltd., Siemens AG are a few of the key vendors in the Ai-based Chemical Manufacturing market.

North America will register the highest growth rate of 37% among the other regions. Therefore, the Ai-based Chemical Manufacturing market in North America is expected to garner significant business opportunities for the vendors during the forecast period.

US, Canada, Mexico, China, Japan, Australia, India, South Korea, Indonesia, Germany, UK, France, The Netherlands, Italy, Spain, Brazil, Argentina, Colombia, Saudi Arabia, UAE, South Africa, Israel, Turkey

  • Optimization of production processes and operational efficiency is the driving factor this market.

The Ai-based Chemical Manufacturing market vendors should focus on grabbing business opportunities from the Type segment as it accounted for the largest market share in the base year.