Ai-based Climate Modelling Market Analysis, Size, and Forecast 2025-2029: APAC (China, Japan, and India), North America (US, Canada, and Mexico), Europe (UK, Germany, and France), Middle East and Africa (South Africa, UAE, and Saudi Arabia), South America (Brazil, Argentina, and Colombia), and Rest of World (ROW)

Ai-based Climate Modelling Market Analysis, Size, and Forecast 2025-2029:
APAC (China, Japan, and India), North America (US, Canada, and Mexico), Europe (UK, Germany, and France), Middle East and Africa (South Africa, UAE, and Saudi Arabia), South America (Brazil, Argentina, and Colombia), and Rest of World (ROW)

Published: Dec 2025 303 Pages SKU: IRTNTR80993

Market Overview at a Glance

$497.32 Mn
Market Opportunity
20%
CAGR 2024 - 2029
31.4%
APAC Growth
$179.01 Mn
Software segment 2023

Ai-based Climate Modelling Market Size 2025-2029

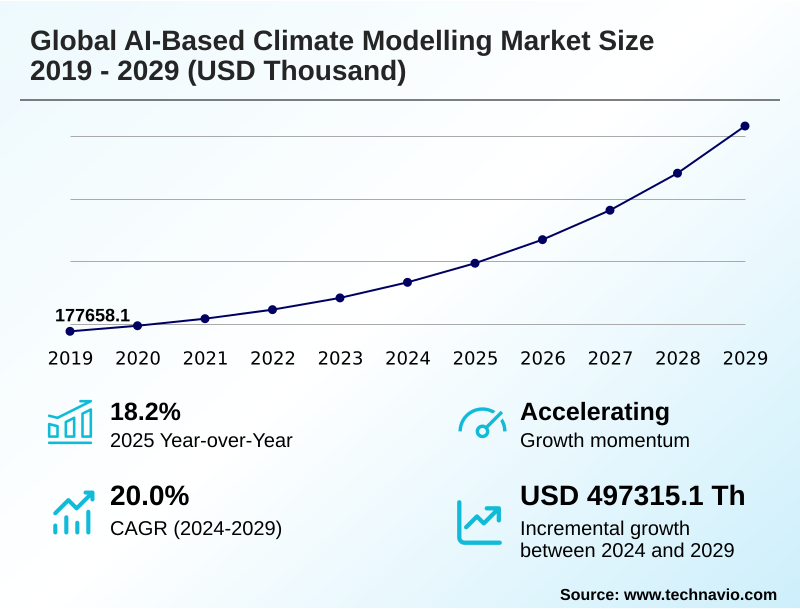
The ai-based climate modelling market size is valued to increase by USD 497.32 million, at a CAGR of 20% from 2024 to 2029. Escalating demand for enhanced accuracy and granularity in climate projections will drive the ai-based climate modelling market.

Major Market Trends & Insights

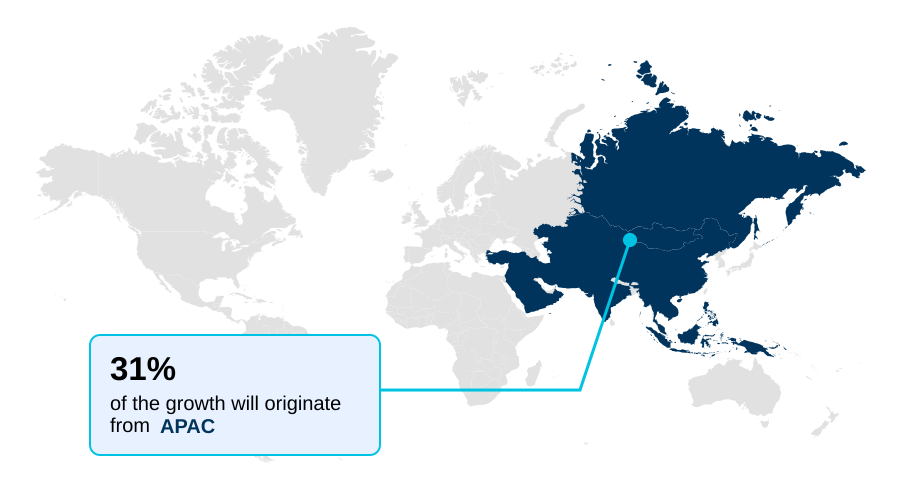
  • APAC dominated the market and accounted for a 31.4% growth during the forecast period.
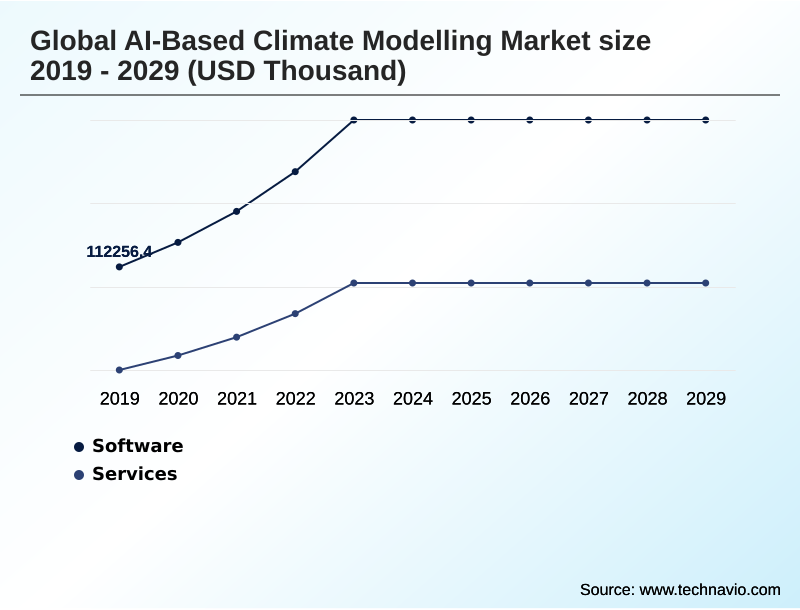
  • By Component - Software segment was valued at USD 179.01 million in 2023
  • By Technology - Machine learning segment accounted for the largest market revenue share in 2023

Market Size & Forecast

  • Market Opportunities:
  • Market Future Opportunities: USD 497.32 million
  • CAGR from 2024 to 2029 : 20%

Market Summary

  • The AI-based climate modelling market is expanding rapidly, driven by the critical need for more precise and actionable climate projections. This expansion is facilitated by advancements in deep learning and computational power, which enable the analysis of massive, complex datasets from satellites and sensors.
  • A primary trend is the development of generative AI and digital twins, which offer faster, higher-resolution simulations than traditional physics-based models. These innovations are crucial for applications ranging from hyperlocal weather forecasting to long-term climate scenario analysis.
  • However, significant challenges persist, including the scarcity of high-quality training data, the immense computational cost of sophisticated models, and the 'black box' problem of model interpretability.
  • For instance, an insurance firm can leverage AI-enhanced models for granular risk assessment, using predictive analytics to more accurately price policies against the rising frequency of extreme weather events, thereby improving portfolio resilience without relying on coarse, traditional methods. This shift toward AI-driven insights underscores the market's role in translating complex climate science into strategic business decisions.
  • The market's evolution is marked by increasing investment and cross-sector collaborations aimed at making these powerful tools more accessible and trustworthy for global climate action.

What will be the Size of the Ai-based Climate Modelling Market during the forecast period?

Get Key Insights on Market Forecast (PDF) Request Free Sample

How is the Ai-based Climate Modelling Market Segmented?

The ai-based climate modelling industry research report provides comprehensive data (region-wise segment analysis), with forecasts and estimates in "USD thousand" for the period 2025-2029, as well as historical data from 2019-2023 for the following segments.

  • Component
    • Software
    • Services
  • Technology
    • Machine learning
    • Deep learning
    • NLP
    • Computer vision
    • Reinforcement learning
  • Application
    • Weather forecasting and early warning systems
    • Climate change prediction and long-term modelling
    • Carbon footprint and emission monitoring
    • Disaster risk management
    • Others
  • Geography
    • APAC
      • China
      • Japan
      • India
    • North America
      • US
      • Canada
      • Mexico
    • Europe
      • UK
      • Germany
      • France
    • Middle East and Africa
      • South Africa
      • UAE
      • Saudi Arabia
    • South America
      • Brazil
      • Argentina
      • Colombia
    • Rest of World (ROW)

By Component Insights

The software segment is estimated to witness significant growth during the forecast period.

The software segment is central to the AI-based climate modelling market, driven by demand for advanced tools delivering real-time, high-resolution climate forecasting.

The core of this segment is sophisticated AI-powered climate intelligence platforms that process vast environmental datasets for accurate climate simulations and risk assessments.

Innovations include the development of generative AI climate simulation and digital twin earth modeling, enabling more granular analysis. These tools are critical for applications like AI-driven disaster risk management and AI for sustainable agriculture.

Recent advancements show models achieving simulation speeds 1,000 times faster than traditional methods, providing critical lead times for extreme weather event prediction.

This enhanced capability in computational climate science, utilizing geospatial foundation models and physics-informed neural networks, supports data-driven environmental monitoring and the creation of specialized AI-based early warning systems.

Request Free Sample

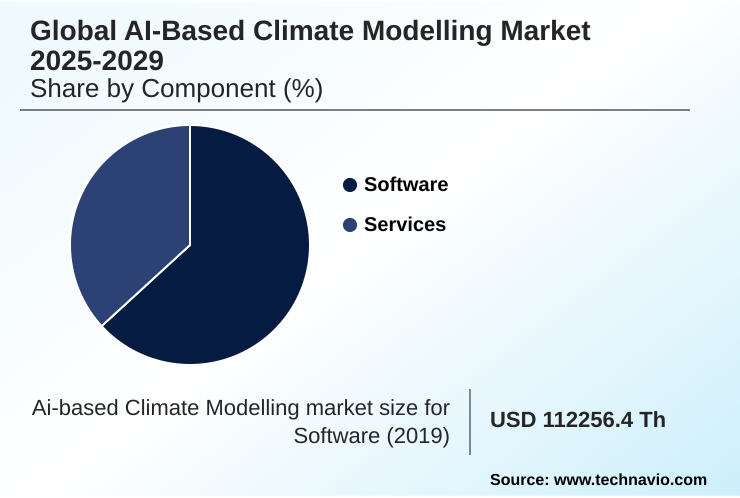
The Software segment was valued at USD 179.01 million in 2023 and showed a gradual increase during the forecast period.

Request Free Sample

Regional Analysis

APAC is estimated to contribute 31.4% to the growth of the global market during the forecast period.Technavio’s analysts have elaborately explained the regional trends and drivers that shape the market during the forecast period.

See How Ai-based Climate Modelling Market Demand is Rising in APAC Request Free Sample

The geographic landscape is led by North America, which accounts for over 27% of the market opportunity, driven by substantial private and public investment in deep learning for climate science.

Europe follows closely, with initiatives focused on creating digital twins for resilient infrastructure planning and AI-based policy optimization.

However, APAC is the fastest-growing region, contributing over 31% to the incremental growth, fueled by the urgent need for hyper-local weather prediction and AI for biodiversity tracking to manage climate vulnerability.

Regional adoption is varied, with advanced economies deploying AI-based emissions monitoring and AI-powered decarbonization analytics. Developing regions are increasingly adopting AI for computer vision for land use change detection and natural language processing climate analysis, supported by global collaborations.

This distribution highlights a global shift toward leveraging environmental intelligence platforms for strategic climate action.

Market Dynamics

Our researchers analyzed the data with 2024 as the base year, along with the key drivers, trends, and challenges. A holistic analysis of drivers will help companies refine their marketing strategies to gain a competitive advantage.

  • The AI-based climate modelling market is defined by its capacity to translate complex environmental data into strategic assets for enterprise planning. The adoption of generative AI for high-resolution simulations is enabling businesses to move beyond static risk assessments toward dynamic scenario planning.
  • For instance, the use of a digital twin for climate scenario analysis allows organizations to model future operational disruptions with greater precision. This is particularly evident in the increasing reliance on AI-based models for extreme weather prediction, which now inform insurance and logistics frameworks.
  • The shift toward machine learning for hyperlocal weather forecasting is transforming agriculture, while deep learning for long-term climate projections is becoming essential for capital-intensive infrastructure investments. Specialized applications are also maturing; computer vision for glacier monitoring provides critical data for water resource management, and NLP for climate policy analysis helps organizations navigate complex regulatory landscapes.
  • The use of AI tools for carbon footprint monitoring and automated reporting of Scope 3 emissions is streamlining sustainability compliance. For example, companies leveraging these automated tools have reported a significant reduction in the time required for compliance reporting compared to manual methods. Reinforcement learning for climate adaptation policies and AI-powered disaster risk management systems are enhancing public sector resilience.
  • Concurrently, geospatial foundation models for land use and AI-driven analytics for climate resilience are being integrated into urban planning. The accessibility of cloud platforms for AI climate modeling, combined with GPU acceleration in climate prediction, is democratizing access to these powerful tools. This is fostering innovation in areas like AI-based agricultural resilience tools and predictive analytics for supply chain risk.
  • The integration of AI for optimizing renewable energy integration within hybrid models for climate forecasting and real-time AI for environmental intelligence marks a new era of proactive and data-driven climate strategy.

What are the key market drivers leading to the rise in the adoption of Ai-based Climate Modelling Industry?

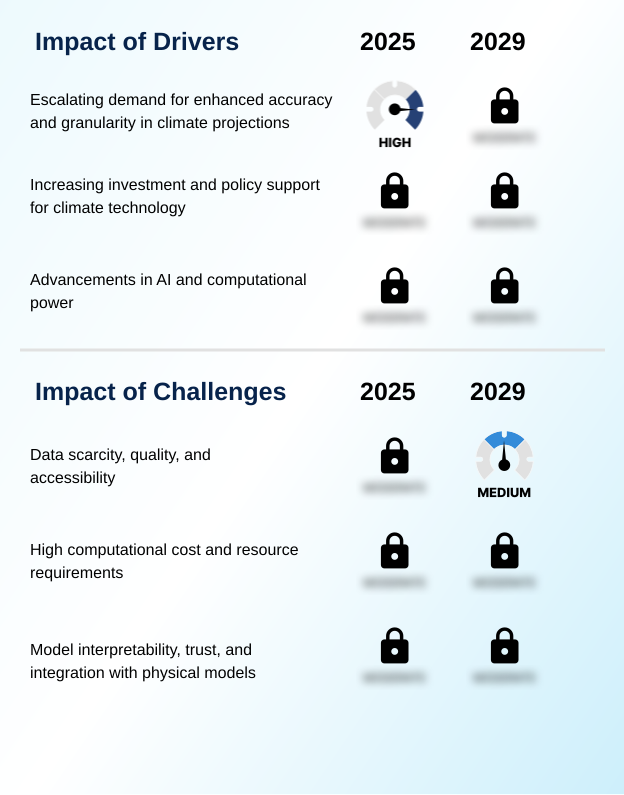
  • The escalating demand for enhanced accuracy and granularity in climate projections is a key driver propelling market growth.

  • Market growth is primarily driven by the escalating demand for more accurate and granular climate projections. Advancements in GPU-accelerated climate simulation and the availability of cloud-based climate modeling platforms are making sophisticated tools more accessible.
  • These technologies enable the development of AI for climate adaptation strategies and AI-driven supply chain resilience models.
  • Recent developments showcase models that are up to 100 times faster and 1,000 times more energy-efficient than conventional physics-based simulations, highlighting the role of sustainable AI infrastructure.
  • The increasing frequency of extreme weather is also fueling demand for probabilistic climate forecasting and real-time disaster response AI.
  • This is complemented by a surge in public and private investment, supporting the development of hybrid physics-ML models and explainable AI for climate science to build trust and drive wider adoption.

What are the market trends shaping the Ai-based Climate Modelling Industry?

  • The emergence of generative AI and the development of sophisticated digital twins for climate modeling represent a significant upcoming market trend. This shift enables faster, more accurate, and higher-resolution simulations.

  • A primary trend is the emergence of generative AI and digital twins, which are revolutionizing climate modeling by enabling faster and more accurate simulations. These technologies facilitate real-time environmental data processing and climate model data downscaling to produce high-resolution, hyperlocal forecasts. For example, some models can generate a ten-day forecast in under a minute, significantly outperforming traditional systems.
  • The development of AI for urban infrastructure resilience and AI-optimized renewable energy grids is another key trend, driven by the need for smarter resource management. The market is also seeing increased investment in predictive analytics for crop yields, with models demonstrating improved accuracy by over 15% in some applications.
  • Advances in AI model interpretability techniques and multi-agent reinforcement learning are addressing challenges of trust and strategic decision-making, making these powerful tools more applicable for business planning.

What challenges does the Ai-based Climate Modelling Industry face during its growth?

  • Data scarcity, inconsistent quality, and limited accessibility present a key challenge that affects the industry's growth trajectory.

  • Despite its rapid growth, the market faces significant challenges. Data scarcity and quality remain primary obstacles, as the effectiveness of AI models depends on vast, high-quality datasets, which are often unavailable in many regions. The high computational cost associated with high-performance computing for AI creates substantial barriers to entry.
  • For example, training a single advanced model can require a cluster of 32 specialized chips running for four weeks, raising concerns about the energy consumption of sustainable AI infrastructure. Furthermore, the 'black box' nature of many deep learning models presents a major hurdle.
  • The lack of transparency makes AI model interpretability techniques and explainable AI for climate science critical for building trust among scientists and policymakers, hindering the integration of these models into critical decision-making frameworks.

Exclusive Technavio Analysis on Customer Landscape

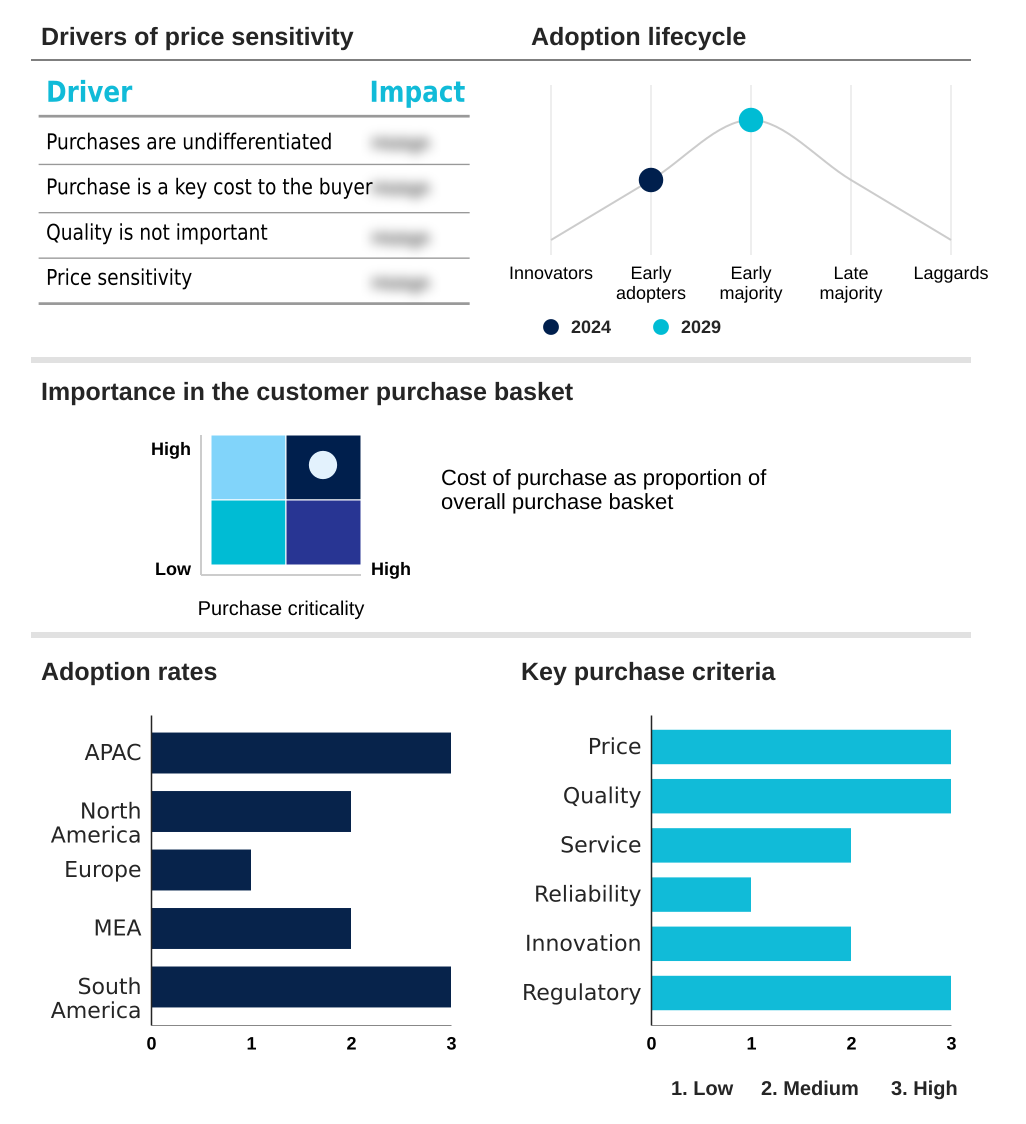
The ai-based climate modelling market forecasting report includes the adoption lifecycle of the market, covering from the innovator’s stage to the laggard’s stage. It focuses on adoption rates in different regions based on penetration. Furthermore, the ai-based climate modelling market report also includes key purchase criteria and drivers of price sensitivity to help companies evaluate and develop their market growth analysis strategies.

Customer Landscape of Ai-based Climate Modelling Industry

Competitive Landscape

Companies are implementing various strategies, such as strategic alliances, ai-based climate modelling market forecast, partnerships, mergers and acquisitions, geographical expansion, and product/service launches, to enhance their presence in the industry.

AccuWeather Inc. - Offers AI-driven climate modeling through a digital twin, using probabilistic simulations and stress testing to assess climate risks across extensive asset portfolios.

The industry research and growth report includes detailed analyses of the competitive landscape of the market and information about key companies, including:

  • AccuWeather Inc.
  • Amazon Web Services Inc.
  • Arundo Analytics Inc.
  • Atmo Inc.
  • ClimateAi. inc.
  • DTN LLC
  • Google LLC
  • IBM Corp.
  • Jupiter Intelligence. Inc
  • Meteomatics Group
  • Microsoft Corp.
  • NVIDIA Corp.
  • SAS Institute Inc.
  • Spire Global Inc.
  • The Climate Corp.
  • The Tomorrow Companies Inc.
  • Xacmaz Technology Pvt. Ltd.

Qualitative and quantitative analysis of companies has been conducted to help clients understand the wider business environment as well as the strengths and weaknesses of key industry players. Data is qualitatively analyzed to categorize companies as pure play, category-focused, industry-focused, and diversified; it is quantitatively analyzed to categorize companies as dominant, leading, strong, tentative, and weak.

Recent Development and News in Ai-based climate modelling market

  • In September 2024, G42 and NVIDIA announced a partnership to advance climate technology by developing AI solutions on the NVIDIA Earth-2 platform to significantly improve weather forecasting accuracy.
  • In December 2024, the Allen Institute for AI introduced its AI2 Climate Emulator (ACE), a model capable of simulating approximately 800 years of climate data per day, marking a significant increase in speed and energy efficiency over traditional methods.
  • In February 2025, India's Ministry of Earth Sciences (MoES) announced the integration of AI tools into its district-level hydrological planning and seasonal forecasting systems to enhance climate resilience.
  • In May 2025, ClimateAi launched a new AI model that connects climate and economic data to forecast the impact of extreme weather on consumer spending and business revenue.

Dive into Technavio’s robust research methodology, blending expert interviews, extensive data synthesis, and validated models for unparalleled Ai-based Climate Modelling Market insights. See full methodology.

Market Scope
Page number 303
Base year 2024
Historic period 2019-2023
Forecast period 2025-2029
Growth momentum & CAGR Accelerate at a CAGR of 20%
Market growth 2025-2029 USD 497315.1 thousand
Market structure Fragmented
YoY growth 2024-2025(%) 18.2%
Key countries China, Japan, India, Australia, South Korea, Singapore, US, Canada, Mexico, UK, Germany, France, The Netherlands, Italy, Spain, South Africa, UAE, Saudi Arabia, Nigeria, Egypt, Brazil, Argentina and Colombia
Competitive landscape Leading Companies, Market Positioning of Companies, Competitive Strategies, and Industry Risks

Request Free Sample

Research Analyst Overview

  • The market is undergoing a significant transformation as enterprises integrate sophisticated AI into their strategic planning frameworks. Boardroom decisions on capital allocation and risk management are now directly influenced by insights from AI-enhanced weather simulation and advanced climate-related financial risk assessment tools. The development of generative adversarial networks forecasting and diffusion models for climate patterns is providing unprecedented predictive capabilities.
  • Technologies like graph neural networks weather prediction and convolutional neural network wildfire detection are enabling proactive responses to acute climate threats, fundamentally altering operational protocols for industries from agriculture to energy. Furthermore, the application of AI-based hydrological planning supports more resilient water resource management.
  • The evolution of these models allows for simulations of approximately 800 years of climate data in a single day, a dramatic leap in computational efficiency. This progress is essential for building robust, data-driven strategies that align with long-term sustainability goals and immediate operational imperatives.

What are the Key Data Covered in this Ai-based Climate Modelling Market Research and Growth Report?

  • What is the expected growth of the Ai-based Climate Modelling Market between 2025 and 2029?

    • USD 497.32 million, at a CAGR of 20%

  • What segmentation does the market report cover?

    • The report is segmented by Component (Software, Services), Technology (Machine learning, Deep learning, NLP, Computer vision, Reinforcement learning), Application (Weather forecasting and early warning systems, Climate change prediction and long-term modelling, Carbon footprint and emission monitoring, Disaster risk management, Others) and Geography (APAC, North America, Europe, Middle East and Africa, South America)

  • Which regions are analyzed in the report?

    • APAC, North America, Europe, Middle East and Africa and South America

  • What are the key growth drivers and market challenges?

    • Escalating demand for enhanced accuracy and granularity in climate projections, Data scarcity, quality, and accessibility

  • Who are the major players in the Ai-based Climate Modelling Market?

    • AccuWeather Inc., Amazon Web Services Inc., Arundo Analytics Inc., Atmo Inc., ClimateAi. inc., DTN LLC, Google LLC, IBM Corp., Jupiter Intelligence. Inc, Meteomatics Group, Microsoft Corp., NVIDIA Corp., SAS Institute Inc., Spire Global Inc., The Climate Corp., The Tomorrow Companies Inc. and Xacmaz Technology Pvt. Ltd.

Market Research Insights

  • The market is characterized by a dynamic interplay of technological innovation and increasing regulatory pressure. The adoption of AI-driven resource management and predictive climate impact modeling is becoming standard as organizations seek to mitigate risks.
  • Firms utilizing these technologies report significant operational gains; for instance, some models generate ten-day forecasts in under a minute, a task that previously took hours, representing an efficiency improvement of over 95%. Furthermore, automated emissions reporting platforms now deliver corporate footprint calculations with enhanced accuracy, streamlining compliance. This momentum is supported by climate data integration solutions that unify disparate datasets.
  • As AI for green finance matures and smart city climate solutions become more prevalent, the ability to translate complex environmental data into actionable, cost-effective strategies defines competitive advantage.

We can help! Our analysts can customize this ai-based climate modelling market research report to meet your requirements.

Get in touch

1. Executive Summary

1.1 Market overview

Executive Summary - Chart on Market Overview
Executive Summary - Data Table on Market Overview
Executive Summary - Chart on Global Market Characteristics
Executive Summary - Chart on Market by Geography
Executive Summary - Chart on Market Segmentation by Component
Executive Summary - Chart on Market Segmentation by Technology
Executive Summary - Chart on Market Segmentation by Application
Executive Summary - Chart on Incremental Growth
Executive Summary - Data Table on Incremental Growth
Executive Summary - Chart on Company Market Positioning

2. Technavio Analysis

2.1 Analysis of price sensitivity, lifecycle, customer purchase basket, adoption rates, and purchase criteria

2.2 Criticality of inputs and Factors of differentiation

Chart on Overview on criticality of inputs and factors of differentiation

2.3 Factors of disruption

Chart on Overview on factors of disruption

2.4 Impact of drivers and challenges

Chart on Impact of drivers and challenges in 2024 and 2029

3. Market Landscape

3.1 Market ecosystem

Chart on Parent Market
Data Table on - Parent Market

3.2 Market characteristics

Chart on Market characteristics analysis

3.3 Value chain analysis

Chart on Value chain analysis

4. Market Sizing

4.1 Market definition

Data Table on Offerings of companies included in the market definition

4.2 Market segment analysis

Market segments

4.3 Market size 2024

4.4 Market outlook: Forecast for 2024-2029

Chart on Global - Market size and forecast 2024-2029 ($ thousand)
Data Table on Global - Market size and forecast 2024-2029 ($ thousand)
Chart on Global Market: Year-over-year growth 2024-2029 (%)
Data Table on Global Market: Year-over-year growth 2024-2029 (%)

5. Historic Market Size

5.1 Global AI-Based Climate Modelling Market 2019 - 2023

Historic Market Size - Data Table on Global AI-Based Climate Modelling Market 2019 - 2023 ($ thousand)

5.2 Component segment analysis 2019 - 2023

Historic Market Size - Component Segment 2019 - 2023 ($ thousand)

5.3 Technology segment analysis 2019 - 2023

Historic Market Size - Technology Segment 2019 - 2023 ($ thousand)

5.4 Application segment analysis 2019 - 2023

Historic Market Size - Application Segment 2019 - 2023 ($ thousand)

5.5 Geography segment analysis 2019 - 2023

Historic Market Size - Geography Segment 2019 - 2023 ($ thousand)

5.6 Country segment analysis 2019 - 2023

Historic Market Size - Country Segment 2019 - 2023 ($ thousand)

6. Five Forces Analysis

6.1 Five forces summary

Five forces analysis - Comparison between 2024 and 2029

6.2 Bargaining power of buyers

Bargaining power of buyers - Impact of key factors 2024 and 2029

6.3 Bargaining power of suppliers

Bargaining power of suppliers - Impact of key factors in 2024 and 2029

6.4 Threat of new entrants

Threat of new entrants - Impact of key factors in 2024 and 2029

6.5 Threat of substitutes

Threat of substitutes - Impact of key factors in 2024 and 2029

6.6 Threat of rivalry

Threat of rivalry - Impact of key factors in 2024 and 2029

6.7 Market condition

Chart on Market condition - Five forces 2024 and 2029

7. Market Segmentation by Component

7.1 Market segments

Chart on Component - Market share 2024-2029 (%)
Data Table on Component - Market share 2024-2029 (%)

7.2 Comparison by Component

Chart on Comparison by Component
Data Table on Comparison by Component

7.3 Software - Market size and forecast 2024-2029

Chart on Software - Market size and forecast 2024-2029 ($ thousand)
Data Table on Software - Market size and forecast 2024-2029 ($ thousand)
Chart on Software - Year-over-year growth 2024-2029 (%)
Data Table on Software - Year-over-year growth 2024-2029 (%)

7.4 Services - Market size and forecast 2024-2029

Chart on Services - Market size and forecast 2024-2029 ($ thousand)
Data Table on Services - Market size and forecast 2024-2029 ($ thousand)
Chart on Services - Year-over-year growth 2024-2029 (%)
Data Table on Services - Year-over-year growth 2024-2029 (%)

7.5 Market opportunity by Component

Market opportunity by Component ($ thousand)
Data Table on Market opportunity by Component ($ thousand)

8. Market Segmentation by Technology

8.1 Market segments

Chart on Technology - Market share 2024-2029 (%)
Data Table on Technology - Market share 2024-2029 (%)

8.2 Comparison by Technology

Chart on Comparison by Technology
Data Table on Comparison by Technology

8.3 Machine learning - Market size and forecast 2024-2029

Chart on Machine learning - Market size and forecast 2024-2029 ($ thousand)
Data Table on Machine learning - Market size and forecast 2024-2029 ($ thousand)
Chart on Machine learning - Year-over-year growth 2024-2029 (%)
Data Table on Machine learning - Year-over-year growth 2024-2029 (%)

8.4 Deep learning - Market size and forecast 2024-2029

Chart on Deep learning - Market size and forecast 2024-2029 ($ thousand)
Data Table on Deep learning - Market size and forecast 2024-2029 ($ thousand)
Chart on Deep learning - Year-over-year growth 2024-2029 (%)
Data Table on Deep learning - Year-over-year growth 2024-2029 (%)

8.5 NLP - Market size and forecast 2024-2029

Chart on NLP - Market size and forecast 2024-2029 ($ thousand)
Data Table on NLP - Market size and forecast 2024-2029 ($ thousand)
Chart on NLP - Year-over-year growth 2024-2029 (%)
Data Table on NLP - Year-over-year growth 2024-2029 (%)

8.6 Computer vision - Market size and forecast 2024-2029

Chart on Computer vision - Market size and forecast 2024-2029 ($ thousand)
Data Table on Computer vision - Market size and forecast 2024-2029 ($ thousand)
Chart on Computer vision - Year-over-year growth 2024-2029 (%)
Data Table on Computer vision - Year-over-year growth 2024-2029 (%)

8.7 Reinforcement learning - Market size and forecast 2024-2029

Chart on Reinforcement learning - Market size and forecast 2024-2029 ($ thousand)
Data Table on Reinforcement learning - Market size and forecast 2024-2029 ($ thousand)
Chart on Reinforcement learning - Year-over-year growth 2024-2029 (%)
Data Table on Reinforcement learning - Year-over-year growth 2024-2029 (%)

8.8 Market opportunity by Technology

Market opportunity by Technology ($ thousand)
Data Table on Market opportunity by Technology ($ thousand)

9. Market Segmentation by Application

9.1 Market segments

Chart on Application - Market share 2024-2029 (%)
Data Table on Application - Market share 2024-2029 (%)

9.2 Comparison by Application

Chart on Comparison by Application
Data Table on Comparison by Application

9.3 Weather forecasting and early warning systems - Market size and forecast 2024-2029

Chart on Weather forecasting and early warning systems - Market size and forecast 2024-2029 ($ thousand)
Data Table on Weather forecasting and early warning systems - Market size and forecast 2024-2029 ($ thousand)
Chart on Weather forecasting and early warning systems - Year-over-year growth 2024-2029 (%)
Data Table on Weather forecasting and early warning systems - Year-over-year growth 2024-2029 (%)

9.4 Climate change prediction and long-term modelling - Market size and forecast 2024-2029

Chart on Climate change prediction and long-term modelling - Market size and forecast 2024-2029 ($ thousand)
Data Table on Climate change prediction and long-term modelling - Market size and forecast 2024-2029 ($ thousand)
Chart on Climate change prediction and long-term modelling - Year-over-year growth 2024-2029 (%)
Data Table on Climate change prediction and long-term modelling - Year-over-year growth 2024-2029 (%)

9.5 Carbon footprint and emission monitoring - Market size and forecast 2024-2029

Chart on Carbon footprint and emission monitoring - Market size and forecast 2024-2029 ($ thousand)
Data Table on Carbon footprint and emission monitoring - Market size and forecast 2024-2029 ($ thousand)
Chart on Carbon footprint and emission monitoring - Year-over-year growth 2024-2029 (%)
Data Table on Carbon footprint and emission monitoring - Year-over-year growth 2024-2029 (%)

9.6 Disaster risk management - Market size and forecast 2024-2029

Chart on Disaster risk management - Market size and forecast 2024-2029 ($ thousand)
Data Table on Disaster risk management - Market size and forecast 2024-2029 ($ thousand)
Chart on Disaster risk management - Year-over-year growth 2024-2029 (%)
Data Table on Disaster risk management - Year-over-year growth 2024-2029 (%)

9.7 Others - Market size and forecast 2024-2029

Chart on Others - Market size and forecast 2024-2029 ($ thousand)
Data Table on Others - Market size and forecast 2024-2029 ($ thousand)
Chart on Others - Year-over-year growth 2024-2029 (%)
Data Table on Others - Year-over-year growth 2024-2029 (%)

9.8 Market opportunity by Application

Market opportunity by Application ($ thousand)
Data Table on Market opportunity by Application ($ thousand)

10. Customer Landscape

10.1 Customer landscape overview

Analysis of price sensitivity, lifecycle, customer purchase basket, adoption rates, and purchase criteria

11. Geographic Landscape

11.1 Geographic segmentation

Chart on Market share by geography 2024-2029 (%)
Data Table on Market share by geography 2024-2029 (%)

11.2 Geographic comparison

Chart on Geographic comparison
Data Table on Geographic comparison

11.3 APAC - Market size and forecast 2024-2029

Chart on APAC - Market size and forecast 2024-2029 ($ thousand)
Data Table on APAC - Market size and forecast 2024-2029 ($ thousand)
Chart on APAC - Year-over-year growth 2024-2029 (%)
Data Table on APAC - Year-over-year growth 2024-2029 (%)
Chart on Regional Comparison - APAC
Data Table on Regional Comparison - APAC

11.3.1 China - Market size and forecast 2024-2029

Chart on China - Market size and forecast 2024-2029 ($ thousand)
Data Table on China - Market size and forecast 2024-2029 ($ thousand)
Chart on China - Year-over-year growth 2024-2029 (%)
Data Table on China - Year-over-year growth 2024-2029 (%)

11.3.2 Japan - Market size and forecast 2024-2029

Chart on Japan - Market size and forecast 2024-2029 ($ thousand)
Data Table on Japan - Market size and forecast 2024-2029 ($ thousand)
Chart on Japan - Year-over-year growth 2024-2029 (%)
Data Table on Japan - Year-over-year growth 2024-2029 (%)

11.3.3 India - Market size and forecast 2024-2029

Chart on India - Market size and forecast 2024-2029 ($ thousand)
Data Table on India - Market size and forecast 2024-2029 ($ thousand)
Chart on India - Year-over-year growth 2024-2029 (%)
Data Table on India - Year-over-year growth 2024-2029 (%)

11.3.4 Australia - Market size and forecast 2024-2029

Chart on Australia - Market size and forecast 2024-2029 ($ thousand)
Data Table on Australia - Market size and forecast 2024-2029 ($ thousand)
Chart on Australia - Year-over-year growth 2024-2029 (%)
Data Table on Australia - Year-over-year growth 2024-2029 (%)

11.3.5 South Korea - Market size and forecast 2024-2029

Chart on South Korea - Market size and forecast 2024-2029 ($ thousand)
Data Table on South Korea - Market size and forecast 2024-2029 ($ thousand)
Chart on South Korea - Year-over-year growth 2024-2029 (%)
Data Table on South Korea - Year-over-year growth 2024-2029 (%)

11.3.6 Singapore - Market size and forecast 2024-2029

Chart on Singapore - Market size and forecast 2024-2029 ($ thousand)
Data Table on Singapore - Market size and forecast 2024-2029 ($ thousand)
Chart on Singapore - Year-over-year growth 2024-2029 (%)
Data Table on Singapore - Year-over-year growth 2024-2029 (%)

11.4 North America - Market size and forecast 2024-2029

Chart on North America - Market size and forecast 2024-2029 ($ thousand)
Data Table on North America - Market size and forecast 2024-2029 ($ thousand)
Chart on North America - Year-over-year growth 2024-2029 (%)
Data Table on North America - Year-over-year growth 2024-2029 (%)
Chart on Regional Comparison - North America
Data Table on Regional Comparison - North America

11.4.1 US - Market size and forecast 2024-2029

Chart on US - Market size and forecast 2024-2029 ($ thousand)
Data Table on US - Market size and forecast 2024-2029 ($ thousand)
Chart on US - Year-over-year growth 2024-2029 (%)
Data Table on US - Year-over-year growth 2024-2029 (%)

11.4.2 Canada - Market size and forecast 2024-2029

Chart on Canada - Market size and forecast 2024-2029 ($ thousand)
Data Table on Canada - Market size and forecast 2024-2029 ($ thousand)
Chart on Canada - Year-over-year growth 2024-2029 (%)
Data Table on Canada - Year-over-year growth 2024-2029 (%)

11.4.3 Mexico - Market size and forecast 2024-2029

Chart on Mexico - Market size and forecast 2024-2029 ($ thousand)
Data Table on Mexico - Market size and forecast 2024-2029 ($ thousand)
Chart on Mexico - Year-over-year growth 2024-2029 (%)
Data Table on Mexico - Year-over-year growth 2024-2029 (%)

11.5 Europe - Market size and forecast 2024-2029

Chart on Europe - Market size and forecast 2024-2029 ($ thousand)
Data Table on Europe - Market size and forecast 2024-2029 ($ thousand)
Chart on Europe - Year-over-year growth 2024-2029 (%)
Data Table on Europe - Year-over-year growth 2024-2029 (%)
Chart on Regional Comparison - Europe
Data Table on Regional Comparison - Europe

11.5.1 UK - Market size and forecast 2024-2029

Chart on UK - Market size and forecast 2024-2029 ($ thousand)
Data Table on UK - Market size and forecast 2024-2029 ($ thousand)
Chart on UK - Year-over-year growth 2024-2029 (%)
Data Table on UK - Year-over-year growth 2024-2029 (%)

11.5.2 Germany - Market size and forecast 2024-2029

Chart on Germany - Market size and forecast 2024-2029 ($ thousand)
Data Table on Germany - Market size and forecast 2024-2029 ($ thousand)
Chart on Germany - Year-over-year growth 2024-2029 (%)
Data Table on Germany - Year-over-year growth 2024-2029 (%)

11.5.3 France - Market size and forecast 2024-2029

Chart on France - Market size and forecast 2024-2029 ($ thousand)
Data Table on France - Market size and forecast 2024-2029 ($ thousand)
Chart on France - Year-over-year growth 2024-2029 (%)
Data Table on France - Year-over-year growth 2024-2029 (%)

11.5.4 The Netherlands - Market size and forecast 2024-2029

Chart on The Netherlands - Market size and forecast 2024-2029 ($ thousand)
Data Table on The Netherlands - Market size and forecast 2024-2029 ($ thousand)
Chart on The Netherlands - Year-over-year growth 2024-2029 (%)
Data Table on The Netherlands - Year-over-year growth 2024-2029 (%)

11.5.5 Italy - Market size and forecast 2024-2029

Chart on Italy - Market size and forecast 2024-2029 ($ thousand)
Data Table on Italy - Market size and forecast 2024-2029 ($ thousand)
Chart on Italy - Year-over-year growth 2024-2029 (%)
Data Table on Italy - Year-over-year growth 2024-2029 (%)

11.5.6 Spain - Market size and forecast 2024-2029

Chart on Spain - Market size and forecast 2024-2029 ($ thousand)
Data Table on Spain - Market size and forecast 2024-2029 ($ thousand)
Chart on Spain - Year-over-year growth 2024-2029 (%)
Data Table on Spain - Year-over-year growth 2024-2029 (%)

11.6 Middle East and Africa - Market size and forecast 2024-2029

Chart on Middle East and Africa - Market size and forecast 2024-2029 ($ thousand)
Data Table on Middle East and Africa - Market size and forecast 2024-2029 ($ thousand)
Chart on Middle East and Africa - Year-over-year growth 2024-2029 (%)
Data Table on Middle East and Africa - Year-over-year growth 2024-2029 (%)
Chart on Regional Comparison - Middle East and Africa
Data Table on Regional Comparison - Middle East and Africa

11.6.1 South Africa - Market size and forecast 2024-2029

Chart on South Africa - Market size and forecast 2024-2029 ($ thousand)
Data Table on South Africa - Market size and forecast 2024-2029 ($ thousand)
Chart on South Africa - Year-over-year growth 2024-2029 (%)
Data Table on South Africa - Year-over-year growth 2024-2029 (%)

11.6.2 UAE - Market size and forecast 2024-2029

Chart on UAE - Market size and forecast 2024-2029 ($ thousand)
Data Table on UAE - Market size and forecast 2024-2029 ($ thousand)
Chart on UAE - Year-over-year growth 2024-2029 (%)
Data Table on UAE - Year-over-year growth 2024-2029 (%)

11.6.3 Saudi Arabia - Market size and forecast 2024-2029

Chart on Saudi Arabia - Market size and forecast 2024-2029 ($ thousand)
Data Table on Saudi Arabia - Market size and forecast 2024-2029 ($ thousand)
Chart on Saudi Arabia - Year-over-year growth 2024-2029 (%)
Data Table on Saudi Arabia - Year-over-year growth 2024-2029 (%)

11.6.4 Nigeria - Market size and forecast 2024-2029

Chart on Nigeria - Market size and forecast 2024-2029 ($ thousand)
Data Table on Nigeria - Market size and forecast 2024-2029 ($ thousand)
Chart on Nigeria - Year-over-year growth 2024-2029 (%)
Data Table on Nigeria - Year-over-year growth 2024-2029 (%)

11.6.5 Egypt - Market size and forecast 2024-2029

Chart on Egypt - Market size and forecast 2024-2029 ($ thousand)
Data Table on Egypt - Market size and forecast 2024-2029 ($ thousand)
Chart on Egypt - Year-over-year growth 2024-2029 (%)
Data Table on Egypt - Year-over-year growth 2024-2029 (%)

11.7 South America - Market size and forecast 2024-2029

Chart on South America - Market size and forecast 2024-2029 ($ thousand)
Data Table on South America - Market size and forecast 2024-2029 ($ thousand)
Chart on South America - Year-over-year growth 2024-2029 (%)
Data Table on South America - Year-over-year growth 2024-2029 (%)
Chart on Regional Comparison - South America
Data Table on Regional Comparison - South America

11.7.1 Brazil - Market size and forecast 2024-2029

Chart on Brazil - Market size and forecast 2024-2029 ($ thousand)
Data Table on Brazil - Market size and forecast 2024-2029 ($ thousand)
Chart on Brazil - Year-over-year growth 2024-2029 (%)
Data Table on Brazil - Year-over-year growth 2024-2029 (%)

11.7.2 Argentina - Market size and forecast 2024-2029

Chart on Argentina - Market size and forecast 2024-2029 ($ thousand)
Data Table on Argentina - Market size and forecast 2024-2029 ($ thousand)
Chart on Argentina - Year-over-year growth 2024-2029 (%)
Data Table on Argentina - Year-over-year growth 2024-2029 (%)

11.7.3 Colombia - Market size and forecast 2024-2029

Chart on Colombia - Market size and forecast 2024-2029 ($ thousand)
Data Table on Colombia - Market size and forecast 2024-2029 ($ thousand)
Chart on Colombia - Year-over-year growth 2024-2029 (%)
Data Table on Colombia - Year-over-year growth 2024-2029 (%)

11.8 Market opportunity by geography

Market opportunity by geography ($ thousand)
Data Tables on Market opportunity by geography ($ thousand)

12. Drivers, Challenges, and Opportunity

12.1 Market drivers

Escalating demand for enhanced accuracy and granularity in climate projections
Increasing investment and policy support for climate technology
Advancements in AI and computational power

12.2 Market challenges

Data scarcity, quality, and accessibility
High computational cost and resource requirements
Model interpretability, trust, and integration with physical models

12.3 Impact of drivers and challenges

Impact of drivers and challenges in 2024 and 2029

12.4 Market opportunities

Emergence of generative AI and digital twins in climate modeling
Proliferation of hyper-local weather forecasting and extreme event prediction
Escalating investments and strategic cross-sector collaborations

13. Competitive Landscape

13.1 Overview

13.2

Overview on criticality of inputs and factors of differentiation

13.3 Landscape disruption

Overview on factors of disruption

13.4 Industry risks

Impact of key risks on business

14. Competitive Analysis

14.1 Companies profiled

Companies covered

14.2 Company ranking index

14.3 Market positioning of companies

Matrix on companies position and classification

14.4 Amazon Web Services Inc.

Amazon Web Services Inc. - Overview
Amazon Web Services Inc. - Product / Service
Amazon Web Services Inc. - Key news
Amazon Web Services Inc. - Key offerings
SWOT

14.5 Arundo Analytics Inc.

Arundo Analytics Inc. - Overview
Arundo Analytics Inc. - Product / Service
Arundo Analytics Inc. - Key offerings
SWOT

14.6 Atmo Inc.

Atmo Inc. - Overview
Atmo Inc. - Product / Service
Atmo Inc. - Key offerings
SWOT

14.7 ClimateAi. inc.

ClimateAi. inc. - Overview
ClimateAi. inc. - Product / Service
ClimateAi. inc. - Key offerings
SWOT

14.8 DTN LLC

DTN LLC - Overview
DTN LLC - Product / Service
DTN LLC - Key offerings
SWOT

14.9 Google LLC

Google LLC - Overview
Google LLC - Product / Service
Google LLC - Key offerings
SWOT

14.10 IBM Corp.

IBM Corp. - Overview
IBM Corp. - Business segments
IBM Corp. - Key news
IBM Corp. - Key offerings
IBM Corp. - Segment focus
SWOT

14.11 Jupiter Intelligence. Inc

Jupiter Intelligence. Inc - Overview
Jupiter Intelligence. Inc - Product / Service
Jupiter Intelligence. Inc - Key offerings
SWOT

14.12 Meteomatics Group

Meteomatics Group - Overview
Meteomatics Group - Product / Service
Meteomatics Group - Key offerings
SWOT

14.13 Microsoft Corp.

Microsoft Corp. - Overview
Microsoft Corp. - Business segments
Microsoft Corp. - Key news
Microsoft Corp. - Key offerings
Microsoft Corp. - Segment focus
SWOT

14.14 NVIDIA Corp.

NVIDIA Corp. - Overview
NVIDIA Corp. - Business segments
NVIDIA Corp. - Key news
NVIDIA Corp. - Key offerings
NVIDIA Corp. - Segment focus
SWOT

14.15 Spire Global Inc.

Spire Global Inc. - Overview
Spire Global Inc. - Product / Service
Spire Global Inc. - Key offerings
SWOT

14.16 The Climate Corp.

The Climate Corp. - Overview
The Climate Corp. - Product / Service
The Climate Corp. - Key offerings
SWOT

14.17 The Tomorrow Companies Inc.

The Tomorrow Companies Inc. - Overview
The Tomorrow Companies Inc. - Product / Service
The Tomorrow Companies Inc. - Key offerings
SWOT

14.18 Xacmaz Technology Pvt. Ltd.

Xacmaz Technology Pvt. Ltd. - Overview
Xacmaz Technology Pvt. Ltd. - Product / Service
Xacmaz Technology Pvt. Ltd. - Key offerings
SWOT

15. Appendix

15.1 Scope of the report

Market definition
Objectives
Notes and caveats

15.2 Inclusions and exclusions checklist

Inclusions checklist
Exclusions checklist

15.3 Currency conversion rates for US$

15.4 Research methodology

15.5 Data procurement

Information sources

15.6 Data validation

15.7 Validation techniques employed for market sizing

15.8 Data synthesis

15.9 360 degree market analysis

15.10 List of abbreviations

Research Methodology

Technavio presents a detailed picture of the market by way of study, synthesis, and summation of data from multiple sources. The analysts have presented the various facets of the market with a particular focus on identifying the key industry influencers. The data thus presented is comprehensive, reliable, and the result of extensive research, both primary and secondary.

INFORMATION SOURCES

Primary sources

  • Manufacturers and suppliers
  • Channel partners
  • Industry experts
  • Strategic decision makers

Secondary sources

  • Industry journals and periodicals
  • Government data
  • Financial reports of key industry players
  • Historical data
  • Press releases

DATA ANALYSIS

Data Synthesis

  • Collation of data
  • Estimation of key figures
  • Analysis of derived insights

Data Validation

  • Triangulation with data models
  • Reference against proprietary databases
  • Corroboration with industry experts

REPORT WRITING

Qualitative

  • Market drivers
  • Market challenges
  • Market trends
  • Five forces analysis

Quantitative

  • Market size and forecast
  • Market segmentation
  • Geographical insights
  • Competitive landscape

Interested in this report?

Get your sample now to see our research methodology and insights!

Download Now

Frequently Asked Questions

Ai-based Climate Modelling market growth will increase by USD 497315.1 thousand thousand during 2025-2029.

The Ai-based Climate Modelling market is expected to grow at a CAGR of 20% during 2025-2029.

Ai-based Climate Modelling market is segmented by Component (Software, Services) Technology (Machine learning, Deep learning, NLP, Computer vision, Reinforcement learning) Application (Weather forecasting and early warning systems, Climate change prediction and long-term modelling, Carbon footprint and emission monitoring, Disaster risk management, Others)

AccuWeather Inc., Amazon Web Services Inc., Arundo Analytics Inc., Atmo Inc., ClimateAi. inc., DTN LLC, Google LLC, IBM Corp., Jupiter Intelligence. Inc, Meteomatics Group, Microsoft Corp., NVIDIA Corp., SAS Institute Inc., Spire Global Inc., The Climate Corp., The Tomorrow Companies Inc., Xacmaz Technology Pvt. Ltd. are a few of the key vendors in the Ai-based Climate Modelling market.

APAC will register the highest growth rate of 31.4% among the other regions. Therefore, the Ai-based Climate Modelling market in APAC is expected to garner significant business opportunities for the vendors during the forecast period.

China, Japan, India, Australia, South Korea, Singapore, US, Canada, Mexico, UK, Germany, France, The Netherlands, Italy, Spain, South Africa, UAE, Saudi Arabia, Nigeria, Egypt, Brazil, Argentina, Colombia

  • Escalating demand for enhanced accuracy and granularity in climate projections is the driving factor this market.

The Ai-based Climate Modelling market vendors should focus on grabbing business opportunities from the Component segment as it accounted for the largest market share in the base year.