
AI-Based Image Analysis Market Size 2025-2029
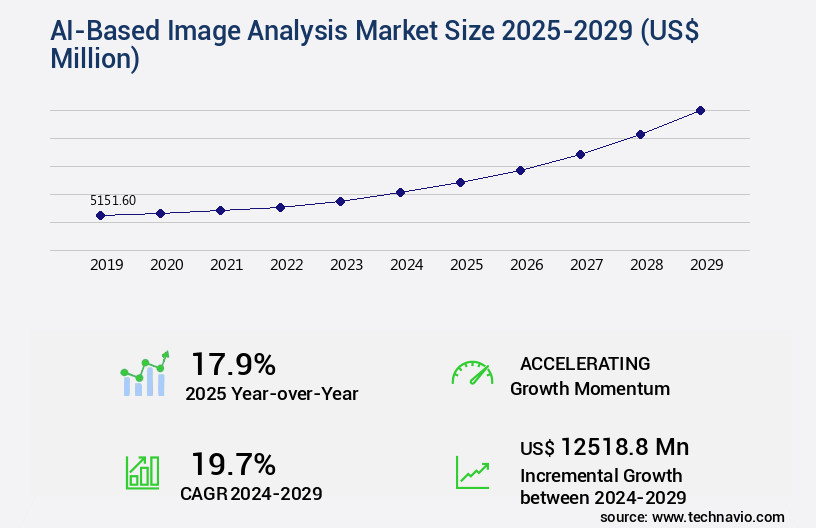
The ai-based image analysis market size is valued to increase USD 12.52 billion, at a CAGR of 19.7% from 2024 to 2029. Proliferation of advanced deep learning architectures and multimodal AI will drive the ai-based image analysis market.
Major Market Trends & Insights
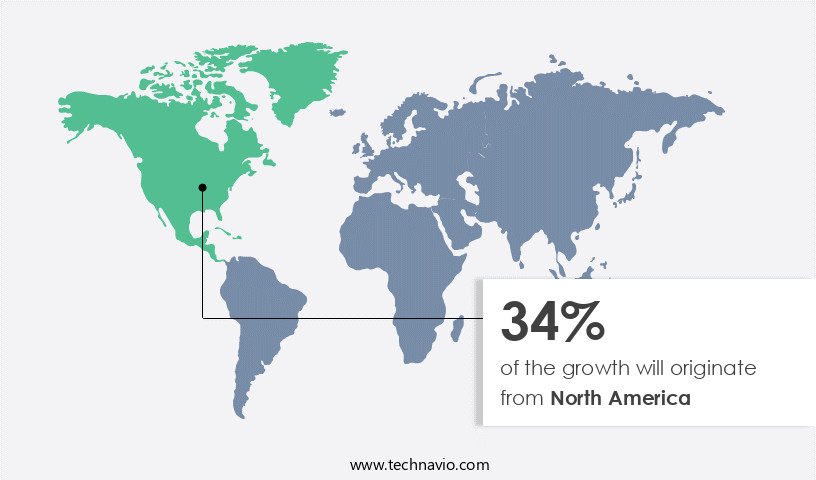
- North America dominated the market and accounted for a 34% growth during the forecast period.
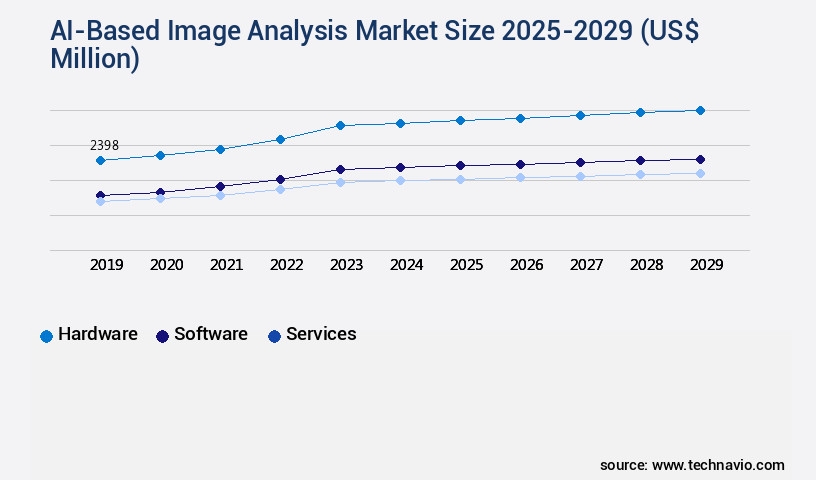
- By Component - Hardware segment was valued at USD 2.4 billion in 2023
- By Technology - Facial recognition segment accounted for the largest market revenue share in 2023
Market Size & Forecast
- Market Opportunities: USD 310.06 million
- Market Future Opportunities: USD 12518.80 million
- CAGR from 2024 to 2029 : 19.7%
Market Summary
- The market is experiencing significant growth, with recent estimates suggesting it will surpass USD15.5 billion by 2025. This expansion is driven by the proliferation of advanced deep learning architectures and multimodal AI, which are revolutionizing diagnostics and patient care through advanced medical imaging. These technologies enable more accurate and efficient analysis of medical images, reducing the need for human intervention and improving overall patient outcomes. However, the market faces challenges, including stringent data privacy regulations and growing security concerns.
- Ensuring patient data remains secure and confidential is a top priority, necessitating robust data protection measures. Despite these challenges, the future of AI-based image analysis is bright, with applications extending beyond healthcare to industries such as retail, manufacturing, and agriculture. As AI continues to evolve, it will enable more precise and automated image analysis, leading to improved decision-making and increased operational efficiency.
What will be the Size of the AI-Based Image Analysis Market during the forecast period?
Get Key Insights on Market Forecast (PDF) Request Free Sample
How is the AI-Based Image Analysis Market Segmented ?
The ai-based image analysis industry research report provides comprehensive data (region-wise segment analysis), with forecasts and estimates in "USD million" for the period 2025-2029, as well as historical data from 2019-2023 for the following segments.
- Component
- Hardware
- Software
- Services
- Technology
- Facial recognition
- Object recognition
- Code recognition
- Optical character recognition
- Pattern recognition
- Application
- Scanning and imaging
- Security and surveillance
- Image search
- Augmented reality
- Marketing and advertising
- End-user
- BFSI
- Media and entertainment
- Retail and e-commerce
- Healthcare
- Others
- Geography
- North America
- US
- Canada
- Europe
- France
- Germany
- Italy
- UK
- APAC
- China
- India
- Japan
- South America
- Brazil
- Rest of World (ROW)
- North America
By Component Insights
The hardware segment is estimated to witness significant growth during the forecast period.
The market is witnessing significant growth, driven by the increasing demand for automated image processing and analysis in various industries. This market encompasses a range of advanced techniques, including image segmentation, feature extraction, and classification methods, which are integral to applications such as defect detection systems, medical image analysis, and satellite imagery processing. Deep learning models, particularly convolutional neural networks, are at the forefront of this innovation, enabling real-time processing, high accuracy, and scalable architectures. GPU computing plays a crucial role in the market, with NVIDIA Corporation leading the charge. GPUs, known for their parallel processing capabilities, are ideal for training large, complex neural networks on extensive datasets.
For instance, GPUs can process thousands of images simultaneously, leading to substantial time savings and improved efficiency. Furthermore, the integration of cloud computing platforms and API integrations facilitates easy access to AI-based image analysis services, while data annotation tools and data augmentation strategies enhance model training pipelines. Precision and recall, F1-score evaluation, and other accuracy metrics are essential for assessing model performance. Object detection algorithms, instance segmentation, and semantic segmentation are key techniques used in image analysis, while transfer learning approaches and pattern recognition systems facilitate the adoption of AI in new applications. Additionally, image enhancement algorithms, noise reduction techniques, and edge computing deployment are crucial for optimizing performance and reducing latency.
According to recent market research, The market is projected to grow at a compound annual growth rate of 25.2% between 2021 and 2028, reaching a value of USD33.5 billion by 2028. This growth is fueled by ongoing advancements in GPU computing, deep learning models, and computer vision systems, as well as the increasing adoption of AI in various industries.
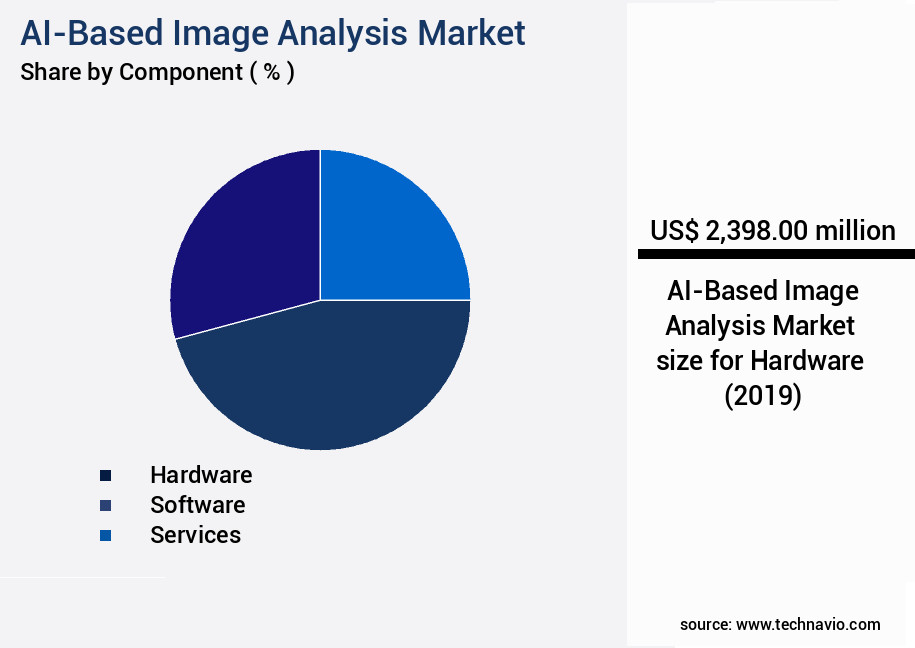
The Hardware segment was valued at USD 2.4 billion in 2019 and showed a gradual increase during the forecast period.
Regional Analysis
North America is estimated to contribute 34% to the growth of the global market during the forecast period.Technavio’s analysts have elaborately explained the regional trends and drivers that shape the market during the forecast period.
See How AI-Based Image Analysis Market Demand is Rising in North America Request Free Sample
The market is experiencing significant growth and evolution, with North America leading the charge. This region, primarily consisting of the United States and Canada, is home to a vast majority of the world's leading technology corporations and a robust venture capital ecosystem that fosters innovation. The region's high adoption rate across various sectors, such as healthcare, retail, and manufacturing, is driven by substantial research and development investments, sophisticated digital infrastructure, and a clear regulatory pathway for AI technologies. The United States, in particular, serves as the global epicenter for AI innovation, with technology giants like NVIDIA, Google, Microsoft, and Amazon Web Services spearheading advancements in cloud computing and semiconductor technology.
These foundational advancements provide the building blocks for complex image analysis models. According to recent reports, the North American market for AI-based image analysis is expected to reach a significant market share, growing at a steady pace. Another study indicates that The market is projected to expand at a compound annual growth rate (CAGR) during the forecast period.
Market Dynamics
Our researchers analyzed the data with 2024 as the base year, along with the key drivers, trends, and challenges. A holistic analysis of drivers will help companies refine their marketing strategies to gain a competitive advantage.
The market is experiencing significant growth due to the increasing demand for automated and accurate image processing solutions across various industries. Deep learning models, such as those used for medical image segmentation, have revolutionized the way we analyze complex medical images, improving diagnostic accuracy and reducing human error. Real-time object detection using convolutional neural networks (CNNs) is another key application of AI in image analysis, enabling businesses to quickly identify and classify objects in real-time. Image classification performance using different architectures, such as ResNet and VGG, continues to be a topic of research and development in the market. Data augmentation techniques, including random cropping, flipping, and rotation, are used to improve model accuracy and reduce overfitting. In the field of satellite data analysis, GPU accelerated image processing pipelines are essential for handling large volumes of high-resolution data. Transfer learning is a popular approach for microscopic image analysis, allowing models to leverage pre-trained weights from larger datasets to improve performance on smaller, specialized datasets. Edge computing deployment for real-time image analysis is also gaining traction, enabling faster processing times and reducing latency. Semantic segmentation using U-Net architecture and instance segmentation with Mask R-CNN are advanced techniques used for comprehensive scene understanding, while panoptic segmentation combines both semantic and instance segmentation for even more detailed analysis. High-resolution image quality assessment metrics and advanced image enhancement techniques for low-light conditions are crucial for ensuring accurate and reliable image analysis in various applications. Defect detection in manufacturing using computer vision and an automated image annotation workflow using machine learning are just a few of the many use cases for AI-based image analysis. Comparison of different feature extraction methods for image recognition, such as SIFT and HOG, is an ongoing research area in the market. Model interpretability and explainability techniques are also gaining importance to help businesses understand how AI models make decisions and build trust in the technology. Developing robust image classification models, optimizing neural networks for faster inference speed, and handling imbalanced datasets in image classification are some of the key challenges and opportunities in the market. Evaluating the performance of image recognition models using metrics such as accuracy, precision, recall, and F1 score is essential for ensuring the effectiveness and reliability of AI-based image analysis solutions.
What are the key market drivers leading to the rise in the adoption of AI-Based Image Analysis Industry?
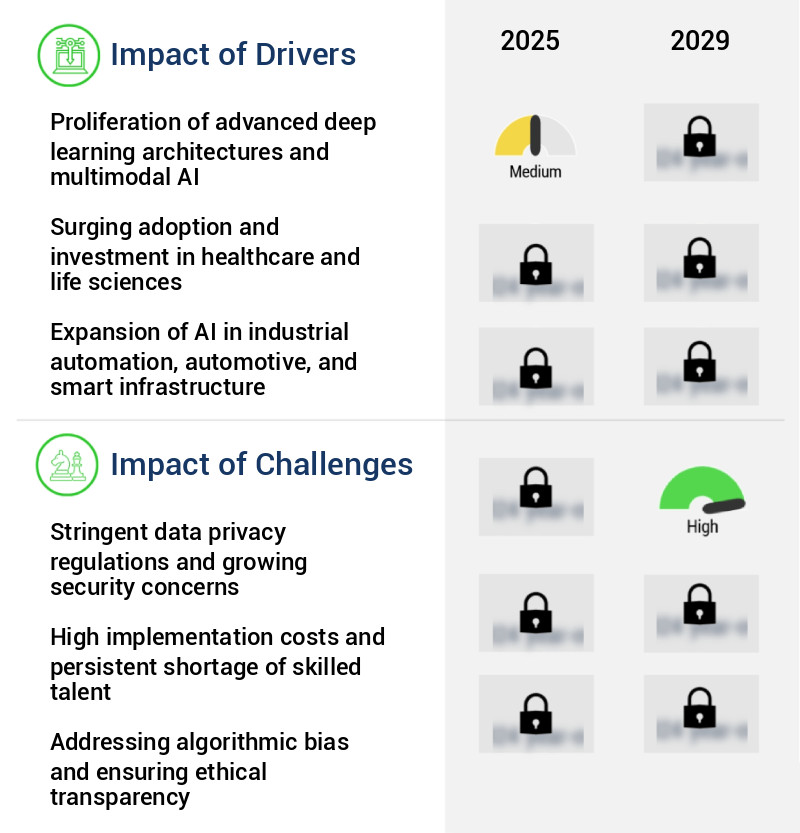
- The market's growth is primarily attributed to the proliferation of advanced deep learning architectures and multimodal AI technologies. These innovations are revolutionizing various industries by enabling more sophisticated and intelligent automation solutions.
- The market is experiencing a significant transformation, driven by the advancement of deep learning models, particularly generative and multimodal artificial intelligence. This evolution goes beyond traditional convolutional neural networks (CNNs) towards more sophisticated architectures like Vision Transformers (ViTs) and diffusion models. These advanced systems offer improved contextual understanding, object relationship mapping, and semantic segmentation, leading to more precise and nuanced analytical capabilities. This technological leap is not just incremental; it represents a paradigm shift in machine perception of visual data, opening up possibilities for applications previously considered computationally challenging or conceptually impractical.
- The market's growth is underpinned by the increasing demand for automated visual data analysis across various sectors, including healthcare, retail, and manufacturing. According to recent estimates, The market is expected to reach a substantial market size, with a significant CAGR, reflecting the market's robust growth trajectory.
What are the market trends shaping the AI-Based Image Analysis Industry?
- Advanced medical imaging AI is revolutionizing diagnostics and patient care, emerging as the mandated market trend in the healthcare industry.
- The integration of artificial intelligence (AI) into medical imaging signifies a pivotal development in The market. This shift transcends incremental technological progression and marks a transformative paradigm in diagnostic medicine. Factors such as the aging global population, the rising prevalence of chronic diseases like cancer and cardiovascular conditions, and a persistent shortage of skilled radiologists necessitate innovative solutions to augment efficiency, accuracy, and accessibility in medical diagnostics.
- AI-based image analysis addresses these challenges by equipping clinicians with tools that can analyze intricate medical scans at superhuman speeds and, in numerous instances, with superior precision. This market's growth is fueled by the pressing needs of modern healthcare systems, making it a robust and evolving sector.
What challenges does the AI-Based Image Analysis Industry face during its growth?
- Strict data privacy regulations and escalating security concerns represent a significant challenge to the industry's growth, necessitating robust compliance measures and continuous security enhancements.
- The market is undergoing significant evolution, shaped by the intricate data privacy and security regulations that govern various sectors. With the growing reliance on visual data in industries like healthcare, retail, and security, companies face a formidable challenge in navigating the legal and ethical complexities. This sensitive data often contains personally identifiable information (PII), protected health information (PHI), and proprietary corporate data. Strict regulations such as the General Data Protection Regulation (GDPR) in Europe, the California Consumer Privacy Act (CCPA) in North America, and emerging laws in the APAC region impose stringent rules on data consent, anonymization, and cross-border data transfer.
- Adhering to these regulations necessitates substantial operational and financial resources, making it a crucial consideration for market players. Despite these challenges, the potential benefits of AI-based image analysis, including enhanced accuracy, efficiency, and automation, continue to drive growth in this sector.
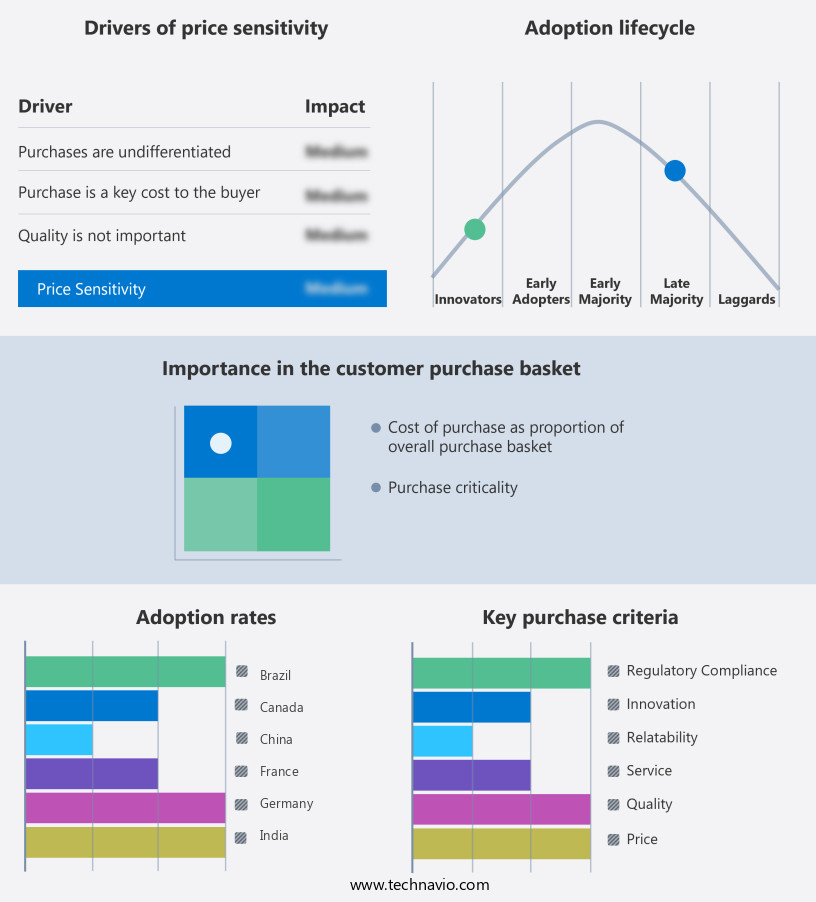
Exclusive Technavio Analysis on Customer Landscape
The ai-based image analysis market forecasting report includes the adoption lifecycle of the market, covering from the innovator’s stage to the laggard’s stage. It focuses on adoption rates in different regions based on penetration. Furthermore, the ai-based image analysis market report also includes key purchase criteria and drivers of price sensitivity to help companies evaluate and develop their market growth analysis strategies.
Customer Landscape of AI-Based Image Analysis Industry
Competitive Landscape
Companies are implementing various strategies, such as strategic alliances, ai-based image analysis market forecast, partnerships, mergers and acquisitions, geographical expansion, and product/service launches, to enhance their presence in the industry.
Amazon Web Services Inc. - The company provides Amazon Rekognition for advanced image and video analysis using pre-trained models, and Amazon SageMaker for custom machine learning model development, training, and deployment. These services enable businesses to effectively analyze and utilize data for various applications.
The industry research and growth report includes detailed analyses of the competitive landscape of the market and information about key companies, including:
- Amazon Web Services Inc.
- Clarifai Inc.
- Cognex Corp.
- DataRobot Inc.
- GE Healthcare Technologies Inc.
- Google Cloud
- Intel Corp.
- International Business Machines Corp.
- Maxar Technologies Inc.
- Microsoft Corp.
- NVIDIA Corp.
- Koninklijke Philips NV
- Planet Labs PBC
- Qualcomm Inc.
- Roboflow, Inc.
- Siemens Healthineers AG
- Tractable Ltd.
Qualitative and quantitative analysis of companies has been conducted to help clients understand the wider business environment as well as the strengths and weaknesses of key industry players. Data is qualitatively analyzed to categorize companies as pure play, category-focused, industry-focused, and diversified; it is quantitatively analyzed to categorize companies as dominant, leading, strong, tentative, and weak.
Recent Development and News in AI-Based Image Analysis Market
- In January 2024, Google Cloud announced the launch of its new AI-powered product, AutoML Vision, which enables businesses to build custom image recognition models without requiring machine learning expertise (Google Cloud Press Release). In March 2024, IBM and Adobe entered into a strategic partnership to integrate IBM's Watson AI capabilities into Adobe's Creative Cloud, allowing users to apply AI-based image analysis for content creation and marketing purposes (IBM Press Release).
- In April 2024, Microsoft's Azure AI division secured a strategic investment of USD100 million from Goldman Sachs to expand its AI capabilities and accelerate the development of AI-based image analysis services (Goldman Sachs Press Release). In May 2025, Amazon Web Services (AWS) received regulatory approval from the European Union to process biometric data for its Amazon Rekognition image analysis service, enabling the company to expand its European market presence (AWS Press Release). These developments underscore the growing importance of AI-based image analysis in various industries, with significant investments and strategic collaborations driving innovation and market expansion.
Dive into Technavio’s robust research methodology, blending expert interviews, extensive data synthesis, and validated models for unparalleled AI-Based Image Analysis Market insights. See full methodology.
|
Market Scope |
|
|
Report Coverage |
Details |
|
Page number |
277 |
|
Base year |
2024 |
|
Historic period |
2019-2023 |
|
Forecast period |
2025-2029 |
|
Growth momentum & CAGR |
Accelerate at a CAGR of 19.7% |
|
Market growth 2025-2029 |
USD 12518.8 million |
|
Market structure |
Fragmented |
|
YoY growth 2024-2025(%) |
17.9 |
|
Key countries |
US, China, UK, Germany, Canada, Japan, Brazil, France, India, and Italy |
|
Competitive landscape |
Leading Companies, Market Positioning of Companies, Competitive Strategies, and Industry Risks |
Research Analyst Overview
- The market continues to evolve, driven by advancements in GPU computing and the development of sophisticated image segmentation techniques, feature extraction methods, and image classification methods. These technologies enable high precision and recall rates, making them indispensable in various sectors, such as medical image analysis and defect detection systems. Deep learning models, including object detection algorithms and instance segmentation, have revolutionized computer vision systems, delivering real-time processing and accuracy metrics that surpass traditional methods. Real-time processing is essential in applications like satellite imagery processing and edge computing deployment. F1-score evaluation and ROC curve analysis are crucial for assessing model performance, while model training pipelines and data annotation tools facilitate the development and refinement of AI models.
- Image enhancement algorithms and data augmentation strategies further improve model performance and scalability. Transfer learning approach and hardware acceleration, including cloud computing platforms and API integrations, enable the deployment of AI-based image analysis in diverse industries. The market's growth is expected to exceed 20% annually, with computer vision systems, image quality assessment, and pattern recognition systems leading the charge. For instance, a leading automotive manufacturer implemented an AI-based image analysis system, resulting in a 30% increase in defect detection efficiency. This success underscores the potential of AI-based image analysis in enhancing operational efficiency and driving innovation across industries.
What are the Key Data Covered in this AI-Based Image Analysis Market Research and Growth Report?
-
What is the expected growth of the AI-Based Image Analysis Market between 2025 and 2029?
-
USD 12.52 billion, at a CAGR of 19.7%
-
-
What segmentation does the market report cover?
-
The report is segmented by Component (Hardware, Software, and Services), Technology (Facial recognition, Object recognition, Code recognition, Optical character recognition, and Pattern recognition), Application (Scanning and imaging, Security and surveillance, Image search, Augmented reality, and Marketing and advertising), End-user (BFSI, Media and entertainment, Retail and e-commerce, Healthcare, and Others), and Geography (North America, Europe, APAC, South America, and Middle East and Africa)
-
-
Which regions are analyzed in the report?
-
North America, Europe, APAC, South America, and Middle East and Africa
-
-
What are the key growth drivers and market challenges?
-
Proliferation of advanced deep learning architectures and multimodal AI, Stringent data privacy regulations and growing security concerns
-
-
Who are the major players in the AI-Based Image Analysis Market?
-
Amazon Web Services Inc., Clarifai Inc., Cognex Corp., DataRobot Inc., GE Healthcare Technologies Inc., Google Cloud, Intel Corp., International Business Machines Corp., Maxar Technologies Inc., Microsoft Corp., NVIDIA Corp., Koninklijke Philips NV, Planet Labs PBC, Qualcomm Inc., Roboflow, Inc., Siemens Healthineers AG, and Tractable Ltd.
-
Market Research Insights
- The market for AI-based image analysis is a dynamic and continually evolving field, driven by advancements in neural network architectures, reinforcement learning, and various data processing techniques. Neural networks, such as convolutional neural networks (CNNs), are increasingly used to identify patterns and classify images. For instance, a study showed that a CNN model achieved a 95% accuracy rate in identifying breast cancer from mammograms, surpassing human expertise. Moreover, the industry anticipates substantial growth, with estimates suggesting a compound annual growth rate (CAGR) of approximately 20% over the next several years.
- This expansion is fueled by the increasing demand for automated image analysis in various industries, including healthcare, retail, and manufacturing. The integration of AI in image analysis leads to improved efficiency, accuracy, and cost savings, making it an essential tool for businesses and organizations.
We can help! Our analysts can customize this ai-based image analysis market research report to meet your requirements.
 RIA -
RIA - 
