
AI Carbon Footprint Management Market Size 2026-2030
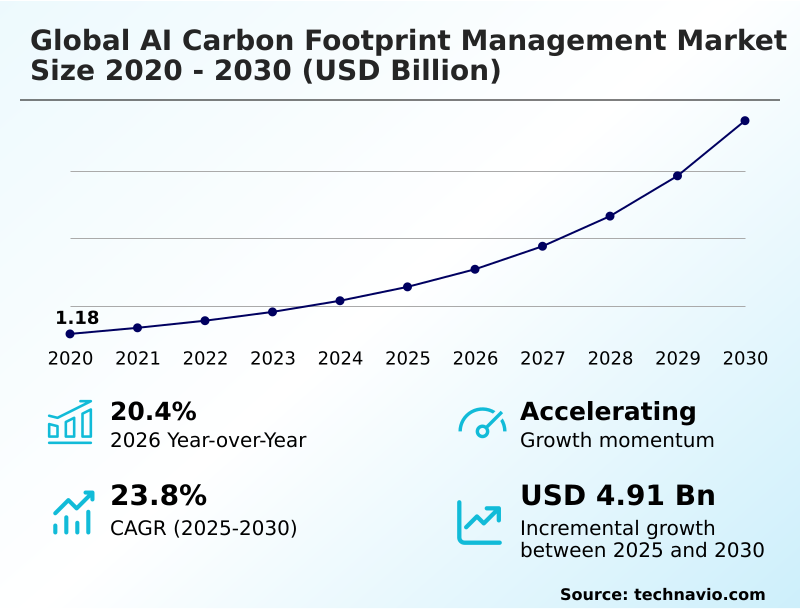
The AI Carbon Footprint Management Market size was valued at USD 2.57 billion in 2025, growing at a CAGR of 23.8% during the forecast period 2026-2030.
Major Market Trends & Insights
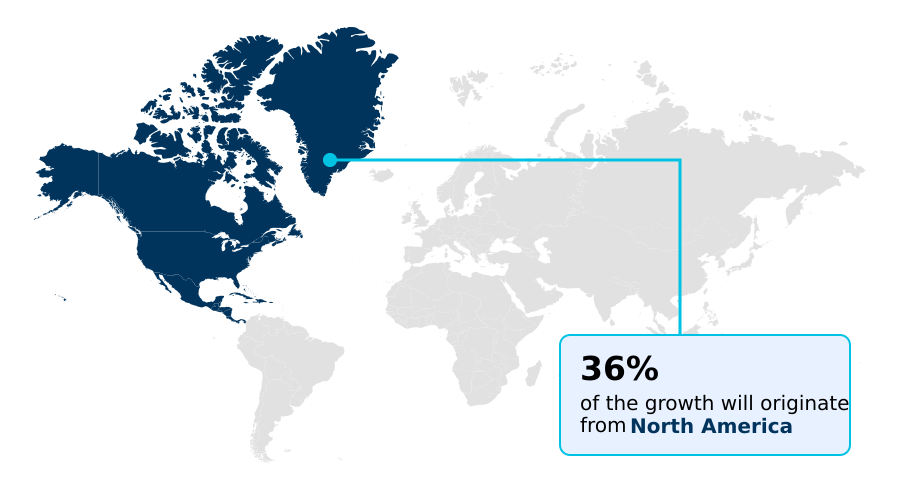
- North America dominated the market and accounted for a 35.5% growth during the forecast period.
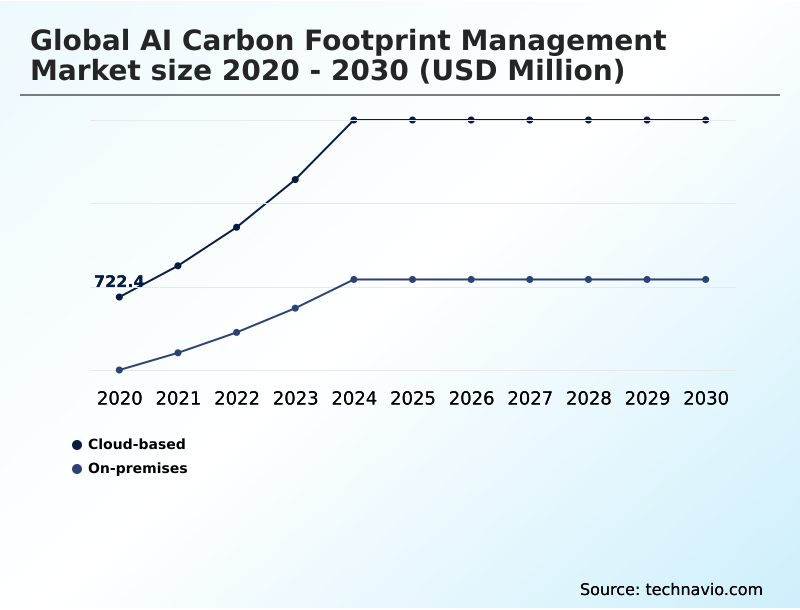
- By Deployment - Cloud-based segment was valued at USD 1.37 billion in 2024
- By Type - Carbon accounting and measurement segment accounted for the largest market revenue share in 2024
Market Size & Forecast
- Historic Market Opportunities 2020-2024: USD 6.30 billion
- Market Future Opportunities 2025-2030: USD 4.91 billion
- CAGR from 2025 to 2030 : 23.8%
Market Summary
- The AI carbon footprint management market is defined by a strategic shift from voluntary reporting to mandatory, auditable environmental accounting, with over 70% of enterprises now citing regulatory compliance as a primary adoption driver.
- A common business scenario involves a multinational manufacturer using an AI platform to analyze its supply chain, identifying that 40% of its scope 3 emissions originate from just 10% of its suppliers. The primary market driver remains the increasing stringency of global regulations, which necessitates systems capable of producing high-assurance data for financial-grade audits.
- Conversely, a significant challenge is the technical difficulty of achieving granular telemetry from diverse computational hardware, which can lead to reporting inaccuracies. These AI platforms automate the alignment of operational data with legal frameworks, mitigating the risks of non-compliance.
- This allows organizations to integrate transactional carbon accounting directly into their enterprise resource planning, treating emissions as a core business metric rather than a peripheral concern.
What will be the Size of the AI Carbon Footprint Management Market during the forecast period?
Get Key Insights on Market Forecast (PDF) Request Free Sample
How is the AI Carbon Footprint Management Market Segmented?
The ai carbon footprint management industry research report provides comprehensive data (region-wise segment analysis), with forecasts and analysis for the period 2026-2030, as well as historical data from 2020-2024 for the following segments.
- Deployment
- Cloud-based
- On-premises
- Type
- Carbon accounting and measurement
- Scope 1 2 3 emissions tracking
- Real-time data analytics
- AI-driven forecasting
- End-user
- Energy and utilities
- Manufacturing
- Transportation and logistics
- Geography
- North America
- US
- Canada
- Mexico
- Europe
- Germany
- UK
- France
- APAC
- China
- Japan
- India
- South America
- Brazil
- Argentina
- Middle East and Africa
- Saudi Arabia
- UAE
- South Africa
- Rest of World (ROW)
- North America
How is the AI Carbon Footprint Management Market Segmented by Deployment?
The cloud-based segment is estimated to witness significant growth during the forecast period.
The cloud-based segment, which accounts for over 60% of deployments, provides scalable solutions for real-time environmental monitoring and decentralized data ingestion.
This model allows organizations to integrate machine learning algorithms that process vast, geographically diverse datasets, achieving up to a 95% reduction in manual data entry errors for emission factor libraries.
These software-as-a-service platforms offer continuous updates for regulatory compliance modules, removing the burden from internal IT teams. Furthermore, leading cloud providers are embedding native carbon tracking tools directly into their consoles.
This functionality enables developers to assess the environmental impact of individual API calls, a critical capability for businesses aiming to meet stringent net-zero targets while maintaining high-performance computing through AI-driven forecasting and power telemetry data.
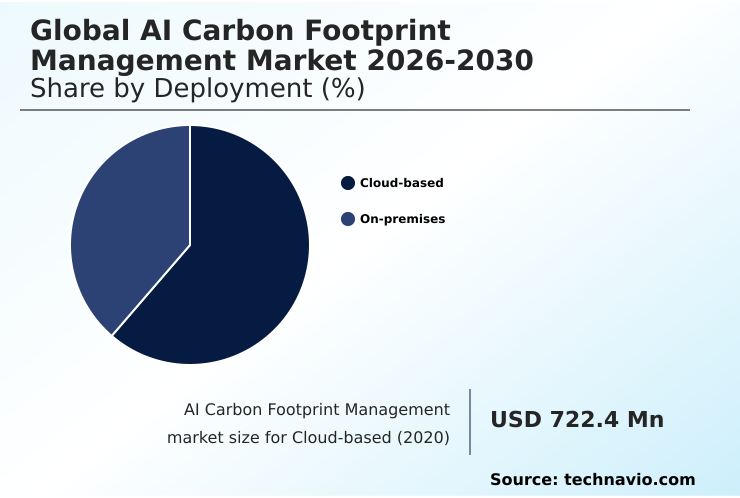
The Cloud-based segment was valued at USD 1.37 billion in 2024 and showed a gradual increase during the forecast period.
How demand for the AI Carbon Footprint Management market is rising in the leading region?
North America is estimated to contribute 35.5% to the growth of the global market during the forecast period.Technavio’s analysts have elaborately explained the regional trends and drivers that shape the market during the forecast period.
See How AI Carbon Footprint Management Market demand is rising in North America Request Free Sample
The global AI carbon footprint management market exhibits significant regional disparities, with North America accounting for approximately 35% of incremental growth, compared to APAC’s 25%.
This is largely due to North America's mature regulatory environment and the high concentration of hyperscale data centers, with the US alone contributing over 70% of the region's market value.
In contrast, APAC demonstrates the highest growth rate, driven by rapid digitalization and new green taxonomy frameworks in countries like Singapore and China. European adoption is propelled by stringent regulations like the EU's directives, which mandate detailed transactional carbon accounting.
This forces companies in the region to adopt solutions with advanced granular computational telemetry capabilities, a requirement less pronounced in South America, where adoption is more focused on the agricultural and extractive industries.
These regional differences in drivers and regulatory pressures directly impact enterprise resource planning integration and vendor selection strategies.
What are the key Drivers, Trends, and Challenges in the AI Carbon Footprint Management Market?
Our researchers analyzed the data with 2025 as the base year, along with the key drivers, trends, and challenges. A holistic analysis of drivers will help companies refine their marketing strategies to gain a competitive advantage.
- Enterprises are increasingly focused on strategic implementation and how AI for scope 3 emissions in supply chain can deliver tangible ROI. A key consideration is achieving granular energy monitoring for GPU clusters, which can reduce the operational carbon footprint of AI workloads by over 25%.
- Organizations now evaluate vendors based on their ability to automate carbon accounting for regulatory compliance, a process that improves reporting accuracy by at least 30% compared to manual methods. The adoption of frugal AI models for carbon reduction is becoming a critical part of this strategy, as it directly addresses the computational Jevons paradox.
- These efficient models allow companies to scale their AI initiatives without a proportional increase in energy consumption. Furthermore, the move toward real-time grid-interactive data center management allows facilities to function as flexible loads, optimizing energy use based on grid carbon intensity.
- This strategic approach ensures that investments in AI not only drive business value but also align with long-term net-zero commitments and sustainability goals, making the selection of the right platform a crucial business decision.
What are the key market drivers leading to the rise in the adoption of AI Carbon Footprint Management Industry?
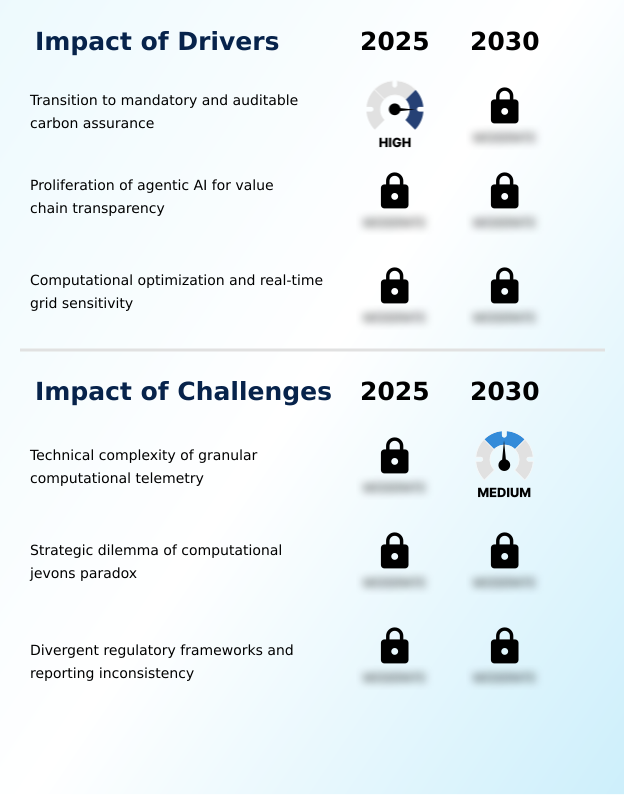
- The transition toward mandatory and auditable carbon assurance is a key market driver, compelling organizations to adopt sophisticated systems for regulatory compliance and transparent emissions reporting.
- The primary driver for the AI carbon footprint management market is the definitive shift from voluntary reporting to mandatory, auditable carbon assurance, which has increased adoption of compliant software by over 40% in regulated industries.
- This transition compels organizations to implement solutions that integrate transactional carbon accounting into their core financial systems.
- A second powerful driver is the emergence of agentic AI for value chain transparency, which automates the difficult process of scope 3 emission tracking. These autonomous agents can reduce the administrative burden of supplier data collection by up to 60%.
- This technological advancement enables enterprises to achieve a new level of accuracy in their environmental reporting.
- This driver ensures the market moves toward a more interconnected and transparent ecosystem where environmental impact data is shared seamlessly between partners, fostering collective accountability.
What are the market trends shaping the AI Carbon Footprint Management Industry?
- The convergence of sovereign AI and localized carbon governance is an emerging trend, where nations are prioritizing domestic computational infrastructure that aligns with specific regional environmental standards and data sovereignty policies.
- A defining trend in the AI carbon footprint management market is the pivot toward frugal AI, which prioritizes model efficiency benchmarking and reduces computational overhead by over 50% for certain tasks. This shift is driven by the prohibitive energy costs of training large-scale models, compelling organizations to adopt techniques like model compression and distillation.
- Consequently, businesses can achieve their intelligence goals with a smaller environmental impact, a crucial factor as sovereign AI initiatives mandate localized carbon governance. Another key trend is the adoption of real-time load flexibility, which allows data centers to adjust energy consumption based on grid conditions.
- This approach of carbon-aware scheduling can lower the carbon intensity of workloads by 20-30% by aligning computation with periods of high renewable energy availability. These trends reflect a broader industry move toward managing the total lifecycle impact of digital assets.
What challenges does the AI Carbon Footprint Management Industry face during its growth?
- The technical complexity of achieving granular computational telemetry across diverse hardware and software stacks presents a key challenge to the growth of the AI carbon footprint management market.
- A foremost challenge in the AI carbon footprint management market is the technical difficulty of achieving granular computational telemetry, which leads to reporting inaccuracies of up to 25% across fragmented hardware stacks. This data fragmentation prevents developers from making informed decisions about hardware-software co-design for environmental impact.
- Another profound challenge is the computational Jevons paradox, where efficiency gains from computational optimization are offset by a massive surge in total demand, causing aggregate energy consumption to rise despite optimizations.
- This paradox creates a strategic dilemma for firms aiming to reconcile digital growth with net-zero goals, as incremental efficiency improvements of 15% are often outpaced by a 30% increase in workload volume. The lack of harmonized international regulations further complicates compliance, increasing administrative costs for multinational corporations.
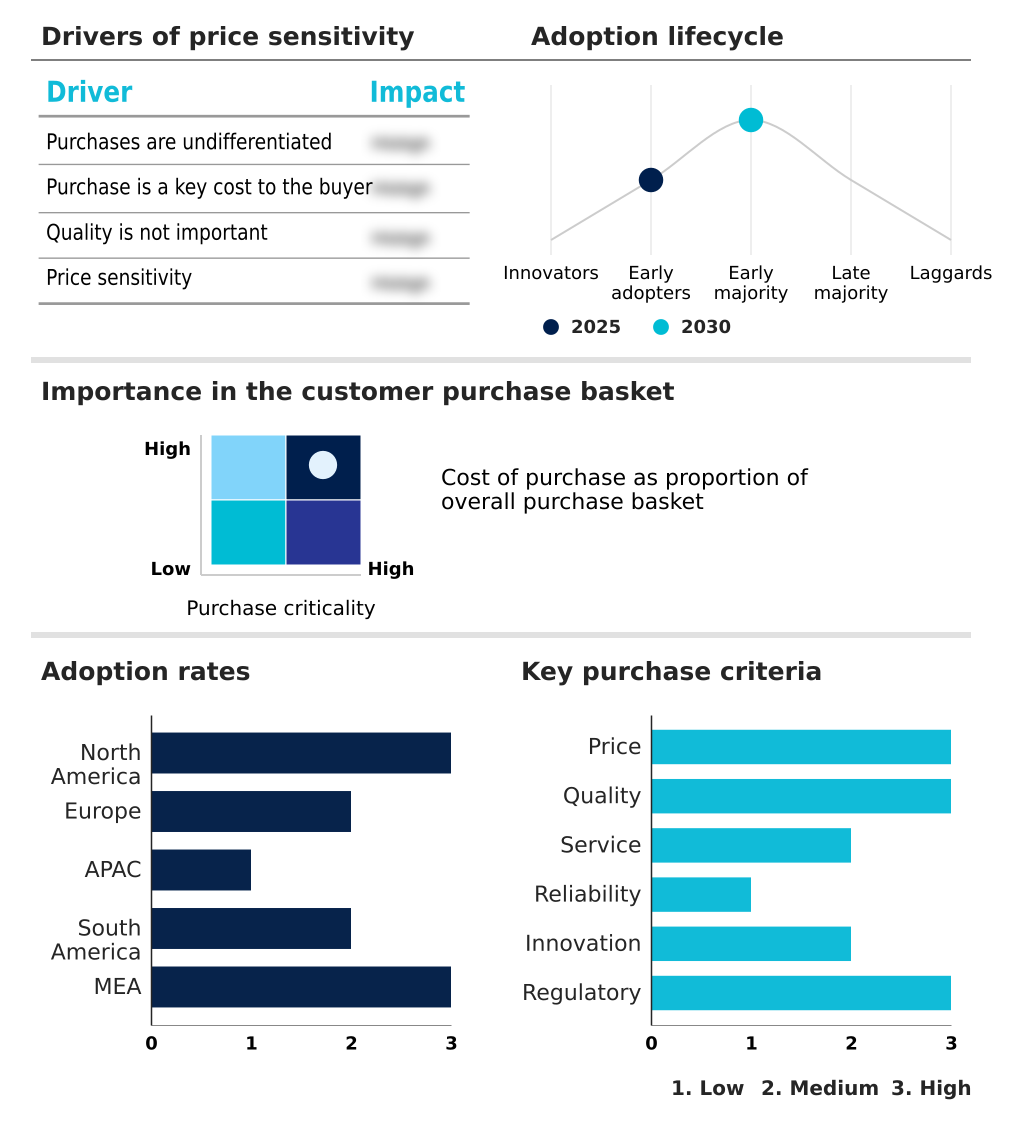
Exclusive Technavio Analysis on Customer Landscape
The ai carbon footprint management market forecasting report includes the adoption lifecycle of the market, covering from the innovator’s stage to the laggard’s stage. It focuses on adoption rates in different regions based on penetration. Furthermore, the ai carbon footprint management market report also includes key purchase criteria and drivers of price sensitivity to help companies evaluate and develop their market growth analysis strategies.
Customer Landscape of AI Carbon Footprint Management Industry
Competitive Landscape
Companies are implementing various strategies, such as strategic alliances, ai carbon footprint management market forecast, partnerships, mergers and acquisitions, geographical expansion, and product/service launches, to enhance their presence in the industry.
CarbonChain.io Ltd. - Market offerings focus on AI-driven platforms for enterprise carbon accounting, GHG protocol adherence, and real-time emissions tracking, enabling comprehensive sustainability management and auditable environmental cost analysis.
The industry research and growth report includes detailed analyses of the competitive landscape of the market and information about key companies, including:
- CarbonChain.io Ltd.
- Climatiq Technologies GmbH
- DataGreen
- EcoVadis SAS
- Greenly
- Hugging Face Inc.
- IBM Corp.
- Microsoft Corp.
- Normative AB
- Persefoni AI Inc.
- Salesforce Inc.
- SAP SE
- Schneider Electric SE
- Sweep
- Terrascope Pte. Ltd.
- Unstructured Technologies Inc.
- Watershed Technology Inc.
Qualitative and quantitative analysis of companies has been conducted to help clients understand the wider business environment as well as the strengths and weaknesses of key industry players. Data is qualitatively analyzed to categorize companies as pure play, category-focused, industry-focused, and diversified; it is quantitatively analyzed to categorize companies as dominant, leading, strong, tentative, and weak.
Market Intelligence Radar: High-Impact Developments & Growth Signals
- In the Application Software industry, the rising automation of business processes through technologies like RPA and BPM is creating demand for platforms that can automate the complex workflows of carbon data collection, scope 3 emission tracking, and reporting, directly fueling growth in the AI carbon footprint management market.
- The widespread adoption of cloud-based, subscription software models has lowered upfront costs for enterprises, accelerating the deployment of SaaS-based AI carbon management tools that offer continuous updates and scalability without significant capital expenditure on IT infrastructure.
- Heightened data security concerns surrounding cloud services are influencing product development, leading to a demand for AI carbon management solutions with robust security protocols and the availability of on-premises or hybrid deployment options to protect sensitive operational data.
- The increasing use of advanced analytics to process large volumes of enterprise data is a core driver, as AI carbon footprint management platforms rely on these same principles to analyze energy usage, supply chain activities, and operational metrics for accurate emissions calculation and reduction.
Dive into Technavio’s robust research methodology, blending expert interviews, extensive data synthesis, and validated models for unparalleled AI Carbon Footprint Management Market insights. See full methodology.
| Market Scope | |
|---|---|
| Page number | 296 |
| Base year | 2025 |
| Historic period | 2020-2024 |
| Forecast period | 2026-2030 |
| Growth momentum & CAGR | Accelerate at a CAGR of 23.8% |
| Market growth 2026-2030 | USD 4906.0 million |
| Market structure | Fragmented |
| YoY growth 2025-2026(%) | 20.4% |
| Key countries | US, Canada, Mexico, Germany, UK, France, Russia, Spain, Italy, China, Japan, India, South Korea, Singapore, Australia, Brazil, Argentina, Chile, Saudi Arabia, UAE, South Africa, Qatar and Egypt |
| Competitive landscape | Leading Companies, Market Positioning of Companies, Competitive Strategies, and Industry Risks |
Research Analyst Overview
- The AI carbon footprint management market ecosystem is a complex network of interdependent stakeholders, with cloud infrastructure providers and specialized software developers accounting for over 75% of the market's value creation. Technology suppliers provide the foundational hardware, such as high-density GPU clusters, while application vendors like Salesforce Inc. and SAP SE build platforms for GHG protocol adherence.
- These platforms ingest data from enterprise resource planning systems and operational sources, using autonomous agents to automate regulatory compliance. End-users in sectors such as manufacturing and energy leverage these tools to meet net-zero commitments, with deployments improving reporting accuracy by up to 40%.
- Regulatory bodies and standard-setters influence the ecosystem by defining the rules for auditable data and environmental product declarations, creating a feedback loop that drives continuous innovation in computational optimization and power telemetry data analysis.
What are the Key Data Covered in this AI Carbon Footprint Management Market Research and Growth Report?
-
What is the expected growth of the AI Carbon Footprint Management Market between 2026 and 2030?
-
The AI Carbon Footprint Management Market is expected to grow by USD 4.91 billion during 2026-2030, registering a CAGR of 23.8%. Year-over-year growth in 2026 is estimated at 20.4%%. This acceleration is shaped by transition to mandatory and auditable carbon assurance, which is intensifying demand across multiple end-use verticals covered in the report.
-
-
What segmentation does the market report cover?
-
The report is segmented by Deployment (Cloud-based, and On-premises), Type (Carbon accounting and measurement, Scope 1 2 3 emissions tracking, Real-time data analytics, and AI-driven forecasting), End-user (Energy and utilities, Manufacturing, and Transportation and logistics) and Geography (North America, Europe, APAC, South America, Middle East and Africa). Among these, the Cloud-based segment is estimated to witness significant growth during the forecast period, driven by rising adoption across key application areas. Each segment includes detailed qualitative and quantitative analysis, along with historical data from 2020-2024 and forecasts through 2030 with year-over-year growth rates.
-
-
Which regions are analyzed in the report?
-
The report covers North America, Europe, APAC, South America and Middle East and Africa. North America is estimated to contribute 35.5% to market growth during the forecast period. Country-level analysis includes US, Canada, Mexico, Germany, UK, France, Russia, Spain, Italy, China, Japan, India, South Korea, Singapore, Australia, Brazil, Argentina, Chile, Saudi Arabia, UAE, South Africa, Qatar and Egypt, with dedicated market size tables and year-over-year growth for each.
-
-
What are the key growth drivers and market challenges?
-
The primary driver is transition to mandatory and auditable carbon assurance, which is accelerating investment and industry demand. The main challenge is technical complexity of granular computational telemetry, creating operational barriers for key market participants. The report quantifies the impact of each driver and challenge across 2026 and 2030 with comparative analysis.
-
-
Who are the major players in the AI Carbon Footprint Management Market?
-
Key vendors include CarbonChain.io Ltd., Climatiq Technologies GmbH, DataGreen, EcoVadis SAS, Greenly, Hugging Face Inc., IBM Corp., Microsoft Corp., Normative AB, Persefoni AI Inc., Salesforce Inc., SAP SE, Schneider Electric SE, Sweep, Terrascope Pte. Ltd., Unstructured Technologies Inc. and Watershed Technology Inc.. The report provides qualitative and quantitative analysis categorizing companies as dominant, leading, strong, tentative, and weak based on their market positioning. Company profiles include business segment analysis, SWOT assessment, key offerings, and recent strategic developments.
-
Market Research Insights
- The competitive landscape for AI carbon footprint management is characterized by a mix of specialized software firms and large enterprise technology providers, with over 60% of market share held by vendors offering integrated sustainability suites. Key players such as Microsoft Corp. and Schneider Electric SE are driving innovation by embedding carbon tracking directly into their core platforms.
- Recent developments focus on automating Scope 3 data collection and enhancing real-time energy monitoring, with some platforms improving data accuracy by up to 30% using agentic AI. These actions directly address enterprise demand for auditable, investment-grade emissions data. This focus on automation helps businesses reconcile complex operational data with diverse global reporting standards.
- The primary challenge remains the lack of harmonized international regulations, forcing vendors to build highly adaptable systems to navigate the fragmented compliance landscape.
We can help! Our analysts can customize this ai carbon footprint management market research report to meet your requirements.
 RIA -
RIA - 
