AI Data Labeling Market Analysis, Size, and Forecast 2025-2029: North America (US, Canada, and Mexico), APAC (China, India, and Japan), Europe (Germany, UK, and France), South America (Brazil, Argentina, and Colombia), Middle East and Africa (UAE, Saudi Arabia, and South Africa), and Rest of World (ROW)

AI Data Labeling Market Analysis, Size, and Forecast 2025-2029:
North America (US, Canada, and Mexico), APAC (China, India, and Japan), Europe (Germany, UK, and France), South America (Brazil, Argentina, and Colombia), Middle East and Africa (UAE, Saudi Arabia, and South Africa), and Rest of World (ROW)

Published: Dec 2025 291 Pages SKU: IRTNTR81028

Market Overview at a Glance

$1.41 B
Market Opportunity
21.1%
CAGR 2024 - 2029
33.9%
North America Growth
$294.5 Mn
Text segment 2023

AI Data Labeling Market Size 2025-2029

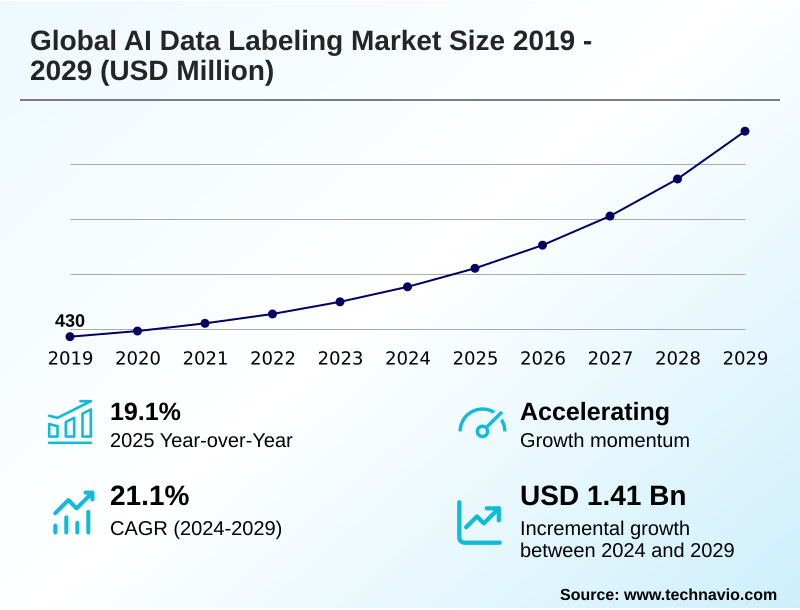
The ai data labeling market size is valued to increase by USD 1.41 billion, at a CAGR of 21.1% from 2024 to 2029. Increasing adoption of AI machine learning will drive the ai data labeling market.

Major Market Trends & Insights

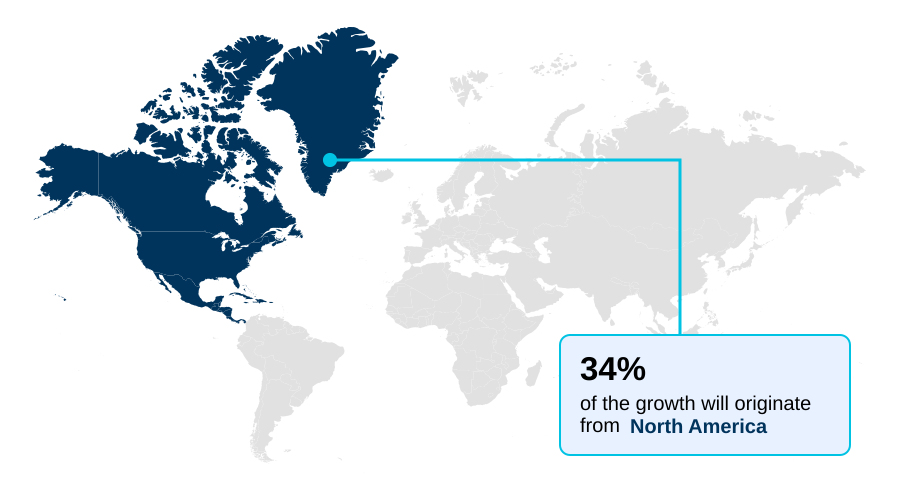
  • North America dominated the market and accounted for a 33.9% growth during the forecast period.
  • By Type - Text segment was valued at USD 294.5 million in 2023
  • By Method - Manual segment accounted for the largest market revenue share in 2023

Market Size & Forecast

  • Market Opportunities: USD 1.87 billion
  • Market Future Opportunities: USD 1.41 billion
  • CAGR from 2024 to 2029 : 21.1%

Market Summary

  • The AI data labeling market is the critical infrastructure layer that enables supervised learning for modern artificial intelligence. It involves a range of processes, from image annotation and video annotation to complex LiDAR point clouds analysis for computer vision systems, as well as text annotation for natural language processing.
  • The core objective is to produce high-quality training data, which serves as the ground truth data for AI model training. The shift towards a data-centric AI philosophy underscores that model performance is directly dependent on superior data quality and data consistency. Key techniques include creating bounding boxes for object detection and semantic segmentation for pixel-level classification.
  • An example in supply chain involves using annotated video feeds to train models that monitor warehouse inventory with over 98% accuracy, a task impossible without precise data annotation. Challenges such as data privacy and the need for bias detection are driving the demand for human-in-the-loop validation and robust quality assurance protocols.
  • Trends like active learning and the use of synthetic data generation are helping to scale operations, while the demand for expert human annotation services for specialized tasks like medical image annotation continues to grow, ensuring the market's dynamism.

What will be the Size of the AI Data Labeling Market during the forecast period?

Get Key Insights on Market Forecast (PDF) Request Free Sample

How is the AI Data Labeling Market Segmented?

The ai data labeling industry research report provides comprehensive data (region-wise segment analysis), with forecasts and estimates in "USD million" for the period 2025-2029, as well as historical data from 2019-2023 for the following segments.

  • Type
    • Text
    • Video
    • Image
    • Audio or speech
  • Method
    • Manual
    • Semi-supervised
    • Automatic
  • End-user
    • IT and technology
    • Automotive
    • Healthcare
    • Others
  • Geography
    • North America
      • US
      • Canada
      • Mexico
    • APAC
      • China
      • India
      • Japan
    • Europe
      • Germany
      • UK
      • France
    • South America
      • Brazil
      • Argentina
      • Colombia
    • Middle East and Africa
      • UAE
      • Saudi Arabia
      • South Africa
    • Rest of World (ROW)

By Type Insights

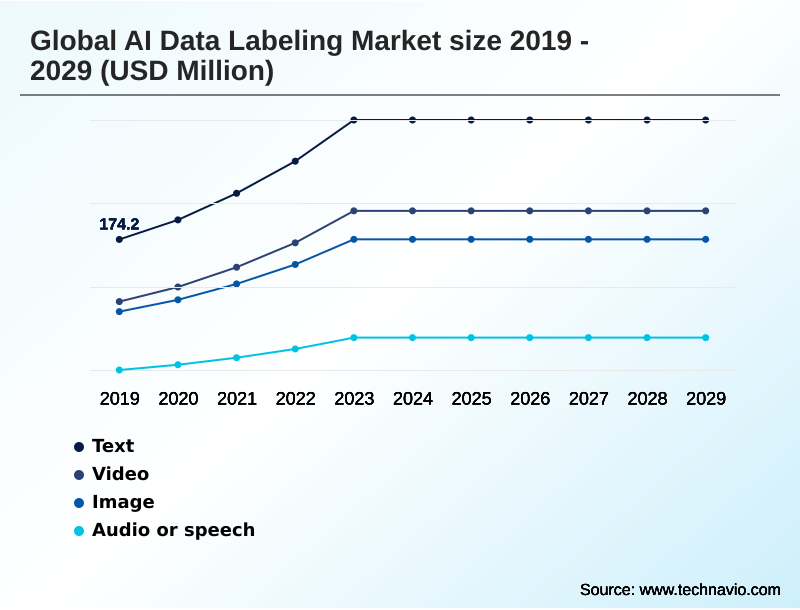
The text segment is estimated to witness significant growth during the forecast period.

The market is segmented by data type, with text, video, image, and audio representing the primary categories.

The text segment is crucial for training NLP models using techniques like named entity recognition and sentiment analysis, often facilitated by specialized text annotation software.

The image segment, supported by image labeling tools, is fundamental for computer vision, employing methods from simple bounding boxes to complex polygonal segmentation, semantic segmentation, and keypoint annotation.

Demand for video annotation services is growing rapidly, driven by applications in autonomous systems and surveillance. The audio segment, powered by audio labeling solutions, focuses on tasks like audio transcription.

Overall, these specialized AI data labeling services are critical across all segments, with advanced applications also requiring capabilities like 3d point cloud labeling.

North America contributes over 33% of the incremental growth, underscoring the mature demand for these varied annotation services in the region.

Request Free Sample

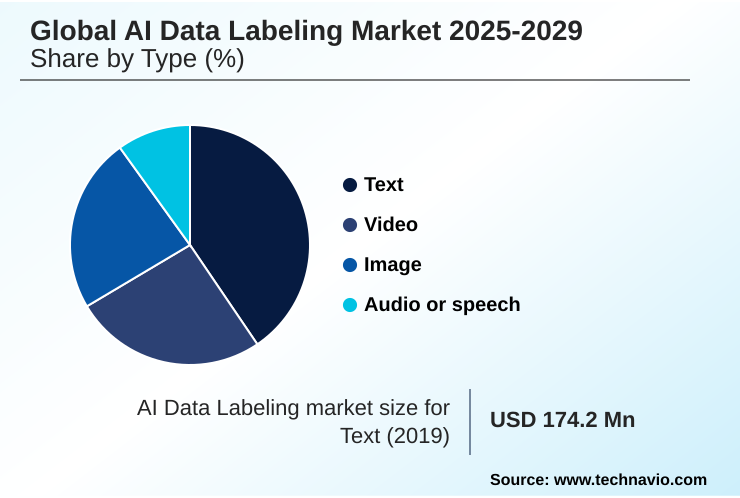
The Text segment was valued at USD 294.5 million in 2023 and showed a gradual increase during the forecast period.

Request Free Sample

Regional Analysis

North America is estimated to contribute 33.9% to the growth of the global market during the forecast period.Technavio’s analysts have elaborately explained the regional trends and drivers that shape the market during the forecast period.

See How AI Data Labeling Market Demand is Rising in North America Request Free Sample

The geographic landscape of the market is led by North America and APAC, which together represent over 67% of the growth opportunity.

North America’s dominance is fueled by heavy investment in advanced computer vision applications, especially data labeling for autonomous vehicles, which requires complex LiDAR point clouds processing, 3d sensor fusion, and video annotation.

The region's focus on medical image annotation for data labeling for healthcare also drives demand. Meanwhile, APAC is the fastest-growing region, with a CAGR projected to be around 23%, and is a major hub for data labeling outsourcing.

Its growth is driven by widespread AI adoption in e-commerce (data labeling for retail) and smart city projects requiring extensive image annotation.

The region is also a key center for natural language processing and text annotation due to its linguistic diversity. Both regions show strong demand for specialized services like LiDAR annotation.

Market Dynamics

Our researchers analyzed the data with 2024 as the base year, along with the key drivers, trends, and challenges. A holistic analysis of drivers will help companies refine their marketing strategies to gain a competitive advantage.

  • Strategic decision-making in the AI data labeling market requires a deep understanding of several critical factors. The debate over human-in-the-loop vs automated labeling is central, with many organizations adopting hybrid models to balance speed and accuracy.
  • The cost of ai data labeling services remains a significant budget item, compelling businesses to explore the best practices for data annotation quality to maximize ROI. This is particularly true for scalable data labeling for enterprise ai, where maintaining standards across massive datasets is paramount.
  • Challenges in large-scale data annotation are often addressed by choosing a data labeling platform that offers robust tools for collaborative data labeling and supports multimodal data annotation workflows. In specialized sectors, such as data annotation for autonomous driving and ai training data for medical imaging, the impact of data quality on model accuracy is a primary concern.
  • The practice of outsourcing data labeling versus in-house teams depends on factors like expertise, security, and scale, with many firms now managing a distributed annotation workforce. Concurrently, privacy compliance in data labeling and securing sensitive data during annotation have become critical for risk management, especially in use cases like data labeling for financial services fraud detection.
  • Many now using synthetic data for model training to augment real-world datasets, guided by a data-centric approach to model development and ethical considerations for data annotators, which can improve model robustness by over 10% compared to using only real-world data. This shift is also influencing data labeling for nlp sentiment analysis, where cultural nuance is key.

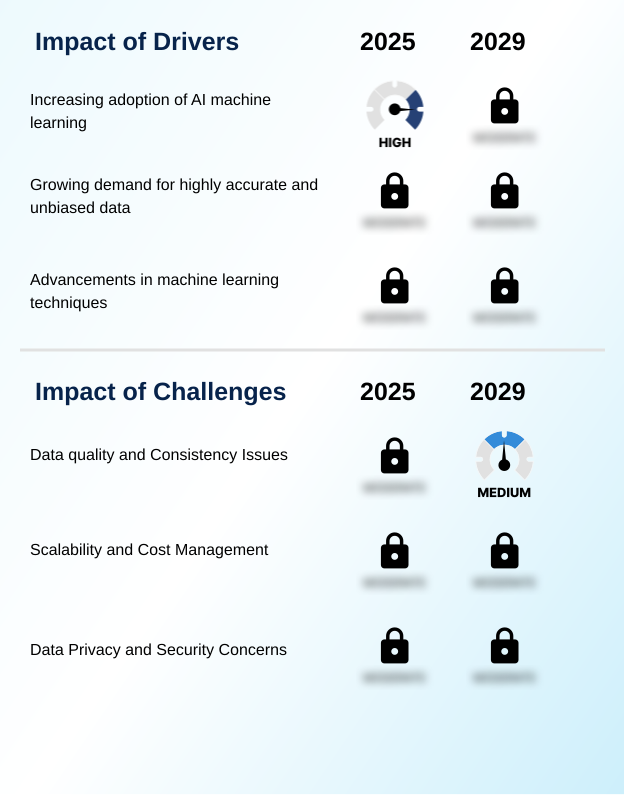
What are the key market drivers leading to the rise in the adoption of AI Data Labeling Industry?

  • The increasing adoption of artificial intelligence and machine learning technologies across a multitude of industries serves as a primary driver for market growth.

  • The primary driver of the AI data labeling market is the insatiable need for high-quality training data to power AI model training.
  • The vast majority of commercially deployed AI systems rely on supervised learning, which requires vast supervised learning datasets to function effectively.
  • The direct correlation between data quality and model performance is now widely understood; high-quality machine learning training data can improve predictive accuracy by over 20%. This has intensified the focus on rigorous data curation and robust data labeling quality control.
  • As applications become more sophisticated, the demand for multimodal data that combines different data types is increasing.
  • This fuels the need for specialized computer vision datasets and NLP data annotation services, creating a continuous cycle of demand for expertly prepared AI model training data.

What are the market trends shaping the AI Data Labeling Industry?

  • The emergence of automated and semi-automated labeling tools represents a significant upcoming market trend, driven by the need to enhance efficiency and accelerate the data preparation process for AI models.

  • The market is rapidly advancing beyond manual processes, with a significant trend toward data-centric AI approaches. This shift prioritizes systematic AI training data management, where the quality of datasets is considered as important as the model architecture itself.
  • The emergence of sophisticated annotation tools that facilitate automated data labeling and semi-supervised labeling is enhancing efficiency, with some platforms accelerating simple tasks by over 60%. Furthermore, techniques like active learning are optimizing human-in-the-loop workflows by intelligently selecting data points for review.
  • As generative AI data needs grow, so does the demand for RLHF services and reinforcement learning from human feedback to refine complex models. The use of synthetic data generation is also on the rise, providing a scalable way to create diverse training scenarios, which has been shown to reduce data acquisition costs by up to 30% in certain applications.
  • These trends are converging on data-centric ai platforms that offer integrated solutions.

What challenges does the AI Data Labeling Industry face during its growth?

  • Maintaining high standards of data quality and consistency across large datasets presents a key challenge that affects the industry's growth and the reliability of AI models.

  • Despite strong growth, the market faces significant challenges, primarily centered around maintaining data consistency and ensuring data privacy. Implementing secure data annotation processes is critical, as a single data breach can lead to severe regulatory penalties. Achieving data labeling compliance with regulations like GDPR adds another layer of complexity.
  • Furthermore, AI ethics and bias detection are paramount, as biased data can lead to flawed and unfair AI outcomes, necessitating careful ethical AI data sourcing. Establishing effective quality assurance protocols across a distributed data annotation workforce is a persistent operational hurdle.
  • These challenges reinforce the importance of the human-in-the-loop approach and professional human annotation services, as automated systems often struggle with ambiguity. Robust model validation and model validation services are therefore essential to verify data integrity before training begins, with some organizations dedicating up to 30% of their AI budget to these quality-focused activities.

Exclusive Technavio Analysis on Customer Landscape

The ai data labeling market forecasting report includes the adoption lifecycle of the market, covering from the innovator’s stage to the laggard’s stage. It focuses on adoption rates in different regions based on penetration. Furthermore, the ai data labeling market report also includes key purchase criteria and drivers of price sensitivity to help companies evaluate and develop their market growth analysis strategies.

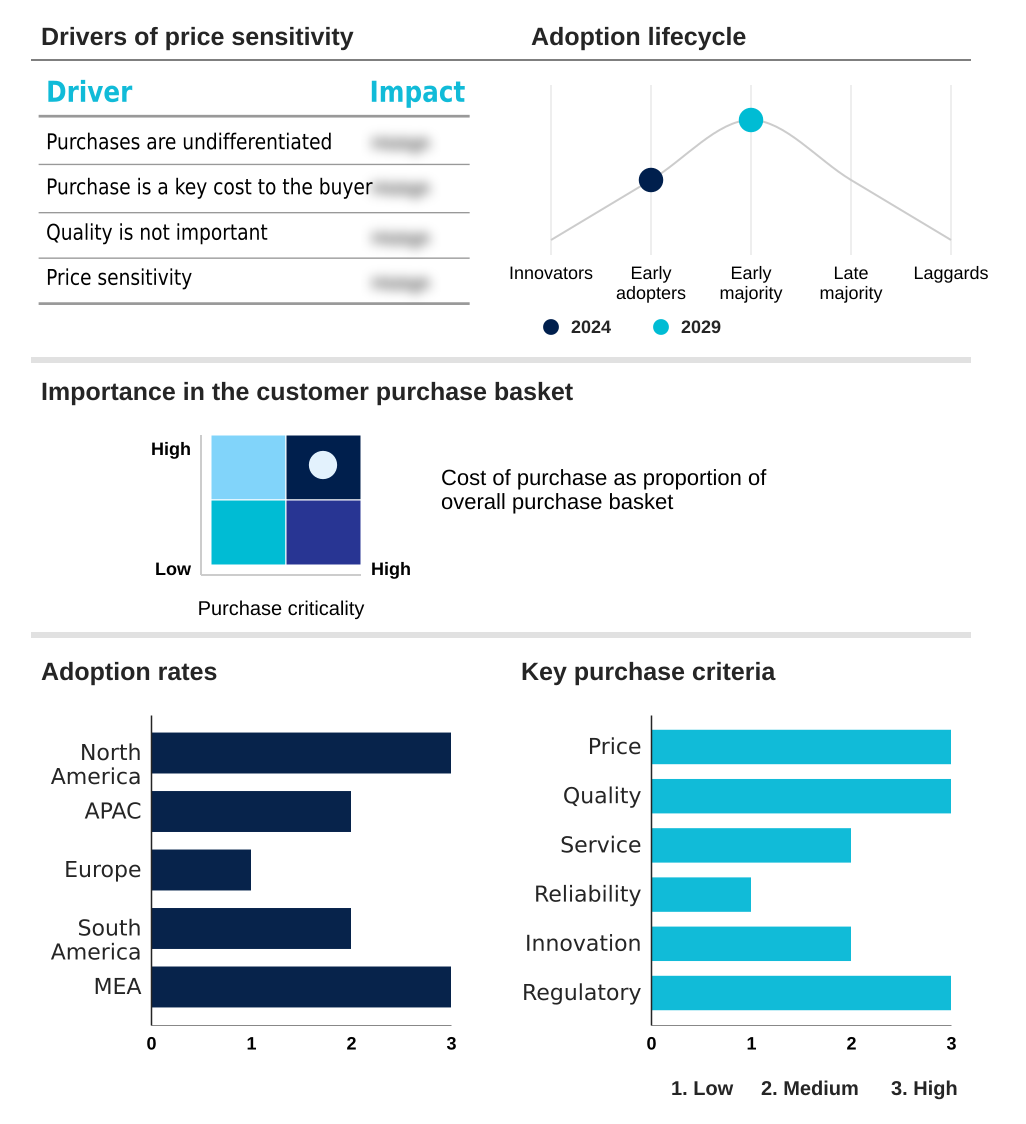
Customer Landscape of AI Data Labeling Industry

Competitive Landscape

Companies are implementing various strategies, such as strategic alliances, ai data labeling market forecast, partnerships, mergers and acquisitions, geographical expansion, and product/service launches, to enhance their presence in the industry.

ALEGION - Provides enterprise-grade annotation for image, video, text, and audio, emphasizing quality control and compliance for key industries.

The industry research and growth report includes detailed analyses of the competitive landscape of the market and information about key companies, including:

  • ALEGION
  • APPEN Ltd.
  • Aurora Innovation Inc.
  • Clickworker GmbH
  • Cloudfactory
  • Cogito Tech LLC
  • DefinedCrowd Corp.
  • Hive
  • Humans In The Loop
  • iMerit
  • Kili Technology
  • Labelbox
  • Samasource
  • Scale
  • SuperAnnotate
  • tagtog Sp. z o.o.
  • TaskUs Inc.
  • TELUS International Inc.

Qualitative and quantitative analysis of companies has been conducted to help clients understand the wider business environment as well as the strengths and weaknesses of key industry players. Data is qualitatively analyzed to categorize companies as pure play, category-focused, industry-focused, and diversified; it is quantitatively analyzed to categorize companies as dominant, leading, strong, tentative, and weak.

Recent Development and News in Ai data labeling market

  • In February, 2024, a major North American technology firm announced a significant increase in its budget for external data labeling services to support the rapid expansion of its cloud-based AI offerings.
  • In March, 2024, a prominent automotive original equipment manufacturer announced a substantial increase in its investment in perception data labeling, specifically for urban driving scenarios, to address real-world complexity.
  • In April, 2024, the Canadian government announced new funding for AI initiatives in the healthcare sector, which increased the need for specialized medical image and clinical text annotation services.
  • In May, 2024, the UK government allocated new grants for AI research in genomics and climate science, indirectly increasing the demand for highly specialized and scientifically accurate data annotation services.

Dive into Technavio’s robust research methodology, blending expert interviews, extensive data synthesis, and validated models for unparalleled AI Data Labeling Market insights. See full methodology.

Market Scope
Page number 291
Base year 2024
Historic period 2019-2023
Forecast period 2025-2029
Growth momentum & CAGR Accelerate at a CAGR of 21.1%
Market growth 2025-2029 USD 1414.9 million
Market structure Fragmented
YoY growth 2024-2025(%) 19.1%
Key countries US, Canada, Mexico, China, India, Japan, South Korea, Australia, Indonesia, Germany, UK, France, Italy, Spain, The Netherlands, Brazil, Argentina, Colombia, UAE, Saudi Arabia, South Africa, Israel and Turkey
Competitive landscape Leading Companies, Market Positioning of Companies, Competitive Strategies, and Industry Risks

Request Free Sample

Research Analyst Overview

  • The AI data labeling market is foundational to the advancement of artificial intelligence, providing the essential training data for AI model training. This process involves meticulous data annotation across various formats, including image annotation, video annotation, text annotation, and audio transcription.
  • For computer vision applications, techniques such as bounding boxes, polygonal segmentation, and semantic segmentation are critical, while more advanced use cases leverage keypoint annotation, LiDAR point clouds, and 3d sensor fusion. In the realm of natural language processing, tasks like named entity recognition and sentiment analysis depend on high-quality annotations.
  • A data-centric AI approach is gaining prominence, emphasizing that model performance is directly tied to the quality of the ground truth data. This necessitates robust quality assurance protocols and rigorous model validation. The evolution towards synthetic data generation and handling multimodal data adds complexity, yet the human-in-the-loop model, often enhanced by active learning, remains indispensable.
  • Adherence to AI ethics, including bias detection and data privacy, is becoming a boardroom-level concern, as companies recognize that a 15% improvement in model fairness can significantly mitigate regulatory risk.
  • The market is defined by the interplay between human expertise and sophisticated annotation tools to ensure high data quality and data consistency, especially with the rise of reinforcement learning from human feedback for refining complex models. This entire ecosystem is geared toward systematic data curation to build more reliable and effective AI systems.

What are the Key Data Covered in this AI Data Labeling Market Research and Growth Report?

  • What is the expected growth of the AI Data Labeling Market between 2025 and 2029?

    • USD 1.41 billion, at a CAGR of 21.1%

  • What segmentation does the market report cover?

    • The report is segmented by Type (Text, Video, Image, Audio or speech), Method (Manual, Semi-supervised, Automatic), End-user (IT and technology, Automotive, Healthcare, Others) and Geography (North America, APAC, Europe, South America, Middle East and Africa)

  • Which regions are analyzed in the report?

    • North America, APAC, Europe, South America and Middle East and Africa

  • What are the key growth drivers and market challenges?

    • Increasing adoption of AI machine learning, Data quality and Consistency Issues

  • Who are the major players in the AI Data Labeling Market?

    • ALEGION, APPEN Ltd., Aurora Innovation Inc., Clickworker GmbH, Cloudfactory, Cogito Tech LLC, DefinedCrowd Corp., Hive, Humans In The Loop, iMerit, Kili Technology, Labelbox, Samasource, Scale, SuperAnnotate, tagtog Sp. z o.o., TaskUs Inc. and TELUS International Inc.

Market Research Insights

  • The demand for AI data labeling services is surging as enterprises recognize that high-quality machine learning training data is a key competitive differentiator. Organizations are increasingly adopting a data-centric AI platforms approach, moving beyond simple data labeling outsourcing to strategic AI training data management.
  • This involves utilizing sophisticated data annotation platform options, including specialized image labeling tools, video annotation services, text annotation software, and audio labeling solutions. The need for specialized NLP data annotation and computer vision datasets is particularly acute. For advanced applications, LiDAR annotation and 3d point cloud labeling are critical.
  • A well-managed data annotation workforce coupled with stringent data labeling quality control can improve model accuracy by up to 15%. This is driving the market for both human annotation services and technology-assisted solutions like automated data labeling and semi-supervised labeling.
  • Verticals such as data labeling for autonomous vehicles, medical image annotation, data labeling for healthcare, and data labeling for retail require deep domain expertise. Consequently, model validation services and RLHF services are becoming standard.
  • As generative AI data needs grow, ethical AI data sourcing, secure data annotation, and data labeling compliance are non-negotiable, with compliant processes reducing project rework by over 20%.

We can help! Our analysts can customize this ai data labeling market research report to meet your requirements.

Get in touch

1. Executive Summary

1.1 Market overview

Executive Summary - Chart on Market Overview
Executive Summary - Data Table on Market Overview
Executive Summary - Chart on Global Market Characteristics
Executive Summary - Chart on Market by Geography
Executive Summary - Chart on Market Segmentation by Type
Executive Summary - Chart on Market Segmentation by Method
Executive Summary - Chart on Market Segmentation by End-user
Executive Summary - Chart on Incremental Growth
Executive Summary - Data Table on Incremental Growth
Executive Summary - Chart on Company Market Positioning

2. Technavio Analysis

2.1 Analysis of price sensitivity, lifecycle, customer purchase basket, adoption rates, and purchase criteria

2.2 Criticality of inputs and Factors of differentiation

Chart on Overview on criticality of inputs and factors of differentiation

2.3 Factors of disruption

Chart on Overview on factors of disruption

2.4 Impact of drivers and challenges

Chart on Impact of drivers and challenges in 2024 and 2029

3. Market Landscape

3.1 Market ecosystem

Chart on Parent Market
Data Table on - Parent Market

3.2 Market characteristics

Chart on Market characteristics analysis

3.3 Value chain analysis

Chart on Value chain analysis

4. Market Sizing

4.1 Market definition

Data Table on Offerings of companies included in the market definition

4.2 Market segment analysis

Market segments

4.3 Market size 2024

4.4 Market outlook: Forecast for 2024-2029

Chart on Global - Market size and forecast 2024-2029 ($ million)
Data Table on Global - Market size and forecast 2024-2029 ($ million)
Chart on Global Market: Year-over-year growth 2024-2029 (%)
Data Table on Global Market: Year-over-year growth 2024-2029 (%)

5. Historic Market Size

5.1 Global AI Data Labeling Market 2019 - 2023

Historic Market Size - Data Table on Global AI Data Labeling Market 2019 - 2023 ($ million)

5.2 Type segment analysis 2019 - 2023

Historic Market Size - Type Segment 2019 - 2023 ($ million)

5.3 Method segment analysis 2019 - 2023

Historic Market Size - Method Segment 2019 - 2023 ($ million)

5.4 End-user segment analysis 2019 - 2023

Historic Market Size - End-user Segment 2019 - 2023 ($ million)

5.5 Geography segment analysis 2019 - 2023

Historic Market Size - Geography Segment 2019 - 2023 ($ million)

5.6 Country segment analysis 2019 - 2023

Historic Market Size - Country Segment 2019 - 2023 ($ million)

6. Five Forces Analysis

6.1 Five forces summary

Five forces analysis - Comparison between 2024 and 2029

6.2 Bargaining power of buyers

Bargaining power of buyers - Impact of key factors 2024 and 2029

6.3 Bargaining power of suppliers

Bargaining power of suppliers - Impact of key factors in 2024 and 2029

6.4 Threat of new entrants

Threat of new entrants - Impact of key factors in 2024 and 2029

6.5 Threat of substitutes

Threat of substitutes - Impact of key factors in 2024 and 2029

6.6 Threat of rivalry

Threat of rivalry - Impact of key factors in 2024 and 2029

6.7 Market condition

Chart on Market condition - Five forces 2024 and 2029

7. Market Segmentation by Type

7.1 Market segments

Chart on Type - Market share 2024-2029 (%)
Data Table on Type - Market share 2024-2029 (%)

7.2 Comparison by Type

Chart on Comparison by Type
Data Table on Comparison by Type

7.3 Text - Market size and forecast 2024-2029

Chart on Text - Market size and forecast 2024-2029 ($ million)
Data Table on Text - Market size and forecast 2024-2029 ($ million)
Chart on Text - Year-over-year growth 2024-2029 (%)
Data Table on Text - Year-over-year growth 2024-2029 (%)

7.4 Video - Market size and forecast 2024-2029

Chart on Video - Market size and forecast 2024-2029 ($ million)
Data Table on Video - Market size and forecast 2024-2029 ($ million)
Chart on Video - Year-over-year growth 2024-2029 (%)
Data Table on Video - Year-over-year growth 2024-2029 (%)

7.5 Image - Market size and forecast 2024-2029

Chart on Image - Market size and forecast 2024-2029 ($ million)
Data Table on Image - Market size and forecast 2024-2029 ($ million)
Chart on Image - Year-over-year growth 2024-2029 (%)
Data Table on Image - Year-over-year growth 2024-2029 (%)

7.6 Audio or speech - Market size and forecast 2024-2029

Chart on Audio or speech - Market size and forecast 2024-2029 ($ million)
Data Table on Audio or speech - Market size and forecast 2024-2029 ($ million)
Chart on Audio or speech - Year-over-year growth 2024-2029 (%)
Data Table on Audio or speech - Year-over-year growth 2024-2029 (%)

7.7 Market opportunity by Type

Market opportunity by Type ($ million)
Data Table on Market opportunity by Type ($ million)

8. Market Segmentation by Method

8.1 Market segments

Chart on Method - Market share 2024-2029 (%)
Data Table on Method - Market share 2024-2029 (%)

8.2 Comparison by Method

Chart on Comparison by Method
Data Table on Comparison by Method

8.3 Manual - Market size and forecast 2024-2029

Chart on Manual - Market size and forecast 2024-2029 ($ million)
Data Table on Manual - Market size and forecast 2024-2029 ($ million)
Chart on Manual - Year-over-year growth 2024-2029 (%)
Data Table on Manual - Year-over-year growth 2024-2029 (%)

8.4 Semi-supervised - Market size and forecast 2024-2029

Chart on Semi-supervised - Market size and forecast 2024-2029 ($ million)
Data Table on Semi-supervised - Market size and forecast 2024-2029 ($ million)
Chart on Semi-supervised - Year-over-year growth 2024-2029 (%)
Data Table on Semi-supervised - Year-over-year growth 2024-2029 (%)

8.5 Automatic - Market size and forecast 2024-2029

Chart on Automatic - Market size and forecast 2024-2029 ($ million)
Data Table on Automatic - Market size and forecast 2024-2029 ($ million)
Chart on Automatic - Year-over-year growth 2024-2029 (%)
Data Table on Automatic - Year-over-year growth 2024-2029 (%)

8.6 Market opportunity by Method

Market opportunity by Method ($ million)
Data Table on Market opportunity by Method ($ million)

9. Market Segmentation by End-user

9.1 Market segments

Chart on End-user - Market share 2024-2029 (%)
Data Table on End-user - Market share 2024-2029 (%)

9.2 Comparison by End-user

Chart on Comparison by End-user
Data Table on Comparison by End-user

9.3 IT and technology - Market size and forecast 2024-2029

Chart on IT and technology - Market size and forecast 2024-2029 ($ million)
Data Table on IT and technology - Market size and forecast 2024-2029 ($ million)
Chart on IT and technology - Year-over-year growth 2024-2029 (%)
Data Table on IT and technology - Year-over-year growth 2024-2029 (%)

9.4 Automotive - Market size and forecast 2024-2029

Chart on Automotive - Market size and forecast 2024-2029 ($ million)
Data Table on Automotive - Market size and forecast 2024-2029 ($ million)
Chart on Automotive - Year-over-year growth 2024-2029 (%)
Data Table on Automotive - Year-over-year growth 2024-2029 (%)

9.5 Healthcare - Market size and forecast 2024-2029

Chart on Healthcare - Market size and forecast 2024-2029 ($ million)
Data Table on Healthcare - Market size and forecast 2024-2029 ($ million)
Chart on Healthcare - Year-over-year growth 2024-2029 (%)
Data Table on Healthcare - Year-over-year growth 2024-2029 (%)

9.6 Others - Market size and forecast 2024-2029

Chart on Others - Market size and forecast 2024-2029 ($ million)
Data Table on Others - Market size and forecast 2024-2029 ($ million)
Chart on Others - Year-over-year growth 2024-2029 (%)
Data Table on Others - Year-over-year growth 2024-2029 (%)

9.7 Market opportunity by End-user

Market opportunity by End-user ($ million)
Data Table on Market opportunity by End-user ($ million)

10. Customer Landscape

10.1 Customer landscape overview

Analysis of price sensitivity, lifecycle, customer purchase basket, adoption rates, and purchase criteria

11. Geographic Landscape

11.1 Geographic segmentation

Chart on Market share by geography 2024-2029 (%)
Data Table on Market share by geography 2024-2029 (%)

11.2 Geographic comparison

Chart on Geographic comparison
Data Table on Geographic comparison

11.3 North America - Market size and forecast 2024-2029

Chart on North America - Market size and forecast 2024-2029 ($ million)
Data Table on North America - Market size and forecast 2024-2029 ($ million)
Chart on North America - Year-over-year growth 2024-2029 (%)
Data Table on North America - Year-over-year growth 2024-2029 (%)
Chart on Regional Comparison - North America
Data Table on Regional Comparison - North America

11.3.1 US - Market size and forecast 2024-2029

Chart on US - Market size and forecast 2024-2029 ($ million)
Data Table on US - Market size and forecast 2024-2029 ($ million)
Chart on US - Year-over-year growth 2024-2029 (%)
Data Table on US - Year-over-year growth 2024-2029 (%)

11.3.2 Canada - Market size and forecast 2024-2029

Chart on Canada - Market size and forecast 2024-2029 ($ million)
Data Table on Canada - Market size and forecast 2024-2029 ($ million)
Chart on Canada - Year-over-year growth 2024-2029 (%)
Data Table on Canada - Year-over-year growth 2024-2029 (%)

11.3.3 Mexico - Market size and forecast 2024-2029

Chart on Mexico - Market size and forecast 2024-2029 ($ million)
Data Table on Mexico - Market size and forecast 2024-2029 ($ million)
Chart on Mexico - Year-over-year growth 2024-2029 (%)
Data Table on Mexico - Year-over-year growth 2024-2029 (%)

11.4 APAC - Market size and forecast 2024-2029

Chart on APAC - Market size and forecast 2024-2029 ($ million)
Data Table on APAC - Market size and forecast 2024-2029 ($ million)
Chart on APAC - Year-over-year growth 2024-2029 (%)
Data Table on APAC - Year-over-year growth 2024-2029 (%)
Chart on Regional Comparison - APAC
Data Table on Regional Comparison - APAC

11.4.1 China - Market size and forecast 2024-2029

Chart on China - Market size and forecast 2024-2029 ($ million)
Data Table on China - Market size and forecast 2024-2029 ($ million)
Chart on China - Year-over-year growth 2024-2029 (%)
Data Table on China - Year-over-year growth 2024-2029 (%)

11.4.2 India - Market size and forecast 2024-2029

Chart on India - Market size and forecast 2024-2029 ($ million)
Data Table on India - Market size and forecast 2024-2029 ($ million)
Chart on India - Year-over-year growth 2024-2029 (%)
Data Table on India - Year-over-year growth 2024-2029 (%)

11.4.3 Japan - Market size and forecast 2024-2029

Chart on Japan - Market size and forecast 2024-2029 ($ million)
Data Table on Japan - Market size and forecast 2024-2029 ($ million)
Chart on Japan - Year-over-year growth 2024-2029 (%)
Data Table on Japan - Year-over-year growth 2024-2029 (%)

11.4.4 South Korea - Market size and forecast 2024-2029

Chart on South Korea - Market size and forecast 2024-2029 ($ million)
Data Table on South Korea - Market size and forecast 2024-2029 ($ million)
Chart on South Korea - Year-over-year growth 2024-2029 (%)
Data Table on South Korea - Year-over-year growth 2024-2029 (%)

11.4.5 Australia - Market size and forecast 2024-2029

Chart on Australia - Market size and forecast 2024-2029 ($ million)
Data Table on Australia - Market size and forecast 2024-2029 ($ million)
Chart on Australia - Year-over-year growth 2024-2029 (%)
Data Table on Australia - Year-over-year growth 2024-2029 (%)

11.4.6 Indonesia - Market size and forecast 2024-2029

Chart on Indonesia - Market size and forecast 2024-2029 ($ million)
Data Table on Indonesia - Market size and forecast 2024-2029 ($ million)
Chart on Indonesia - Year-over-year growth 2024-2029 (%)
Data Table on Indonesia - Year-over-year growth 2024-2029 (%)

11.5 Europe - Market size and forecast 2024-2029

Chart on Europe - Market size and forecast 2024-2029 ($ million)
Data Table on Europe - Market size and forecast 2024-2029 ($ million)
Chart on Europe - Year-over-year growth 2024-2029 (%)
Data Table on Europe - Year-over-year growth 2024-2029 (%)
Chart on Regional Comparison - Europe
Data Table on Regional Comparison - Europe

11.5.1 Germany - Market size and forecast 2024-2029

Chart on Germany - Market size and forecast 2024-2029 ($ million)
Data Table on Germany - Market size and forecast 2024-2029 ($ million)
Chart on Germany - Year-over-year growth 2024-2029 (%)
Data Table on Germany - Year-over-year growth 2024-2029 (%)

11.5.2 UK - Market size and forecast 2024-2029

Chart on UK - Market size and forecast 2024-2029 ($ million)
Data Table on UK - Market size and forecast 2024-2029 ($ million)
Chart on UK - Year-over-year growth 2024-2029 (%)
Data Table on UK - Year-over-year growth 2024-2029 (%)

11.5.3 France - Market size and forecast 2024-2029

Chart on France - Market size and forecast 2024-2029 ($ million)
Data Table on France - Market size and forecast 2024-2029 ($ million)
Chart on France - Year-over-year growth 2024-2029 (%)
Data Table on France - Year-over-year growth 2024-2029 (%)

11.5.4 Italy - Market size and forecast 2024-2029

Chart on Italy - Market size and forecast 2024-2029 ($ million)
Data Table on Italy - Market size and forecast 2024-2029 ($ million)
Chart on Italy - Year-over-year growth 2024-2029 (%)
Data Table on Italy - Year-over-year growth 2024-2029 (%)

11.5.5 Spain - Market size and forecast 2024-2029

Chart on Spain - Market size and forecast 2024-2029 ($ million)
Data Table on Spain - Market size and forecast 2024-2029 ($ million)
Chart on Spain - Year-over-year growth 2024-2029 (%)
Data Table on Spain - Year-over-year growth 2024-2029 (%)

11.5.6 The Netherlands - Market size and forecast 2024-2029

Chart on The Netherlands - Market size and forecast 2024-2029 ($ million)
Data Table on The Netherlands - Market size and forecast 2024-2029 ($ million)
Chart on The Netherlands - Year-over-year growth 2024-2029 (%)
Data Table on The Netherlands - Year-over-year growth 2024-2029 (%)

11.6 South America - Market size and forecast 2024-2029

Chart on South America - Market size and forecast 2024-2029 ($ million)
Data Table on South America - Market size and forecast 2024-2029 ($ million)
Chart on South America - Year-over-year growth 2024-2029 (%)
Data Table on South America - Year-over-year growth 2024-2029 (%)
Chart on Regional Comparison - South America
Data Table on Regional Comparison - South America

11.6.1 Brazil - Market size and forecast 2024-2029

Chart on Brazil - Market size and forecast 2024-2029 ($ million)
Data Table on Brazil - Market size and forecast 2024-2029 ($ million)
Chart on Brazil - Year-over-year growth 2024-2029 (%)
Data Table on Brazil - Year-over-year growth 2024-2029 (%)

11.6.2 Argentina - Market size and forecast 2024-2029

Chart on Argentina - Market size and forecast 2024-2029 ($ million)
Data Table on Argentina - Market size and forecast 2024-2029 ($ million)
Chart on Argentina - Year-over-year growth 2024-2029 (%)
Data Table on Argentina - Year-over-year growth 2024-2029 (%)

11.6.3 Colombia - Market size and forecast 2024-2029

Chart on Colombia - Market size and forecast 2024-2029 ($ million)
Data Table on Colombia - Market size and forecast 2024-2029 ($ million)
Chart on Colombia - Year-over-year growth 2024-2029 (%)
Data Table on Colombia - Year-over-year growth 2024-2029 (%)

11.7 Middle East and Africa - Market size and forecast 2024-2029

Chart on Middle East and Africa - Market size and forecast 2024-2029 ($ million)
Data Table on Middle East and Africa - Market size and forecast 2024-2029 ($ million)
Chart on Middle East and Africa - Year-over-year growth 2024-2029 (%)
Data Table on Middle East and Africa - Year-over-year growth 2024-2029 (%)
Chart on Regional Comparison - Middle East and Africa
Data Table on Regional Comparison - Middle East and Africa

11.7.1 UAE - Market size and forecast 2024-2029

Chart on UAE - Market size and forecast 2024-2029 ($ million)
Data Table on UAE - Market size and forecast 2024-2029 ($ million)
Chart on UAE - Year-over-year growth 2024-2029 (%)
Data Table on UAE - Year-over-year growth 2024-2029 (%)

11.7.2 Saudi Arabia - Market size and forecast 2024-2029

Chart on Saudi Arabia - Market size and forecast 2024-2029 ($ million)
Data Table on Saudi Arabia - Market size and forecast 2024-2029 ($ million)
Chart on Saudi Arabia - Year-over-year growth 2024-2029 (%)
Data Table on Saudi Arabia - Year-over-year growth 2024-2029 (%)

11.7.3 South Africa - Market size and forecast 2024-2029

Chart on South Africa - Market size and forecast 2024-2029 ($ million)
Data Table on South Africa - Market size and forecast 2024-2029 ($ million)
Chart on South Africa - Year-over-year growth 2024-2029 (%)
Data Table on South Africa - Year-over-year growth 2024-2029 (%)

11.7.4 Israel - Market size and forecast 2024-2029

Chart on Israel - Market size and forecast 2024-2029 ($ million)
Data Table on Israel - Market size and forecast 2024-2029 ($ million)
Chart on Israel - Year-over-year growth 2024-2029 (%)
Data Table on Israel - Year-over-year growth 2024-2029 (%)

11.7.5 Turkey - Market size and forecast 2024-2029

Chart on Turkey - Market size and forecast 2024-2029 ($ million)
Data Table on Turkey - Market size and forecast 2024-2029 ($ million)
Chart on Turkey - Year-over-year growth 2024-2029 (%)
Data Table on Turkey - Year-over-year growth 2024-2029 (%)

11.8 Market opportunity by geography

Market opportunity by geography ($ million)
Data Tables on Market opportunity by geography ($ million)

12. Drivers, Challenges, and Opportunity

12.1 Market drivers

Increasing adoption of AI machine learning
Growing demand for highly accurate and unbiased data
Advancements in machine learning techniques

12.2 Market challenges

Data quality and Consistency Issues
Scalability and Cost Management
Data Privacy and Security Concerns

12.3 Impact of drivers and challenges

Impact of drivers and challenges in 2024 and 2029

12.4 Market opportunities

Emergence of automated and semi-Automated labeling tools
Rise of data centric AI approaches
Specialization and domain expertise

13. Competitive Landscape

13.1 Overview

13.2

Overview on criticality of inputs and factors of differentiation

13.3 Landscape disruption

Overview on factors of disruption

13.4 Industry risks

Impact of key risks on business

14. Competitive Analysis

14.1 Companies profiled

Companies covered

14.2 Company ranking index

14.3 Market positioning of companies

Matrix on companies position and classification

14.4 ALEGION

ALEGION - Overview
ALEGION - Product / Service
ALEGION - Key offerings
SWOT

14.5 APPEN Ltd.

APPEN Ltd. - Overview
APPEN Ltd. - Product / Service
APPEN Ltd. - Key offerings
SWOT

14.6 Clickworker GmbH

Clickworker GmbH - Overview
Clickworker GmbH - Product / Service
Clickworker GmbH - Key offerings
SWOT

14.7 Cloudfactory

Cloudfactory - Overview
Cloudfactory - Product / Service
Cloudfactory - Key offerings
SWOT

14.8 Cogito Tech LLC

Cogito Tech LLC - Overview
Cogito Tech LLC - Product / Service
Cogito Tech LLC - Key offerings
SWOT

14.9 DefinedCrowd Corp.

DefinedCrowd Corp. - Overview
DefinedCrowd Corp. - Product / Service
DefinedCrowd Corp. - Key offerings
SWOT

14.10 Hive

Hive - Overview
Hive - Product / Service
Hive - Key offerings
SWOT

14.11 iMerit

iMerit - Overview
iMerit - Product / Service
iMerit - Key offerings
SWOT

14.12 Kili Technology

Kili Technology - Overview
Kili Technology - Product / Service
Kili Technology - Key offerings
SWOT

14.13 Labelbox

Labelbox - Overview
Labelbox - Product / Service
Labelbox - Key offerings
SWOT

14.14 Samasource

Samasource - Overview
Samasource - Product / Service
Samasource - Key offerings
SWOT

14.15 Scale

Scale - Overview
Scale - Product / Service
Scale - Key offerings
SWOT

14.16 SuperAnnotate

SuperAnnotate - Overview
SuperAnnotate - Product / Service
SuperAnnotate - Key offerings
SWOT

14.17 TaskUs Inc.

TaskUs Inc. - Overview
TaskUs Inc. - Product / Service
TaskUs Inc. - Key offerings
SWOT

14.18 TELUS International Inc.

TELUS International Inc. - Overview
TELUS International Inc. - Product / Service
TELUS International Inc. - Key offerings
SWOT

15. Appendix

15.1 Scope of the report

Market definition
Objectives
Notes and caveats

15.2 Inclusions and exclusions checklist

Inclusions checklist
Exclusions checklist

15.3 Currency conversion rates for US$

15.4 Research methodology

15.5 Data procurement

Information sources

15.6 Data validation

15.7 Validation techniques employed for market sizing

15.8 Data synthesis

15.9 360 degree market analysis

15.10 List of abbreviations

Research Methodology

Technavio presents a detailed picture of the market by way of study, synthesis, and summation of data from multiple sources. The analysts have presented the various facets of the market with a particular focus on identifying the key industry influencers. The data thus presented is comprehensive, reliable, and the result of extensive research, both primary and secondary.

INFORMATION SOURCES

Primary sources

  • Manufacturers and suppliers
  • Channel partners
  • Industry experts
  • Strategic decision makers

Secondary sources

  • Industry journals and periodicals
  • Government data
  • Financial reports of key industry players
  • Historical data
  • Press releases

DATA ANALYSIS

Data Synthesis

  • Collation of data
  • Estimation of key figures
  • Analysis of derived insights

Data Validation

  • Triangulation with data models
  • Reference against proprietary databases
  • Corroboration with industry experts

REPORT WRITING

Qualitative

  • Market drivers
  • Market challenges
  • Market trends
  • Five forces analysis

Quantitative

  • Market size and forecast
  • Market segmentation
  • Geographical insights
  • Competitive landscape

Interested in this report?

Get your sample now to see our research methodology and insights!

Download Now

Frequently Asked Questions

AI Data Labeling market growth will increase by USD 1414.9 million during 2025-2029.

The AI Data Labeling market is expected to grow at a CAGR of 21.1% during 2025-2029.

AI Data Labeling market is segmented by Type (Text, Video, Image, Audio or speech) Method (Manual, Semi-supervised, Automatic) End-user (IT and technology, Automotive, Healthcare, Others)

ALEGION, APPEN Ltd., Aurora Innovation Inc., Clickworker GmbH, Cloudfactory, Cogito Tech LLC, DefinedCrowd Corp., Hive, Humans In The Loop, iMerit, Kili Technology, Labelbox, Samasource, Scale, SuperAnnotate, tagtog Sp. z o.o., TaskUs Inc., TELUS International Inc. are a few of the key vendors in the AI Data Labeling market.

North America will register the highest growth rate of 33.9% among the other regions. Therefore, the AI Data Labeling market in North America is expected to garner significant business opportunities for the vendors during the forecast period.

US, Canada, Mexico, China, India, Japan, South Korea, Australia, Indonesia, Germany, UK, France, Italy, Spain, The Netherlands, Brazil, Argentina, Colombia, UAE, Saudi Arabia, South Africa, Israel, Turkey

  • Increasing adoption of AI machine learning is the driving factor this market.

The AI Data Labeling market vendors should focus on grabbing business opportunities from the Type segment as it accounted for the largest market share in the base year.