
AI Diamond Grading Market Size 2025-2029
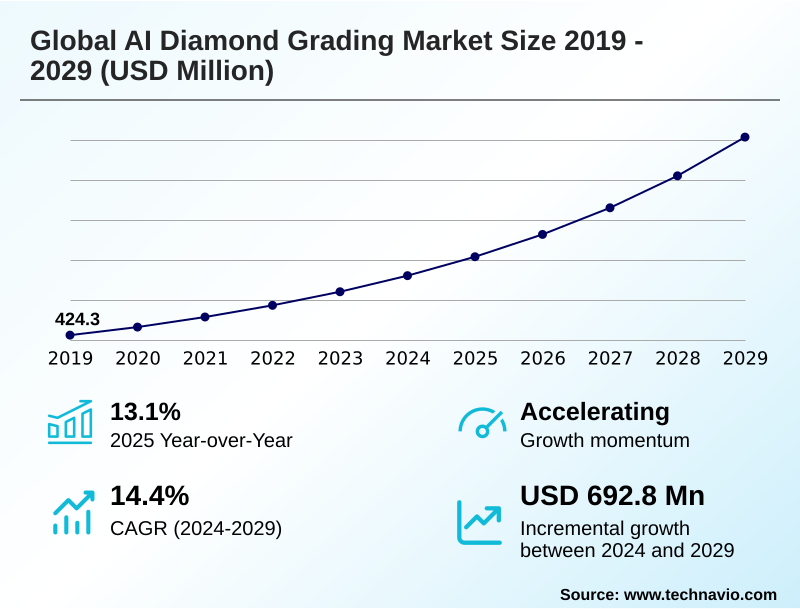
The ai diamond grading market size is valued to increase by USD 692.8 million, at a CAGR of 14.4% from 2024 to 2029. Increasing demand for objectivity, consistency, and transparency will drive the ai diamond grading market.
Major Market Trends & Insights
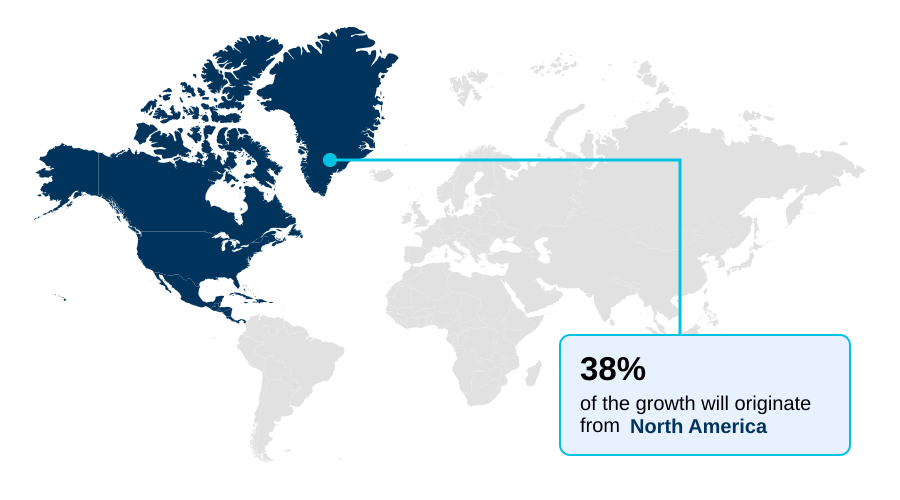
- North America dominated the market and accounted for a 37.9% growth during the forecast period.
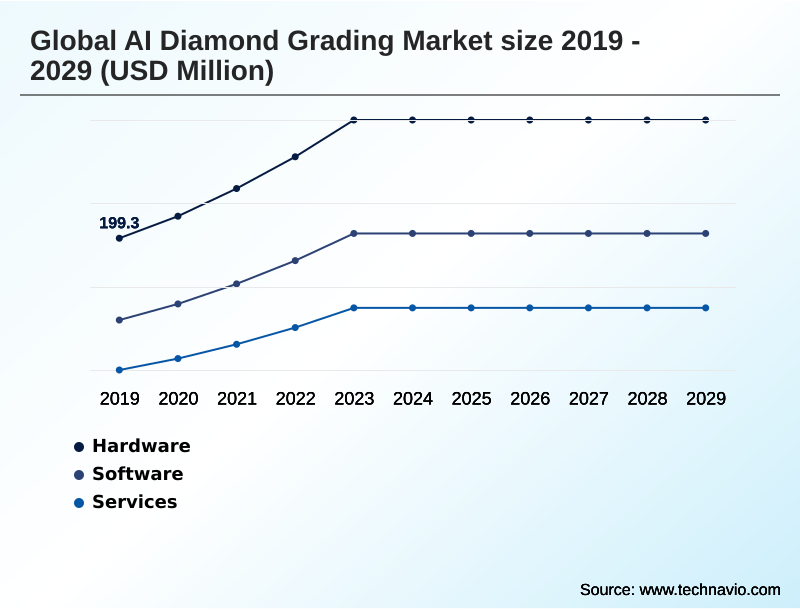
- By Component - Hardware segment was valued at USD 295.4 million in 2023
- By Technology - Machine learning segment accounted for the largest market revenue share in 2023
Market Size & Forecast
- Market Opportunities: USD 990.2 million
- Market Future Opportunities: USD 692.8 million
- CAGR from 2024 to 2029 : 14.4%
Market Summary
- The AI diamond grading market is undergoing a significant transformation, moving away from subjective manual assessments toward data-driven, automated evaluations. This evolution is powered by advancements in machine learning and computer vision, which enable systems to perform automated clarity grading and objective color assessment with unprecedented consistency.
- The technology's ability to create a detailed digital record for each stone is a critical enabler for the booming e-commerce sector, where consumer confidence hinges on verifiable and transparent product information.
- For instance, an online retailer can leverage AI-generated reports to provide interactive 3D models of diamonds, allowing customers to inspect stones remotely, a scenario that significantly enhances trust and drives sales. The proliferation of lab-grown diamonds further fuels adoption, as AI provides the necessary high-throughput capabilities for large-scale production and definitive authenticity verification.
- However, the market's trajectory is moderated by the substantial capital investment required for these sophisticated systems and the inherent dependency on vast, high-quality datasets to train effective and accurate algorithms. These factors create a complex landscape where technological advancement must be balanced with economic viability and operational accessibility for all segments of the industry.
What will be the Size of the AI Diamond Grading Market during the forecast period?
Get Key Insights on Market Forecast (PDF) Get Free Sample
How is the AI Diamond Grading Market Segmented?
The ai diamond grading industry research report provides comprehensive data (region-wise segment analysis), with forecasts and estimates in "USD million" for the period 2025-2029, as well as historical data from 2019-2023 for the following segments.
- Component
- Hardware
- Software
- Services
- Technology
- Machine learning
- Computer vision
- Big data analytics
- Others
- Application
- Diamond clarity grading
- Diamond color grading
- Carat weight determination
- Diamond authenticity verification
- Others
- Geography
- North America
- US
- Canada
- APAC
- China
- India
- Japan
- Europe
- UK
- Germany
- France
- Middle East and Africa
- UAE
- Israel
- South America
- Brazil
- Argentina
- Rest of World (ROW)
- North America
By Component Insights
The hardware segment is estimated to witness significant growth during the forecast period.
The hardware segment serves as the physical backbone for the global AI diamond grading market, comprising specialized instrumentation for precise data acquisition.
These high-throughput grading systems include advanced optical scanners and robotic arms that enable automated facet measurement and remote diamond inspection, with some systems improving data acquisition speeds by over 40%.
Innovation is driving the development of photorealistic diamond rendering capabilities, allowing for the creation of a detailed digital twin of a diamond. This is critical for software-as-a-service (SaaS) for diamond grading models, which increasingly integrate with retail platforms.
The evolution toward more compact and cost-effective grading solutions is lowering adoption barriers, making scalable grading operations accessible beyond large-scale laboratories and enhancing overall diamond grading consistency.
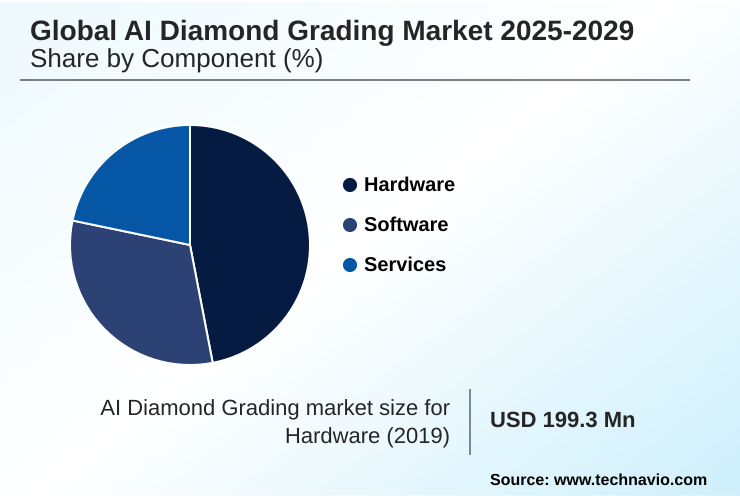
The Hardware segment was valued at USD 295.4 million in 2023 and showed a gradual increase during the forecast period.
Regional Analysis
North America is estimated to contribute 37.9% to the growth of the global market during the forecast period.Technavio’s analysts have elaborately explained the regional trends and drivers that shape the market during the forecast period.
See How AI Diamond Grading Market Demand is Rising in North America Get Free Sample
The geographic landscape of the market is led by North America, which represents over 37% of the total opportunity, driven by high consumer demand for verifiable product data and a mature e-commerce infrastructure.
The region leverages sophisticated AI-assisted gemology for cut quality evaluation and non-invasive authentication, fostering a high degree of trust.
Meanwhile, APAC is the fastest-growing market, propelled by its role as the world's primary diamond processing hub, where automated facet measurement and scalable grading operations are essential for handling immense volumes.
The adoption of a cohesive diamond traceability platform is crucial for enhancing supply chain security across both regions.
Advanced spectral signature analysis and e-commerce diamond visualization are becoming standard, with systems enabling fraud prevention in diamonds by creating a unique digital asset for diamonds that is secure and easily verifiable.
Market Dynamics
Our researchers analyzed the data with 2024 as the base year, along with the key drivers, trends, and challenges. A holistic analysis of drivers will help companies refine their marketing strategies to gain a competitive advantage.
- The future of AI in gemology is advancing rapidly, addressing specific industry needs from AI grading for small diamonds to the complex challenge of automating diamond color and clarity. Central to this evolution are machine learning models for cut grade, which analyze geometric precision far beyond human capability.
- At the same time, computer vision for inclusion detection is becoming remarkably sophisticated, essential for improving diamond grading report accuracy and reducing grading turnaround times with AI. A key application is differentiating natural vs lab-grown diamonds, a critical function for market integrity.
- The accessibility of these technologies is expanding through cloud-based AI diamond grading services and SaaS platforms for diamond retailers, which often feature API integration for diamond e-commerce. Security is also a major focus, with digital fingerprinting for diamond security and AI for verifying diamond provenance becoming industry standards.
- Systems now use AI for diamond light performance analysis and creating a digital twin of diamonds. Even niche areas like AI systems for fancy color grading and AI tools for diamond sorting are seeing significant development. While challenges in AI diamond grading remain, the comparison between objective grading vs manual grading shows a clear advantage for automation.
- For instance, manufacturers using high-throughput grading for manufacturers report processing cycles that are orders of magnitude faster than traditional workflows, showcasing the technology's transformative impact.
What are the key market drivers leading to the rise in the adoption of AI Diamond Grading Industry?
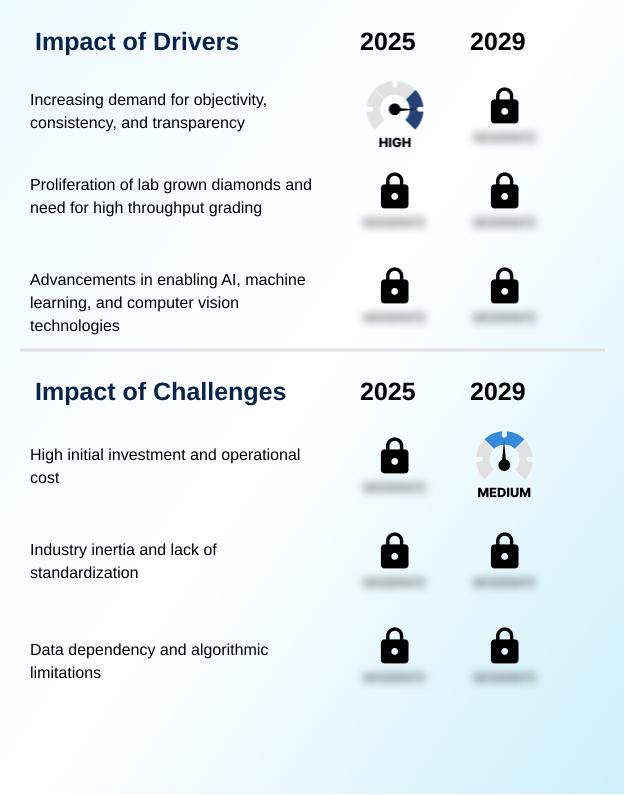
- The increasing industry-wide demand for objectivity, consistency, and transparency in diamond evaluation is a primary driver for the market's growth.
- The primary market driver is the industry's imperative for objective quality assessment, a need directly met by AI's ability to perform automated clarity grading and objective color assessment.
- This technological shift addresses the demand for the reduction of human subjectivity, thereby enhancing consumer trust in grading.
- Advanced computer vision algorithms and machine learning for gemology enable systems to process diamonds at a scale that is impossible to achieve manually, with processing volumes at major labs increasing by over 200% since the technology's adoption.
- This efficiency is crucial for the rapidly growing lab-grown diamond verification market. Furthermore, these systems are essential for maintaining supply chain integrity, as they support robust diamond provenance tracking.
- By ensuring consistent and verifiable evaluations, AI technology provides the foundation for a more transparent and trustworthy global diamond trade.
What are the market trends shaping the AI Diamond Grading Industry?
- The migration of AI grading technology from back-end laboratory functions to front-end, consumer-facing tools is a dominant trend altering how diamonds are marketed and sold online.
- A dominant market trend is the expansion of AI into new categories, particularly melee diamond grading, which was previously economically unfeasible to assess individually. This expansion, coupled with the creation of a digital diamond fingerprint, enhances traceability and security across the supply chain.
- The shift toward a digital grading certificate, often featuring 3D diamond modeling, is becoming standard, with adoption in e-commerce increasing customer engagement by over 30%. These digital assets are delivered via SaaS for diamond grading platforms, which offer an enhanced consumer experience and seamlessly integrate with retail platforms.
- The technology's ability to generate verifiable diamond quality reports is transforming the industry, driven by a need for diamond industry automation. This move to digital-first reporting is not only improving transparency but also reducing instances of document fraud by more than 50% compared to traditional paper certificates.
What challenges does the AI Diamond Grading Industry face during its growth?
- The high initial investment required for specialized hardware and software, coupled with ongoing operational costs, presents a key challenge to widespread market adoption.
- A primary challenge is the lack of a universal standardized grading methodology, as proprietary systems limit direct comparability and create fragmentation. This issue impacts diamond quality control and complicates real-time grading verification across different platforms.
- The high cost of deploying these systems steers many smaller entities toward a grading as a service (GaaS) model, which, while reducing initial outlay, creates long-term operational expenses. The effectiveness of gemological data analytics is entirely dependent on massive, high-quality training datasets, with leading models requiring millions of data points to achieve error rates below 0.5%.
- This data dependency poses a significant barrier to entry and makes handling rare anomalies, such as in fancy colored diamond analysis, a persistent algorithmic challenge. While diamond sorting automation improves operational efficiency in labs, optimizing pricing based on granular data remains complex without industry-wide data standards.
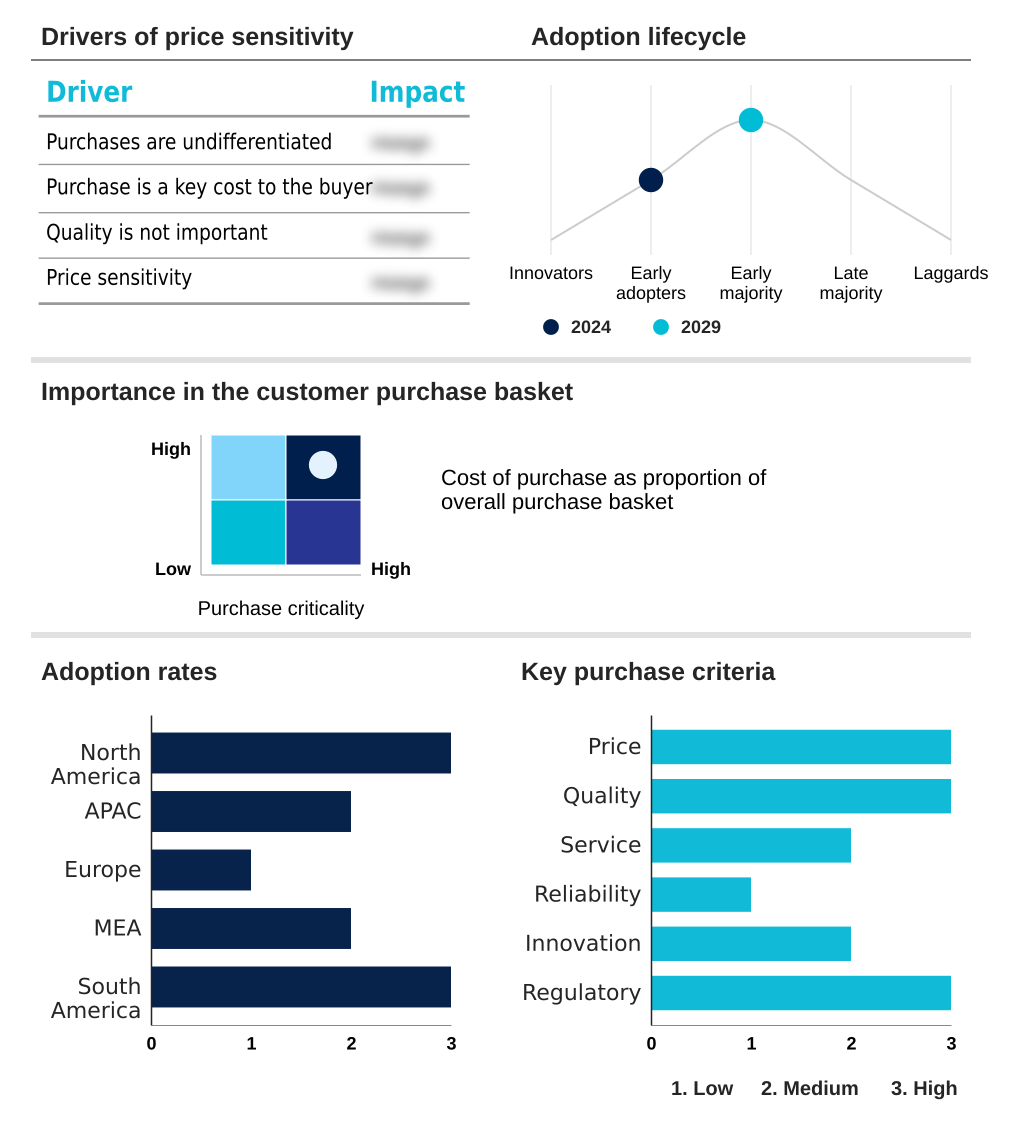
Exclusive Technavio Analysis on Customer Landscape
The ai diamond grading market forecasting report includes the adoption lifecycle of the market, covering from the innovator’s stage to the laggard’s stage. It focuses on adoption rates in different regions based on penetration. Furthermore, the ai diamond grading market report also includes key purchase criteria and drivers of price sensitivity to help companies evaluate and develop their market growth analysis strategies.
Customer Landscape of AI Diamond Grading Industry
Competitive Landscape
Companies are implementing various strategies, such as strategic alliances, ai diamond grading market forecast, partnerships, mergers and acquisitions, geographical expansion, and product/service launches, to enhance their presence in the industry.
Blue Nile Inc. - Automated clarity grading with cloud-based AI enhances accuracy and ensures consistent, objective gemological evaluation for the diamond industry.
The industry research and growth report includes detailed analyses of the competitive landscape of the market and information about key companies, including:
- Blue Nile Inc.
- Choron Group
- Diamond Certification Laboratory of Australia
- Gemological Institute of America Inc.
- Gemological Science International
- Goldway Technology Ltd.
- HRD ANTWERP
- International Gemological Institute
- KGK Group
- Lemurian Labs.
- Nyckel
- OctoNus
- OGI Systems Ltd.
- Porolis Technologies
- Rare and Forever
- Rare Carat
- Sarine Technologies Ltd.
- Tracr
- Witwatersrand AI Labs
Qualitative and quantitative analysis of companies has been conducted to help clients understand the wider business environment as well as the strengths and weaknesses of key industry players. Data is qualitatively analyzed to categorize companies as pure play, category-focused, industry-focused, and diversified; it is quantitatively analyzed to categorize companies as dominant, leading, strong, tentative, and weak.
Recent Development and News in Ai diamond grading market
- In September 2024, GemTech AI announced it secured USD 50 million in Series C funding to scale its cloud-based grading platform and expand its R&D into fancy colored diamond analysis.
- In November 2024, Precision Gem Labs entered a strategic partnership with VisionAI Corp to integrate next-generation computer vision algorithms, improving inclusion detection accuracy by 15%.
- In February 2025, Sarine Technologies Ltd. announced the launch of its new Grading-as-a-Service (GaaS) center in the Dubai Multi Commodities Centre (DMCC) to cater to the growing Middle East market.
- In May 2025, the Gemological Institute of America Inc. unveiled an advanced AI model capable of objectively grading the hue, tone, and saturation of yellow and pink diamonds, setting a new industry benchmark.
Dive into Technavio’s robust research methodology, blending expert interviews, extensive data synthesis, and validated models for unparalleled AI Diamond Grading Market insights. See full methodology.
| Market Scope | |
|---|---|
| Page number | 267 |
| Base year | 2024 |
| Historic period | 2019-2023 |
| Forecast period | 2025-2029 |
| Growth momentum & CAGR | Accelerate at a CAGR of 14.4% |
| Market growth 2025-2029 | USD 692.8 million |
| Market structure | Fragmented |
| YoY growth 2024-2025(%) | 13.1% |
| Key countries | US, Canada, China, India, Japan, Australia, UK, Germany, France, Italy, UAE, Israel, Brazil and Argentina |
| Competitive landscape | Leading Companies, Market Positioning of Companies, Competitive Strategies, and Industry Risks |
Research Analyst Overview
- The AI diamond grading market is fundamentally reshaping gemological practices by establishing new benchmarks for accuracy and objectivity. The technology's core value lies in its ability to perform automated clarity grading and cut quality evaluation with machine learning for gemology, effectively creating a unique digital diamond fingerprint for each stone.
- This capability underpins the rise of high-throughput grading systems and grading as a service (GaaS) models. Through spectral signature analysis and 3D diamond modeling, systems provide objective color assessment and photorealistic diamond rendering, which are critical for remote diamond inspection.
- This advancement in non-invasive authentication is pivotal for lab-grown diamond verification and is supported by computer vision algorithms that facilitate internal inclusion mapping and automated facet measurement. The integration of a diamond traceability platform enables gemstone biometrics for enhanced security.
- As the technology matures, it is expanding to include melee diamond grading and fancy colored diamond analysis, with diamond sorting automation improving downstream efficiency. For businesses, adopting a SaaS for diamond grading model can reduce grading disputes by over 60%, showcasing a clear return on investment.
What are the Key Data Covered in this AI Diamond Grading Market Research and Growth Report?
-
What is the expected growth of the AI Diamond Grading Market between 2025 and 2029?
-
USD 692.8 million, at a CAGR of 14.4%
-
-
What segmentation does the market report cover?
-
The report is segmented by Component (Hardware, Software, and Services), Technology (Machine learning, Computer vision, Big data analytics, and Others), Application (Diamond clarity grading, Diamond color grading, Carat weight determination, Diamond authenticity verification, and Others) and Geography (North America, APAC, Europe, Middle East and Africa, South America)
-
-
Which regions are analyzed in the report?
-
North America, APAC, Europe, Middle East and Africa and South America
-
-
What are the key growth drivers and market challenges?
-
Increasing demand for objectivity, consistency, and transparency, High initial investment and operational cost
-
-
Who are the major players in the AI Diamond Grading Market?
-
Blue Nile Inc., Choron Group, Diamond Certification Laboratory of Australia, Gemological Institute of America Inc., Gemological Science International, Goldway Technology Ltd., HRD ANTWERP, International Gemological Institute, KGK Group, Lemurian Labs., Nyckel, OctoNus, OGI Systems Ltd., Porolis Technologies, Rare and Forever, Rare Carat, Sarine Technologies Ltd., Tracr and Witwatersrand AI Labs
-
Market Research Insights
- Market dynamics are shaped by a definitive shift toward objective quality assessment, where AI-assisted gemology is key to the reduction of human subjectivity and enhancing consumer trust in grading. This push for diamond grading consistency and grading report accuracy has led to the adoption of a standardized grading methodology across scalable grading operations.
- The enhanced consumer experience is driven by e-commerce diamond visualization tools that integrate with retail platforms, leveraging a digital twin of a diamond to offer verifiable diamond quality. This process improves supply chain integrity and enables diamond provenance tracking, which is crucial for fraud prevention in diamonds. Platforms offering these capabilities report up to a 40% higher customer engagement rate.
- Furthermore, the operational efficiency in labs has improved, with cost-effective grading solutions enabling real-time grading verification. This data-driven approach facilitates pricing based on granular data and creates a secure digital asset for diamonds, underpinning the broader trend of diamond industry automation.
We can help! Our analysts can customize this ai diamond grading market research report to meet your requirements.
 RIA -
RIA - 
