
AI Testing And Validation Market Size 2026-2030
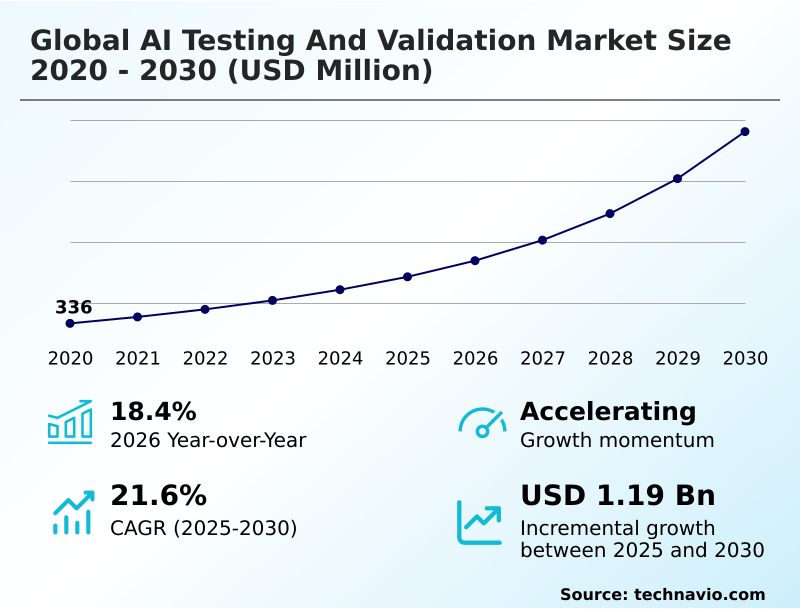
The ai testing and validation market size is valued to increase by USD 1.19 billion, at a CAGR of 21.6% from 2025 to 2030. Strategic proliferation of generative AI and autonomous agent validation will drive the ai testing and validation market.
Major Market Trends & Insights
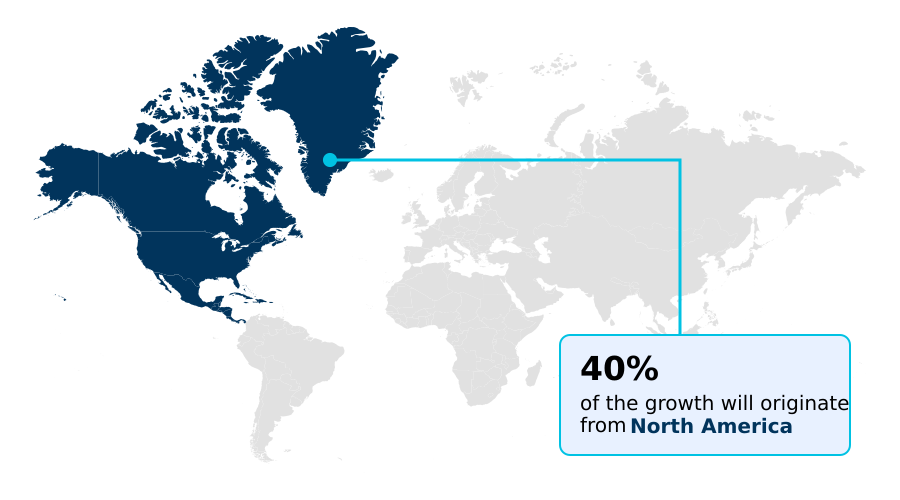
- North America dominated the market and accounted for a 39.5% growth during the forecast period.
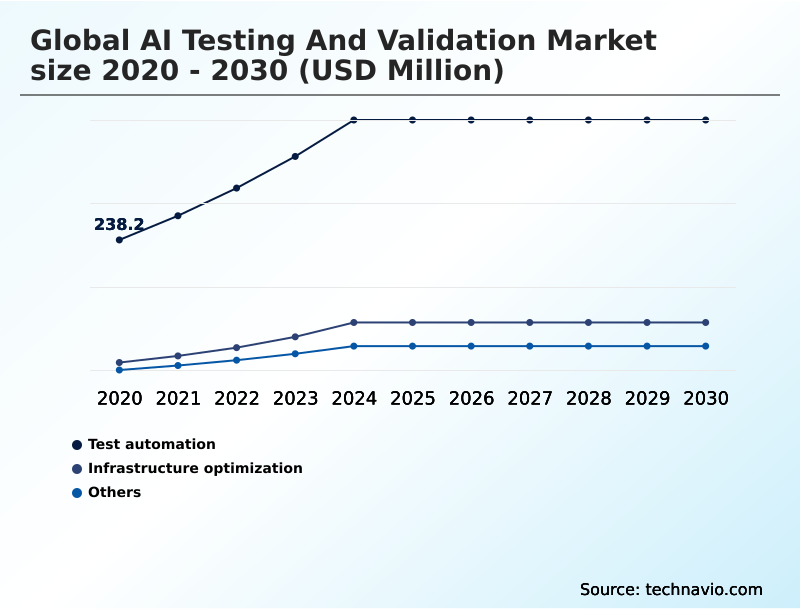
- By Application - Test automation segment was valued at USD 417.9 million in 2024
- By Deployment - Cloud based segment accounted for the largest market revenue share in 2024
Market Size & Forecast
- Market Opportunities: USD 1.57 billion
- Market Future Opportunities: USD 1.19 billion
- CAGR from 2025 to 2030 : 21.6%
Market Summary
- The AI testing and validation market is undergoing a profound transformation, driven by the need to ensure the reliability and ethical compliance of advanced artificial intelligence systems. This market provides specialized software frameworks and automated tools for robustness simulation frameworks and subjecting models to rigorous stress tests.
- Core activities include non-deterministic output evaluation, data integrity checks, and adversarial attack simulation to identify hidden biases, performance drift, and vulnerabilities before deployment. The rise of generative AI has intensified the focus on hallucination rate measurement and model fairness metrics.
- For instance, in algorithmic financial trading, firms use continuous validation loops and risk-based assurance to test systems that manage billions in assets, ensuring that automated decisions comply with regulatory standards.
- This move from reactive bug fixing to proactive AI-first quality engineering and AI governance standards is essential for deploying mission-critical applications in sectors such as autonomous transportation and clinical diagnostics, where system failure is not an option. The emphasis on ethical AI validation and AI system reliability through third-party AI certification is becoming a non-negotiable aspect of the development lifecycle.
What will be the Size of the AI Testing And Validation Market during the forecast period?
Get Key Insights on Market Forecast (PDF) Get Free Sample
How is the AI Testing And Validation Market Segmented?
The ai testing and validation industry research report provides comprehensive data (region-wise segment analysis), with forecasts and estimates in "USD million" for the period 2026-2030, as well as historical data from 2020-2024 for the following segments.
- Application
- Test automation
- Infrastructure optimization
- Others
- Deployment
- Cloud based
- On premises
- End-user
- IT and telecom
- BFSI
- Healthcare
- Manufacturing
- Others
- Geography
- North America
- US
- Canada
- Mexico
- Europe
- Germany
- UK
- France
- APAC
- China
- Japan
- India
- South America
- Brazil
- Argentina
- Middle East and Africa
- UAE
- Saudi Arabia
- South Africa
- Rest of World (ROW)
- North America
By Application Insights
The test automation segment is estimated to witness significant growth during the forecast period.
The test automation segment is pivotal for efficiency in the AI testing and validation market, moving beyond script maintenance to embrace autonomous test evolution.
Organizations now utilize self-healing test agents and agentic automation platforms to address the complexities of generative AI validation. This AI-first quality engineering approach focuses on behavioral consistency testing and mitigating risks like prompt injection vulnerability.
The use of digital twin simulation and low-code autonomous testing is integrated into MLOps validation pipelines, aligning with AI governance guidelines.
This shift to intelligent frameworks has resulted in a 30% faster test execution rate for platforms integrating generative red-teaming, reflecting a move toward compliance-driven testing and ethical AI validation for reliable software delivery.
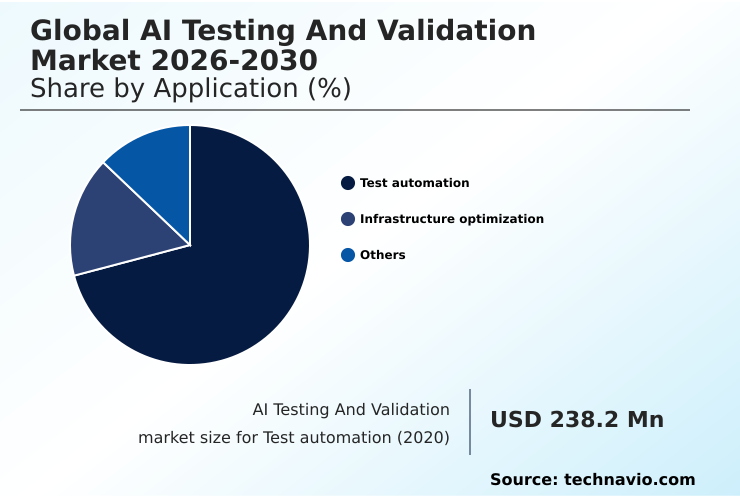
The Test automation segment was valued at USD 417.9 million in 2024 and showed a gradual increase during the forecast period.
Regional Analysis
North America is estimated to contribute 39.5% to the growth of the global market during the forecast period.Technavio’s analysts have elaborately explained the regional trends and drivers that shape the market during the forecast period.
See How AI Testing And Validation Market Demand is Rising in North America Get Free Sample
The geographic landscape is led by North America, which accounts for nearly 39.5% of the market's incremental growth, driven by advanced AI-generated code security and multi-modal system validation.
Europe follows, with a strong focus on regulatory adherence and AI audit requirements. Meanwhile, the APAC region is expanding at the fastest rate, with a CAGR of 22.6%, fueled by investments in sovereign AI safety and physical AI validation.
Across regions, there is a growing demand for algorithmic opacity solutions and data drift detection tools, particularly for computer vision validation.
Enterprises are adopting compliance-as-a-service platforms and real-time production monitoring to manage the full AI model lifecycle management, often incorporating human-in-the-loop testing to ensure safety and accuracy in deployments.
Market Dynamics
Our researchers analyzed the data with 2025 as the base year, along with the key drivers, trends, and challenges. A holistic analysis of drivers will help companies refine their marketing strategies to gain a competitive advantage.
- The AI testing and validation market is evolving to address highly specific enterprise needs, moving beyond basic performance checks. A primary focus is on evaluating non-deterministic large language models, where outputs are probabilistic and require sophisticated analysis. This extends to validating autonomous multi-step business logic, ensuring AI agents can execute complex workflows reliably.
- To achieve this, firms are increasingly simulating rare events with synthetic data, a method that proves essential for testing AI robustness without data privacy compromise. Regulatory pressures are also shaping the landscape, mandating AI compliance with European Union AI Act and compelling organizations to assess model fairness against adversarial attacks.
- The core technical challenge remains validating probabilistic outputs in generative AI, which has led to platforms designed for managing AI test suites without human intervention. These systems often use predictive quality models to detect failures before they impact production. Furthermore, the rise of sovereign AI initiatives necessitates the safety testing of foundational AI models to meet national security standards.
- In sectors like finance, validating multi-modal AI against data protection laws is now a standard practice. The ability to provide audit trails for AI decisions is critical for transparency. This specialized demand requires new skills, with a focus on navigating non-deterministic systems in quality engineering.
- For instance, in one documented supply chain use case, advanced validation frameworks capable of distinguishing model defects from probabilistic variation reduced false-positive alerts by over half compared to legacy systems. This allows teams to focus on automating red-teaming for enterprise applications and integrating validation into CI/CD pipelines for validating AI for mission-critical sectors.
- The entire process is now centered on auditing AI for bias and transparency and systematically stress-testing models with adversarial simulation while monitoring AI for performance and drift.
What are the key market drivers leading to the rise in the adoption of AI Testing And Validation Industry?
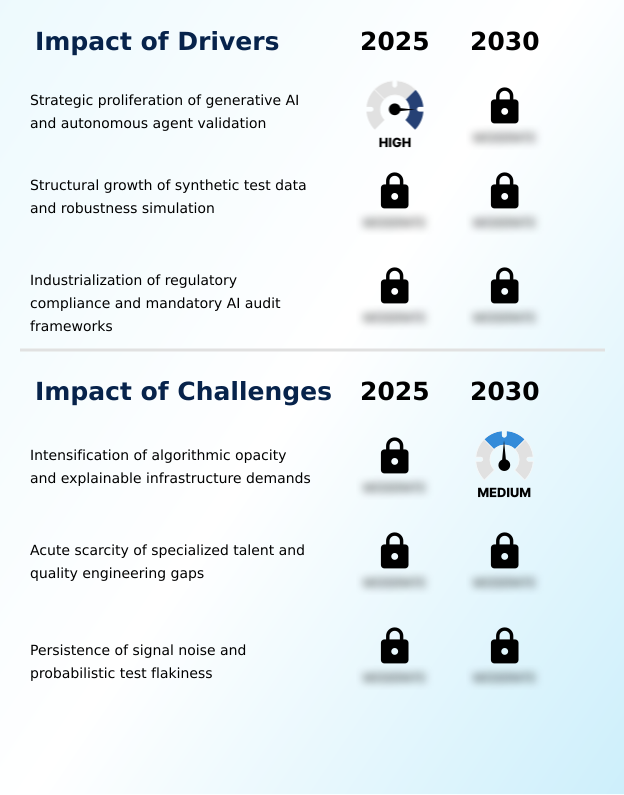
- The strategic proliferation of generative AI and the corresponding need for autonomous agent validation are key drivers propelling market growth.
- Market drivers are rooted in the industrialization of AI, compelling firms to adopt risk-based assurance models. The demand for non-deterministic output evaluation is met by LLM-as-a-judge architecture and holistic validation techniques.
- Growth is fueled by the strategic use of synthetic data, with that market expanding at over 35% annually, enabling robust sensor-fusion algorithm testing using physics-based simulators. This allows for the creation of balanced training-and-test distributions without compromising data privacy.
- Automated data labeling and automated bias mitigation streamline workflows, improving operational reliability monitoring.
- The push for regulatory adherence, such as compliance with the EU AI Act, mandates probabilistic test analysis and the verification of model fairness metrics, preventing issues like security filter circumvention.
What are the market trends shaping the AI Testing And Validation Industry?
- The market is experiencing a significant trend toward the inclusion of agentic workflows. This shift facilitates autonomous test evolution for complex AI systems.
- Market trends are centered on managing the complexity of next-generation AI, with a strong focus on agentic workflow testing and AI bias testing. Organizations are implementing continuous validation loops and automated guardrail implementation to ensure model reliability. The expansion of multi-agent AI systems has led to a need for third-party AI certification and adherence to AI governance standards.
- Platforms are incorporating interpretability layer integration for better transparency documentation protocols and techniques for linguistic nuance validation. This addresses challenges like test flakiness reduction. A key development is the adoption of 1.6-terabit-ready test observabilities. This advanced computer vision validation and adversarial attack simulation has led to a 30% faster test execution rate, crucial for measuring metrics like hallucination rate measurement.
What challenges does the AI Testing And Validation Industry face during its growth?
- A key challenge affecting industry growth is the intensification of algorithmic opacity, which heightens the demand for explainable infrastructure.
- Key market challenges revolve around technical complexity and resource scarcity. The need for explainable validation frameworks is paramount, as is the demand for skilled AI-first quality engineering professionals. The talent gap is severe, with reports indicating only one qualified candidate for every ten open validation positions. This scarcity hinders effective model performance monitoring, data drift detection, and adversarial resilience testing.
- Firms struggle with signal-to-noise ratio optimization and the high cost of generating high-fidelity synthetic data for edge-case scenario simulation. Integrating tests into MLOps validation pipelines and managing stochastic temperature settings requires advanced expertise. These challenges underscore the importance of algorithmic accountability standards, human-in-the-loop testing, and robust physical AI validation to build trust.
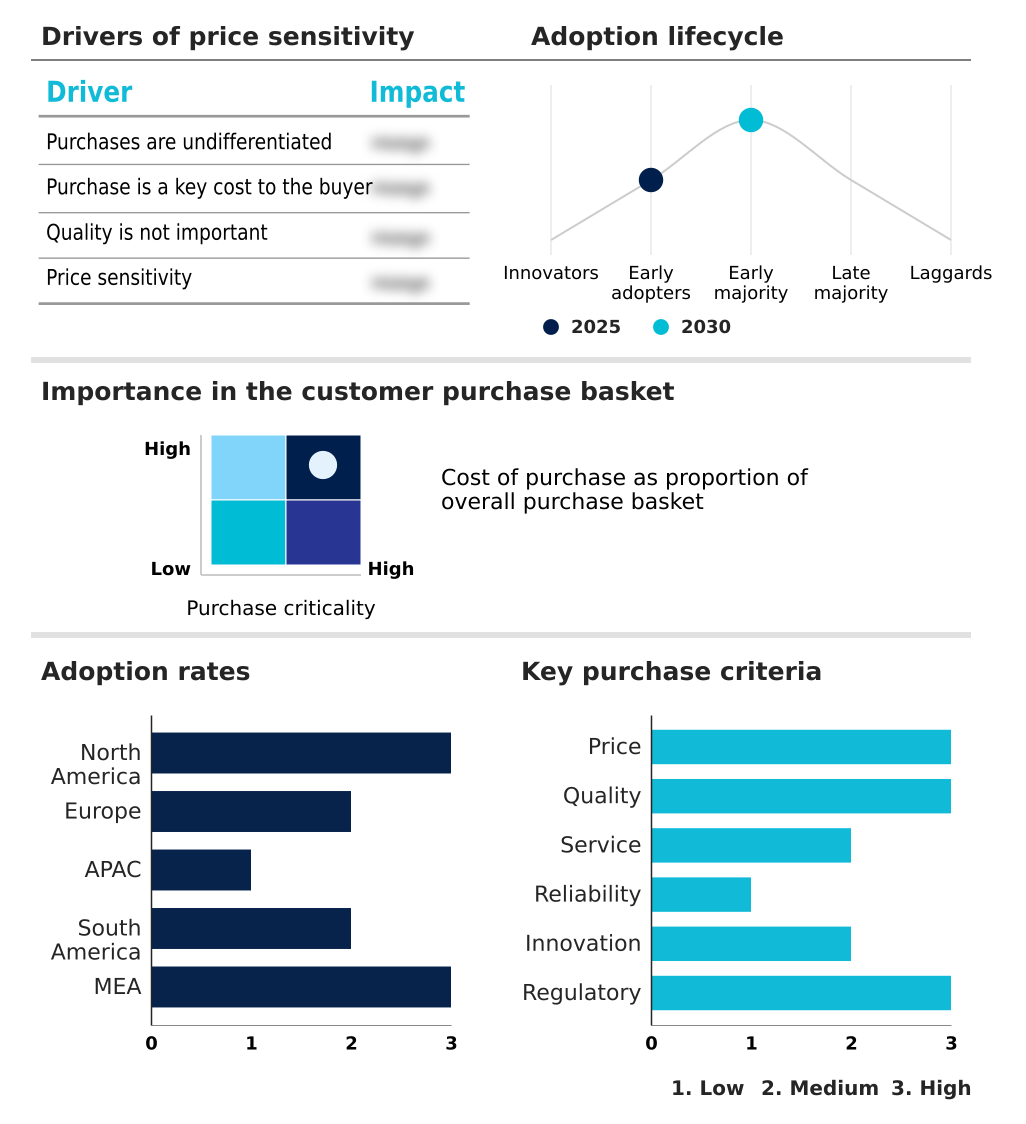
Exclusive Technavio Analysis on Customer Landscape
The ai testing and validation market forecasting report includes the adoption lifecycle of the market, covering from the innovator’s stage to the laggard’s stage. It focuses on adoption rates in different regions based on penetration. Furthermore, the ai testing and validation market report also includes key purchase criteria and drivers of price sensitivity to help companies evaluate and develop their market growth analysis strategies.
Customer Landscape of AI Testing And Validation Industry
Competitive Landscape
Companies are implementing various strategies, such as strategic alliances, ai testing and validation market forecast, partnerships, mergers and acquisitions, geographical expansion, and product/service launches, to enhance their presence in the industry.
ACCELQ Inc. - Specialized offerings include AI-powered visual validation and automated regression testing to ensure cross-browser functional and user interface integrity for modern digital applications.
The industry research and growth report includes detailed analyses of the competitive landscape of the market and information about key companies, including:
- ACCELQ Inc.
- Applitools Ltd.
- BugRaptors Pvt Ltd
- Cigniti Technologies Ltd.
- Functionize Inc.
- Qualitest Group Ltd.
- KiwiQA Services Pvt. Ltd.
- mabl Inc.
- QA TestLab Solutions Ltd.
- QASource
- QualiTest Group
- Qualitrix Technologies
- Rainforest QA
- Scale AI
- Testfort
- TestingXperts
- Testlio Inc.
- testRigor Inc.
- Tricentis GmbH
- Virtuoso QA Ltd.
Qualitative and quantitative analysis of companies has been conducted to help clients understand the wider business environment as well as the strengths and weaknesses of key industry players. Data is qualitatively analyzed to categorize companies as pure play, category-focused, industry-focused, and diversified; it is quantitatively analyzed to categorize companies as dominant, leading, strong, tentative, and weak.
Recent Development and News in Ai testing and validation market
- In October, 2024, Applitools was recognized as a top performer in the autonomous testing platforms landscape, reflecting an industry shift toward utilizing agentic automation for validating complex user interfaces.
- In January, 2025, Scale AI announced its strategic roadmap, emphasizing the expansion of its Safety, Evaluation, and Alignment Lab (SEAL) to focus on physical AI and robotics validation, securing over $1 billion in new business.
- In March, 2025, Tricentis GmbH launched its end-to-end Enterprise Agentic Quality Engineering Platform, which leverages AI agents to govern AI-generated code and reduce cloud migration testing timelines from months to one week.
- In April, 2025, The National Company Law Tribunal reserved its order for the amalgamation of Cigniti Technologies Ltd. into Coforge Limited, a strategic move to create a unified powerhouse in AI-driven digital assurance.
Dive into Technavio’s robust research methodology, blending expert interviews, extensive data synthesis, and validated models for unparalleled AI Testing And Validation Market insights. See full methodology.
| Market Scope | |
|---|---|
| Page number | 294 |
| Base year | 2025 |
| Historic period | 2020-2024 |
| Forecast period | 2026-2030 |
| Growth momentum & CAGR | Accelerate at a CAGR of 21.6% |
| Market growth 2026-2030 | USD 1188.1 million |
| Market structure | Fragmented |
| YoY growth 2025-2026(%) | 18.4% |
| Key countries | US, Canada, Mexico, Germany, UK, France, Italy, Spain, The Netherlands, China, Japan, India, South Korea, Australia, Indonesia, Brazil, Argentina, Chile, UAE, Saudi Arabia, South Africa, Israel and Turkey |
| Competitive landscape | Leading Companies, Market Positioning of Companies, Competitive Strategies, and Industry Risks |
Research Analyst Overview
- The AI testing and validation market has reached a critical inflection point, moving decisively toward proactive risk-based assurance and compliance-driven testing. The institutionalization of generative AI validation and autonomous agent validation is no longer a niche capability but a core enterprise requirement.
- This shift necessitates sophisticated robustness simulation frameworks and the large-scale use of synthetic test data generation, a sub-segment expanding at over 35% annually. Key boardroom decisions now revolve around AI audit requirements and adopting LLM-as-a-judge architecture for non-deterministic output evaluation. Modern platforms focus on agentic workflow testing, hallucination rate measurement, and continuous validation loops.
- In practice, this means implementing computer vision validation, sensor-fusion algorithm testing, and digital twin simulation. The process is streamlined by automated data labeling. Regulatory pressures mandate stringent AI bias testing, transparency documentation protocols, and adversarial attack simulation, pushing the agenda for sovereign AI safety.
- Key trends include autonomous test evolution with self-healing test agents, multi-modal system validation, and generative red-teaming to mitigate prompt injection vulnerability and jailbreaking risk mitigation. Addressing algorithmic opacity solutions requires explainable validation frameworks for probabilistic test analysis.
- This has created a demand for AI-first quality engineering professionals skilled in adversarial resilience testing and model performance monitoring, including data drift detection using high-fidelity synthetic data and model fairness metrics, especially with evolving stochastic temperature settings.
What are the Key Data Covered in this AI Testing And Validation Market Research and Growth Report?
-
What is the expected growth of the AI Testing And Validation Market between 2026 and 2030?
-
USD 1.19 billion, at a CAGR of 21.6%
-
-
What segmentation does the market report cover?
-
The report is segmented by Application (Test automation, Infrastructure optimization, and Others), Deployment (Cloud based, and On premises), End-user (IT and telecom, BFSI, Healthcare, Manufacturing, and Others) and Geography (North America, Europe, APAC, South America, Middle East and Africa)
-
-
Which regions are analyzed in the report?
-
North America, Europe, APAC, South America and Middle East and Africa
-
-
What are the key growth drivers and market challenges?
-
Strategic proliferation of generative AI and autonomous agent validation, Intensification of algorithmic opacity and explainable infrastructure demands
-
-
Who are the major players in the AI Testing And Validation Market?
-
ACCELQ Inc., Applitools Ltd., BugRaptors Pvt Ltd, Cigniti Technologies Ltd., Functionize Inc., Qualitest Group Ltd., KiwiQA Services Pvt. Ltd., mabl Inc., QA TestLab Solutions Ltd., QASource, QualiTest Group, Qualitrix Technologies, Rainforest QA, Scale AI, Testfort, TestingXperts, Testlio Inc., testRigor Inc., Tricentis GmbH and Virtuoso QA Ltd.
-
Market Research Insights
- Market dynamics are defined by a shift toward proactive risk mitigation, with firms leveraging standardized validation frameworks to ensure AI system reliability. This includes advanced holistic validation techniques and operational reliability monitoring to manage the complexities of modern AI. By employing edge-case scenario simulation and balanced training-and-test distributions, organizations can address potential security vulnerabilities, including security filter circumvention.
- The adoption of self-healing capabilities has proven highly effective, with some platforms reducing test maintenance labor by up to 70%. Furthermore, advanced validation services that automate adversarial testing deliver a 30% faster test execution rate compared to manual methods, underscoring the drive for efficiency and robustness in AI deployments.
We can help! Our analysts can customize this ai testing and validation market research report to meet your requirements.
 RIA -
RIA - 
