
AI For Customer Experience Enhancement Market Size 2025-2029
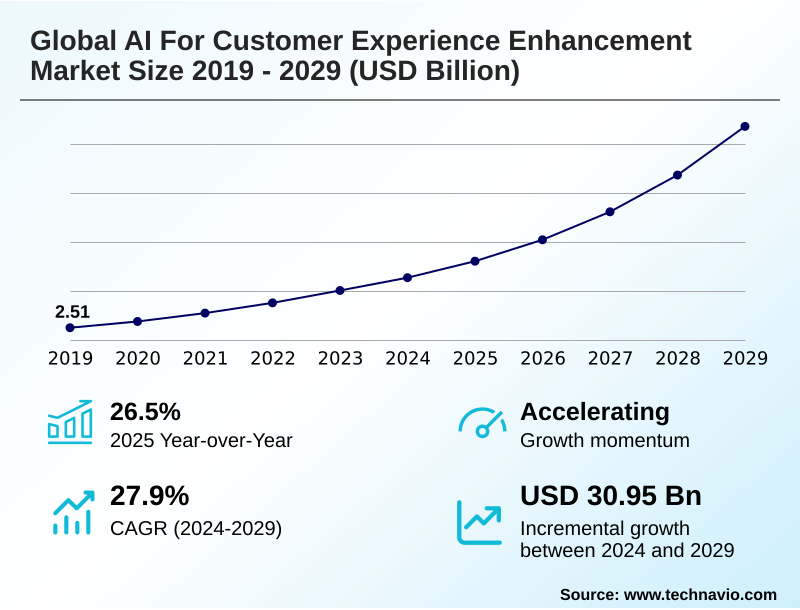
The ai for customer experience enhancement market size is valued to increase by USD 30.95 billion, at a CAGR of 27.9% from 2024 to 2029. Surging consumer demand for hyper-personalization and seamless experiences will drive the ai for customer experience enhancement market.
Major Market Trends & Insights
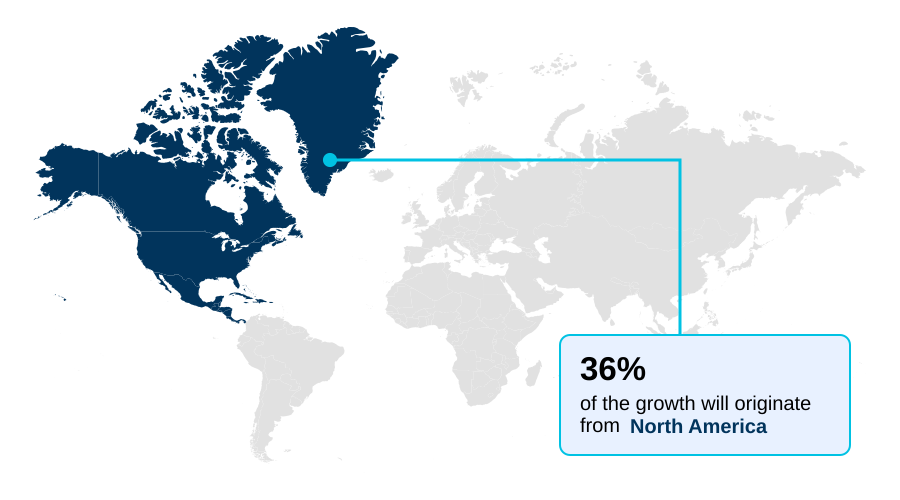
- North America dominated the market and accounted for a 36.1% growth during the forecast period.
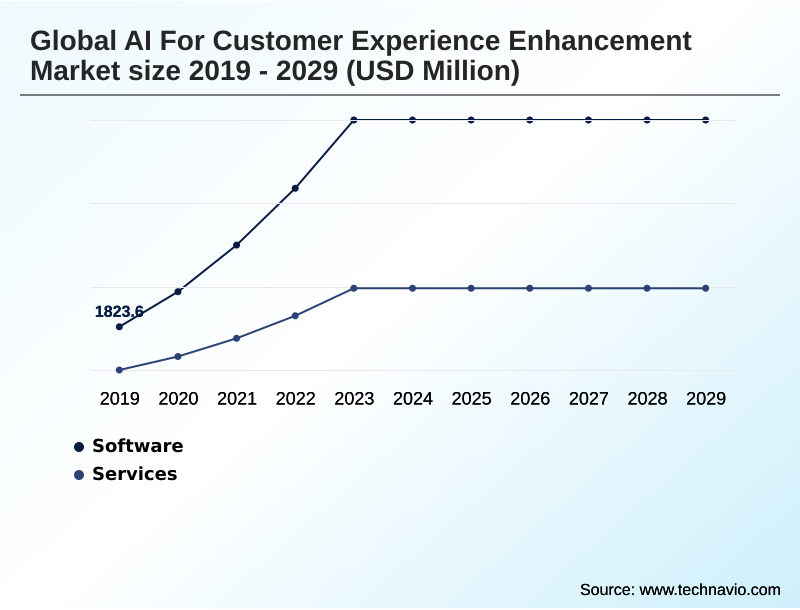
- By Component - Software segment was valued at USD 7.29 billion in 2023
- By Deployment - Cloud-based segment accounted for the largest market revenue share in 2023
Market Size & Forecast
- Market Opportunities: USD 41.19 billion
- Market Future Opportunities: USD 30.95 billion
- CAGR from 2024 to 2029 : 27.9%
Market Summary
- The AI for customer experience enhancement market is fundamentally reshaping how organizations interact with their constituencies. This evolution is driven by the strategic imperative to move beyond reactive support toward predictive and personalized engagement models.
- Core technologies such as large language models and predictive analytics engines are enabling businesses to process vast datasets, uncovering insights that inform every touchpoint of the customer journey. A key trend is the deployment of omnichannel experience orchestration, where AI serves as the central nervous system connecting disparate channels into a single, coherent conversation.
- For instance, in a retail setting, an AI-powered recommendation engine can analyze real-time browsing behavior on a mobile app and trigger a proactive service notification with a relevant offer, which is then accessible to an in-store associate via a CRM system integration.
- However, realizing this potential requires addressing significant hurdles related to data privacy controls and the ongoing need for effective human-in-the-loop oversight to mitigate risks like algorithmic bias. The market's trajectory is defined by this balance between technological capability and ethical implementation, making AI ethics and governance a central boardroom concern.
What will be the Size of the AI For Customer Experience Enhancement Market during the forecast period?
Get Key Insights on Market Forecast (PDF) Get Free Sample
How is the AI For Customer Experience Enhancement Market Segmented?
The ai for customer experience enhancement industry research report provides comprehensive data (region-wise segment analysis), with forecasts and estimates in "USD million" for the period 2025-2029, as well as historical data from 2019-2023 for the following segments.
- Component
- Software
- Services
- Deployment
- Cloud-based
- On-premises
- Application
- Customer support and chatbots
- Personalization engines
- Sentiment customer feedback
- Sales and marketing automation
- Others
- Geography
- North America
- US
- Canada
- Mexico
- Europe
- Germany
- UK
- France
- APAC
- China
- Japan
- India
- South America
- Brazil
- Argentina
- Colombia
- Middle East and Africa
- Saudi Arabia
- UAE
- South Africa
- Rest of World (ROW)
- North America
By Component Insights
The software segment is estimated to witness significant growth during the forecast period.
The software segment is the bedrock of the AI for customer experience market, providing the core technology platforms that drive engagement.
These systems encompass a range of tools from conversational AI platforms and hyper-personalization engines to sophisticated predictive analytics engines that anticipate customer needs.
The integration of generative AI models is transforming this space, moving beyond static scripts to enable dynamic, context-aware interactions. Effective deployments have demonstrated the capacity to handle over two-thirds of all initial customer service inquiries automatically.
This evolution is powered by capabilities like natural language understanding and real-time personalization, which are critical for creating seamless user experiences.
The focus is on scalable, turnkey solutions that deliver measurable improvements in customer satisfaction score and operational efficiency through intelligent triage system and secure AI deployment.
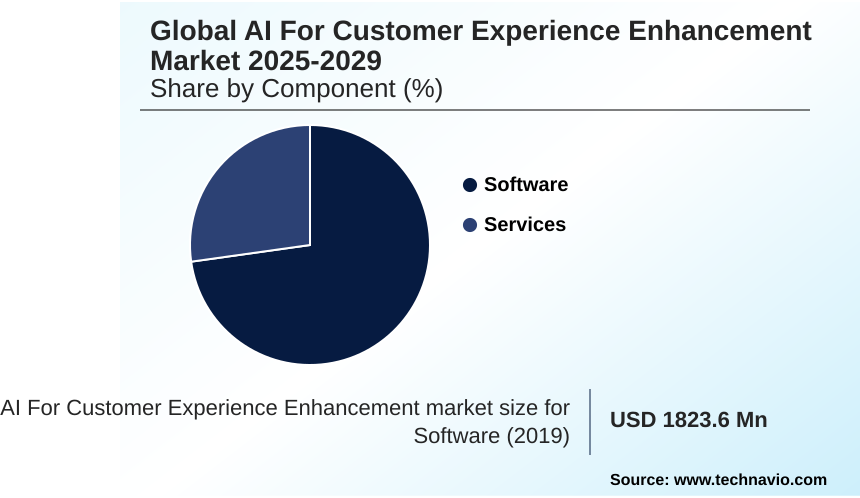
The Software segment was valued at USD 7.29 billion in 2023 and showed a gradual increase during the forecast period.
Regional Analysis
North America is estimated to contribute 36.1% to the growth of the global market during the forecast period.Technavio’s analysts have elaborately explained the regional trends and drivers that shape the market during the forecast period.
See How AI For Customer Experience Enhancement Market Demand is Rising in North America Get Free Sample
North America commands the largest share of the market, driven by high R&D investment and a mature consumer base, contributing an estimated 36.1% of the market’s total incremental growth.
This region's leadership is built on advanced real-time customer data platform adoption and a focus on customer lifetime value prediction.
In contrast, APAC is the fastest-growing region, characterized by a mobile-first population and the rise of super-apps that demand sophisticated AI-powered chatbots and churn prediction models.
Europe’s market is heavily shaped by stringent regulations, pushing demand for solutions with robust data privacy controls and capabilities for compliant data handling.
Emerging regions like South America and the Middle East and Africa are increasingly adopting AI for fraud detection and to scale customer service efficiently, often leapfrogging legacy systems with modern, low-code AI platforms.
Market Dynamics
Our researchers analyzed the data with 2024 as the base year, along with the key drivers, trends, and challenges. A holistic analysis of drivers will help companies refine their marketing strategies to gain a competitive advantage.
- Strategically, enterprises are shifting toward using generative AI for hyper-personalization, which is now a competitive necessity rather than a feature. The core of this transition involves implementing proactive and predictive customer engagement models, where AI as central orchestrator for omnichannel journeys ensures a seamless and context-aware experience across all touchpoints.
- However, this raises critical governance questions, compelling firms to focus on mitigating algorithmic bias in customer-facing AI and ensuring data privacy in AI personalization. The business case often hinges on calculating ROI for AI in customer service, where success is frequently tied to the effective integration of AI with legacy CRM systems.
- Companies that master this see double-digit improvements in agent productivity. The technical execution requires a clear cloud vs on-premises AI deployment strategy and expertise in fine-tuning LLMs for brand-specific conversations. Furthermore, AI-powered customer journey mapping and optimization is becoming standard for identifying friction points.
- Success is ultimately measured by using AI to improve first contact resolution and by developing ethical AI for customer interactions. This is supported by leveraging AI for real-time sentiment analysis and deploying AI-driven predictive analytics for churn reduction.
- Scaling customer support with virtual assistants, using personalization engines for e-commerce conversion, analyzing unstructured customer feedback, and automating agent workflows with AI tools are all crucial components of this comprehensive transformation.
What are the key market drivers leading to the rise in the adoption of AI For Customer Experience Enhancement Industry?
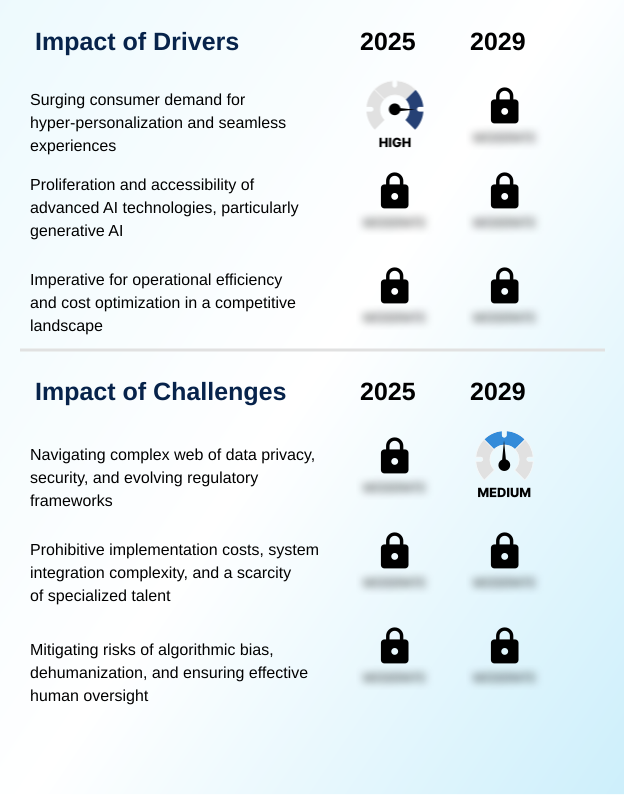
- Surging consumer demand for hyper-personalized and seamless experiences across all touchpoints serves as a primary driver for the market.
- The market's accelerating growth is fueled by a combination of customer expectations and technological accessibility. The foremost driver is the relentless consumer demand for hyper-personalization, compelling businesses to adopt AI model fine-tuning and customer segmentation analysis.
- Simultaneously, the democratization of advanced technologies, especially generative AI models, has lowered entry barriers. This has enabled even smaller enterprises to leverage personalized email generation and dynamic website content, with some platforms handling over two-thirds of all customer service chats.
- A third powerful driver is the unceasing pursuit of operational efficiency, where automated first contact resolution and customer sentiment tracking contribute to targeted cost reductions of over 15% in service operations.
- These drivers are supported by the wide availability of hybrid cloud AI strategy and ERP system integration solutions.
What are the market trends shaping the AI For Customer Experience Enhancement Industry?
- The ascendancy of hyper-personalization, fueled by generative AI, is emerging as a dominant market trend. This development signals a fundamental shift in how businesses create individualized customer interactions.
- Key market trends are converging to create more intelligent and autonomous customer experiences. The shift toward proactive and predictive customer engagement is paramount, where systems anticipate needs rather than merely reacting to inquiries. This is exemplified in platforms that analyze over 150 data points for predictive routing, optimizing agent-customer pairings to improve outcomes by up to 25%.
- Another dominant trend is the use of an AI-driven omnichannel experience orchestration, which breaks down data silos between channels; this can reduce agent data lookup times by over 40%. The ascendancy of hyper-personalization, powered by automated content generation and AI model monitoring, allows for the delivery of uniquely tailored interactions at scale.
- These trends are underpinned by the adoption of explainable AI models and the MLOps for customer experience, ensuring that complex systems are both effective and manageable.
What challenges does the AI For Customer Experience Enhancement Industry face during its growth?
- Navigating the complex web of data privacy, security concerns, and evolving regulatory frameworks presents a significant challenge to industry growth.
- Despite strong growth drivers, the market faces significant challenges that temper the pace of adoption. Navigating the complex regulatory landscape is a primary concern, with new landmark regulations categorizing systems by risk and demanding transparent algorithmic processes. This environment creates uncertainty and increases compliance costs, with some incidents leading to tribunals ordering companies to honor chatbot-provided information.
- A second major hurdle is the high cost and complexity of implementation, compounded by a scarcity of specialized talent, which contributes to project delays in up to 50% of new deployments. Finally, ethical risks, including algorithmic bias mitigation and the need for robust data governance policies, remain a critical challenge.
- Ensuring an effective human-in-the-loop oversight is essential to avoid creating a dehumanized experience and to maintain customer trust amidst increasing social media sentiment analysis.
Exclusive Technavio Analysis on Customer Landscape
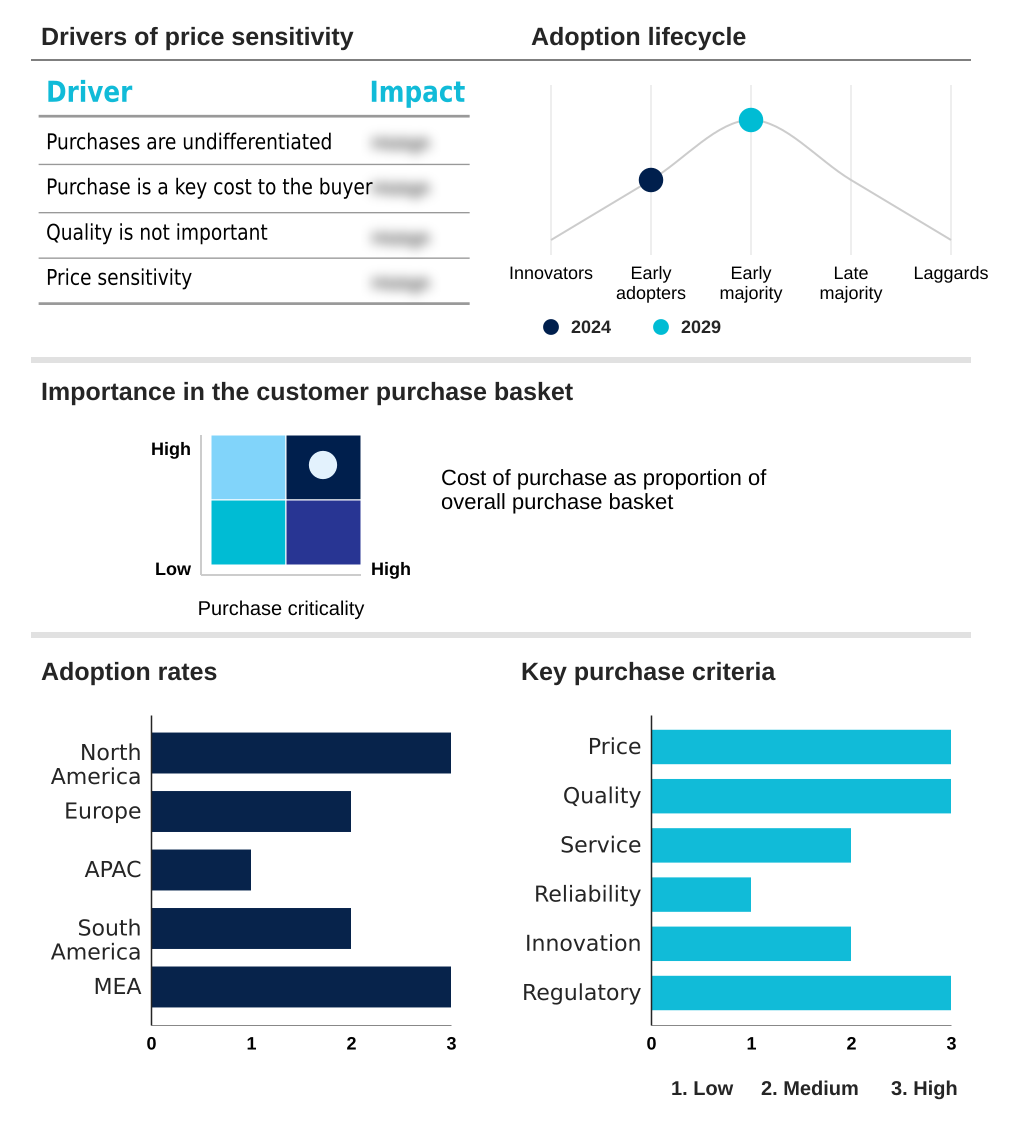
The ai for customer experience enhancement market forecasting report includes the adoption lifecycle of the market, covering from the innovator’s stage to the laggard’s stage. It focuses on adoption rates in different regions based on penetration. Furthermore, the ai for customer experience enhancement market report also includes key purchase criteria and drivers of price sensitivity to help companies evaluate and develop their market growth analysis strategies.
Customer Landscape of AI For Customer Experience Enhancement Industry
Competitive Landscape
Companies are implementing various strategies, such as strategic alliances, ai for customer experience enhancement market forecast, partnerships, mergers and acquisitions, geographical expansion, and product/service launches, to enhance their presence in the industry.
Adobe Inc. - Offers an AI and machine learning framework for personalization, predictive analytics, and content intelligence within a comprehensive experience cloud platform.
The industry research and growth report includes detailed analyses of the competitive landscape of the market and information about key companies, including:
- Adobe Inc.
- Amazon Web Services Inc.
- COVEO
- Freshworks Inc.
- Genesys Telecom Lab Inc.
- Google Cloud
- IBM Corp.
- Medallia Inc.
- Microsoft Corp.
- NICE Ltd.
- Oracle Corp.
- Pegasystems Inc.
- Qualtrics LLC
- Salesforce Inc.
- SAP SE
- SAS Institute Inc.
- ServiceNow Inc.
- Sprinklr Inc.
- Verint Systems Inc.
- Zendesk Inc.
Qualitative and quantitative analysis of companies has been conducted to help clients understand the wider business environment as well as the strengths and weaknesses of key industry players. Data is qualitatively analyzed to categorize companies as pure play, category-focused, industry-focused, and diversified; it is quantitatively analyzed to categorize companies as dominant, leading, strong, tentative, and weak.
Recent Development and News in Ai for customer experience enhancement market
- In September 2024, Banco Santander announced a significant investment in upgrading its AI capabilities, including its virtual assistant, to provide more human-like, conversational responses and personalized financial advice.
- In February 2025, Klarna reported that its generative AI-powered assistant was successfully managing two-thirds of all customer service chats, resolving issues with a customer satisfaction score on par with human agents.
- In April 2025, LVMH announced a strategic partnership to develop bespoke AI-driven clienteling solutions, empowering sales associates with deep customer insights to provide highly personalized in-store recommendations and service.
- In May 2025, Commonwealth Bank of Australia rolled out an enhanced AI-powered feature in its mobile app to help customers manage bills by predicting upcoming payments and providing a consolidated view of financial commitments.
Dive into Technavio’s robust research methodology, blending expert interviews, extensive data synthesis, and validated models for unparalleled AI For Customer Experience Enhancement Market insights. See full methodology.
| Market Scope | |
|---|---|
| Page number | 304 |
| Base year | 2024 |
| Historic period | 2019-2023 |
| Forecast period | 2025-2029 |
| Growth momentum & CAGR | Accelerate at a CAGR of 27.9% |
| Market growth 2025-2029 | USD 30945.8 million |
| Market structure | Fragmented |
| YoY growth 2024-2025(%) | 26.5% |
| Key countries | US, Canada, Mexico, Germany, UK, France, Italy, Spain, The Netherlands, China, Japan, India, South Korea, Australia, Indonesia, Brazil, Argentina, Colombia, Saudi Arabia, UAE, South Africa, Israel and Turkey |
| Competitive landscape | Leading Companies, Market Positioning of Companies, Competitive Strategies, and Industry Risks |
Research Analyst Overview
- The AI for customer experience enhancement market is defined by its rapid evolution from isolated tools to deeply integrated ecosystems. The strategic imperative is no longer just automation but achieving a holistic, predictive understanding of customer behavior through the use of conversational AI platforms and intelligent virtual assistants.
- A primary trend, the move towards hyper-personalization engines, is now a key boardroom consideration, directly influencing budgeting for a unified customer data platform and real-time customer data platform infrastructure to support customer journey analytics. Implementations of AI-powered chatbots have demonstrated the capacity to resolve over 65% of initial inquiries, a metric that validates investment in predictive analytics engines.
- This is achieved through technologies like natural language understanding, automated summarization, and deep knowledge base integration. The sophistication extends to sentiment analysis tools and emotion recognition technology, which, along with speech-to-text transcription and text-to-speech synthesis, create more human-like interactions.
- Governance remains paramount, with AI ethics and governance, data privacy controls, and algorithmic bias mitigation guiding the deployment of AI-driven routing and agent-assist tools. Success depends on human-in-the-loop oversight and continuous AI model fine-tuning to improve first contact resolution rate and customer satisfaction score.
- Innovations like voice biometrics for authentication and intelligent triage system are becoming critical for secure and efficient omnichannel experience orchestration, with a focus on predicting customer lifetime value and reducing churn.
What are the Key Data Covered in this AI For Customer Experience Enhancement Market Research and Growth Report?
-
What is the expected growth of the AI For Customer Experience Enhancement Market between 2025 and 2029?
-
USD 30.95 billion, at a CAGR of 27.9%
-
-
What segmentation does the market report cover?
-
The report is segmented by Component (Software, and Services), Deployment (Cloud-based, and On-premises), Application (Customer support and chatbots, Personalization engines, Sentiment customer feedback, Sales and marketing automation, and Others) and Geography (North America, Europe, APAC, South America, Middle East and Africa)
-
-
Which regions are analyzed in the report?
-
North America, Europe, APAC, South America and Middle East and Africa
-
-
What are the key growth drivers and market challenges?
-
Surging consumer demand for hyper-personalization and seamless experiences, Navigating complex web of data privacy, security, and evolving regulatory frameworks
-
-
Who are the major players in the AI For Customer Experience Enhancement Market?
-
Adobe Inc., Amazon Web Services Inc., COVEO, Freshworks Inc., Genesys Telecom Lab Inc., Google Cloud, IBM Corp., Medallia Inc., Microsoft Corp., NICE Ltd., Oracle Corp., Pegasystems Inc., Qualtrics LLC, Salesforce Inc., SAP SE, SAS Institute Inc., ServiceNow Inc., Sprinklr Inc., Verint Systems Inc. and Zendesk Inc.
-
Market Research Insights
- The market's momentum is defined by the strategic adoption of AI to achieve measurable business outcomes through enhanced customer engagement. The deployment of AI-powered recommendation engines and proactive service notifications is becoming standard practice, driven by the need for differentiation in competitive landscapes.
- Leading implementations demonstrate significant efficiency gains, with some AI assistants handling over 65% of customer service chats, maintaining satisfaction scores on par with human agents. The sophistication of these systems is growing, with platforms analyzing over 150 unique data points for predictive routing to optimize outcomes.
- This push is supported by the increasing accessibility of cloud-based AI services and API-driven AI architecture, allowing for more flexible CRM system integration. The focus on ethical AI frameworks ensures that as automation scales through sales process automation, it aligns with data governance policies and maintains customer trust.
We can help! Our analysts can customize this ai for customer experience enhancement market research report to meet your requirements.
 RIA -
RIA - 
