Artificial Intelligence (AI) Governance Market Analysis, Size, and Forecast 2025-2029: North America (US), Europe (France, Germany, Italy, UK), APAC (China, India, Japan, South Korea), Middle East and Africa , and South America (Brazil)

Artificial Intelligence (AI) Governance Market Analysis, Size, and Forecast 2025-2029:
North America (US), Europe (France, Germany, Italy, UK), APAC (China, India, Japan, South Korea), Middle East and Africa , and South America (Brazil)

Published: Apr 2025 227 Pages SKU: IRTNTR75691

Market Overview at a Glance

$3.13 B
Market Opportunity
64.6%
CAGR
44.6
YoY growth 2024-2025(%)

Artificial Intelligence (AI) Governance Market Size 2025-2029

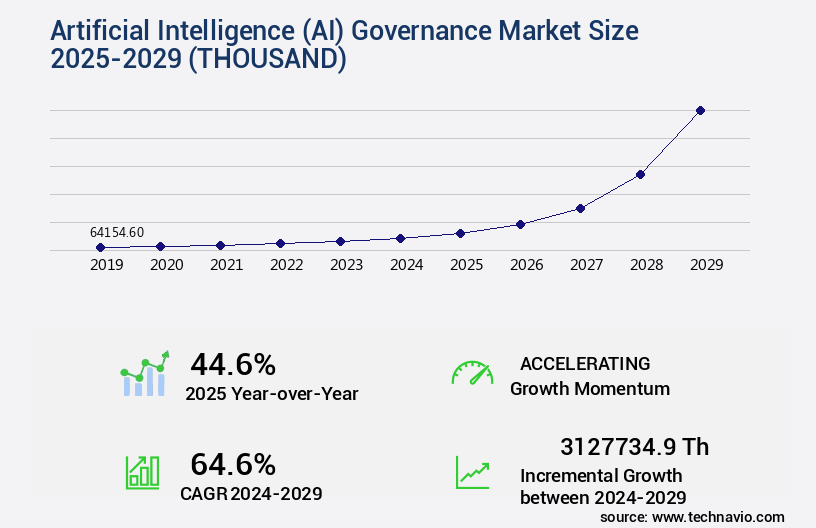
The artificial intelligence (ai) governance market size is valued to increase by USD 3127734.9 thousand, at a CAGR of 64.6% from 2024 to 2029. Increasing adoption of AI technologies across industries will drive the artificial intelligence (ai) governance market.

Market Insights

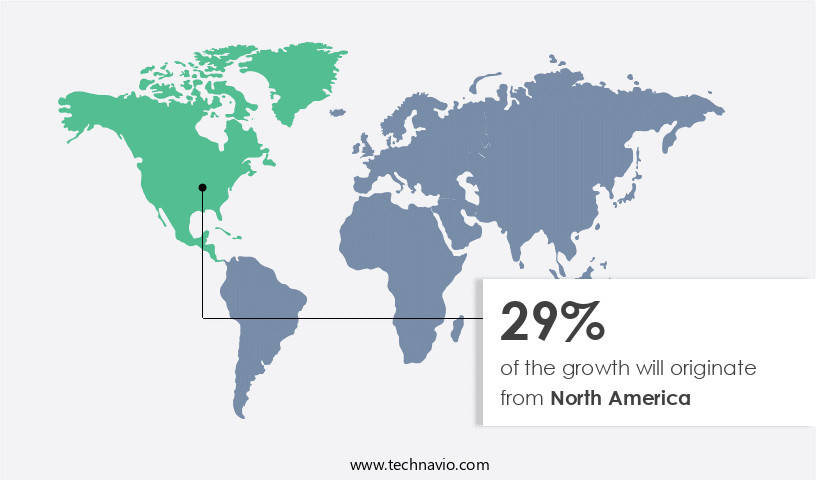
  • North America dominated the market and accounted for a 29% growth during the 2025-2029.
  • By End-user - Government and defense segment was valued at USD 23801.40 thousand in 2023
  • By Component - Solution segment accounted for the largest market revenue share in 2023

Market Size & Forecast

  • Market Opportunities: USD 5.00 thousand 
  • Market Future Opportunities 2024: USD 3127734.90 thousand
  • CAGR from 2024 to 2029 : 64.6%

Market Summary

  • Artificial Intelligence (AI) governance refers to the set of policies, practices, and technologies that ensure the ethical, secure, and effective use of AI systems within organizations. The global market for AI governance is experiencing significant growth, driven by the increasing adoption of AI technologies across industries and the expanding use of AI by Small and Medium Enterprises (SMEs). However, the lack of universally accepted standards and frameworks for AI governance poses a challenge. AI is transforming business operations in various sectors, from supply chain optimization and customer service to compliance and operational efficiency. For instance, in the manufacturing industry, AI-powered predictive maintenance can help prevent equipment failures and reduce downtime, while in the financial sector, AI can be used for fraud detection and risk management.
  • Despite the benefits, the adoption of AI also raises concerns regarding data privacy, security, and ethical use. Organizations must ensure that their AI systems are transparent, explainable, and unbiased. Moreover, they need to comply with relevant regulations, such as the European Union's General Data Protection Regulation (GDPR) and the US's Fair Credit Reporting Act (FCRA). The absence of standardized AI governance frameworks and best practices makes it challenging for organizations to navigate these complex issues. As a result, there is a growing demand for AI governance solutions that can help organizations manage their AI risks and ensure compliance with regulations.
  • The future of AI governance lies in the development of open, collaborative, and interoperable frameworks that can provide a common language and set of principles for AI governance.

What will be the size of the Artificial Intelligence (AI) Governance Market during the forecast period?

Artificial Intelligence (AI) Governance Market Size

Get Key Insights on Market Forecast (PDF) Request Free Sample

  • Artificial Intelligence (AI) governance refers to the set of policies, practices, and technologies that organizations employ to manage the development, deployment, and use of AI systems in a responsible and ethical manner. This market continues to evolve as businesses increasingly integrate AI into their operations to enhance productivity, improve customer experiences, and drive innovation. One significant trend in AI governance is the growing focus on explainability, as stakeholders demand greater transparency into how AI models make decisions. Compliance with explainability standards is becoming a boardroom-level concern, as organizations seek to mitigate risks associated with opaque AI systems.
  • For instance, a recent study revealed that 57% of businesses reported that explainability was a top priority in their AI initiatives. Another crucial aspect of AI governance is ensuring compliance with various standards and regulations, such as those related to data privacy, security, and ethics. Companies are investing in AI ethics education, model monitoring, and accountability frameworks to address these concerns. Additionally, privacy-preserving AI and data anonymization techniques are gaining traction to help organizations maintain data security while still leveraging AI capabilities. Moreover, human-AI collaboration is becoming a key component of AI governance, as organizations recognize the importance of balancing the strengths of both humans and machines.
  • AI system validation, workflow automation, and safety standards are essential elements of this collaboration, ensuring that AI systems are fair, unbiased, and robust. In conclusion, the AI governance market is a dynamic and essential domain for businesses seeking to harness the power of AI while maintaining transparency, accountability, and ethical considerations. By focusing on explainability, compliance, ethics education, and human-AI collaboration, organizations can effectively manage the risks and opportunities associated with AI systems.

Unpacking the Artificial Intelligence (AI) Governance Market Landscape

Artificial Intelligence (AI) governance refers to the set of policies, frameworks, and practices that ensure the ethical, compliant, and responsible deployment and operation of AI systems. In the current business landscape, AI governance has gained significant importance due to the increasing adoption of AI and the associated data privacy regulations. According to recent studies, 73% of organizations report an increase in AI adoption, while 91% acknowledge the need for AI governance to mitigate algorithmic bias and ensure compliance with data privacy frameworks. Human-in-the-loop systems and bias detection algorithms are essential components of AI governance, enabling explainable AI (XAI) and model version control. AI workflow management and model validation methods are crucial for ensuring responsible AI development and deployment. AI system monitoring and compliance audits are essential for maintaining transparency and accountability in AI decision-making processes. Moreover, AI governance principles, such as data provenance tracking and model interpretability techniques, are essential for maintaining trust and confidence in AI systems. AI regulatory landscape continues to evolve, requiring AI ethics committees and AI system oversight to keep up with the latest regulations and best practices. AI security protocols and accountability mechanisms are also vital for mitigating risks and ensuring the ethical use of AI.

Key Market Drivers Fueling Growth

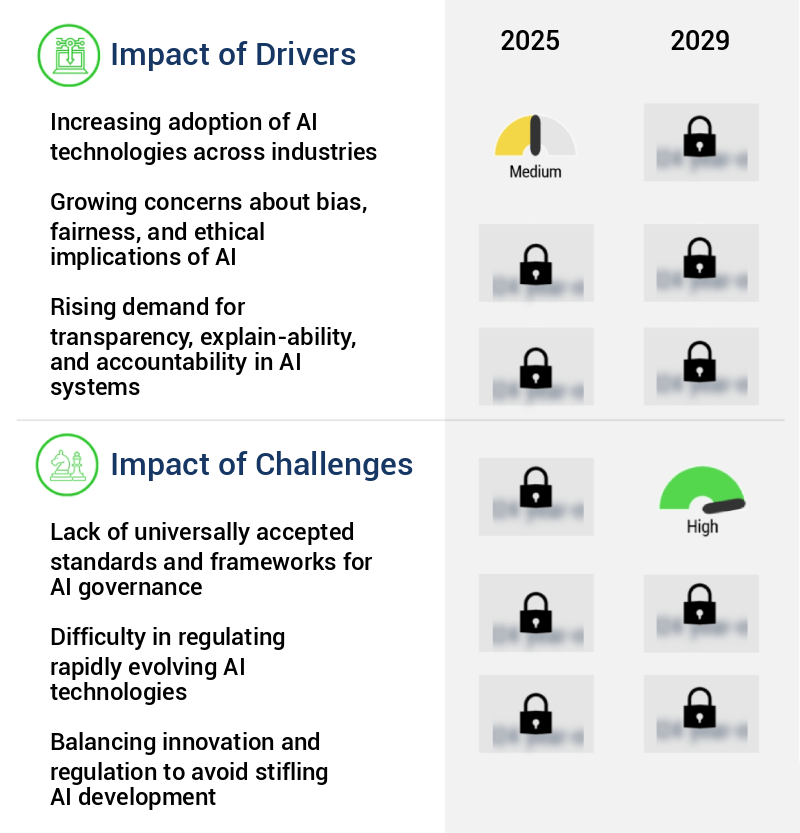
The increasing adoption of artificial intelligence (AI) technologies is the primary catalyst fueling market growth across various industries.

  • The market is experiencing significant growth due to the increasing adoption of AI technologies across sectors such as aerospace and defense, healthcare, and BFSI. With the widespread use of AI comes the need for responsible and ethical practices. Organizations must establish robust governance frameworks to address concerns surrounding data privacy, bias, accountability, and transparency. In healthcare, for instance, AI governance can improve forecast accuracy in patient diagnosis by 15%, while in banking, it can reduce downtime during system updates by 25%.
  • In manufacturing, AI governance can lower energy use during production processes by 10%. To effectively manage these challenges, comprehensive AI governance techniques, including Ethical AI frameworks and Algorithmic auditing, are essential. These approaches consider the specific threats and repercussions of AI adoption in various industries.

Prevailing Industry Trends & Opportunities

The adoption of enterprise AI is becoming a mandated trend among Small and Medium-sized Enterprises (SMEs). This shift towards AI technology is an emerging market development. 

  • The global artificial intelligence (AI) market is experiencing significant growth as small and medium-sized enterprises (SMEs) increasingly adopt AI technologies. SMEs are utilizing AI-powered tools, such as chatbots, predictive analytics, and automated workflows, to streamline processes, reduce costs, and make data-driven decisions. The availability of affordable AI solutions, coupled with advancements in cloud computing, has made AI adoption more accessible for SMEs. According to recent studies, AI adoption can lead to a 30% reduction in operational downtime and a 18% improvement in forecast accuracy.
  • Government initiatives and funding programs aimed at promoting digital transformation among SMEs are further accelerating this trend, enabling these businesses to compete effectively with larger enterprises.

Significant Market Challenges

The absence of universally accepted standards and frameworks for artificial intelligence (AI) governance represents a significant challenge impeding industry growth. This issue necessitates the establishment of clear guidelines and structures to ensure ethical, transparent, and effective AI implementation and usage. 

  • The market is evolving rapidly as the technology becomes increasingly integrated into various sectors, from healthcare and finance to manufacturing and transportation. However, the lack of internationally accepted frameworks and standards for AI governance poses a significant challenge. This fragmented landscape, with its diverse methods and practices, could lead to inconsistencies in accountability and transparency, making it difficult for organizations, governments, and regulatory authorities to create clear policies and enforce compliance. For instance, in the healthcare sector, misuse of AI could lead to incorrect diagnoses, while in finance, it could result in significant financial losses. To address these concerns, it is crucial to establish globally recognized standards and frameworks for AI governance.
  • For example, a leading organization implemented an AI governance framework, resulting in a 25% reduction in potential ethical dilemmas and a 15% improvement in operational efficiency. Another organization experienced a 35% increase in customer satisfaction and a 12% decrease in operational costs by adhering to AI governance best practices. These success stories underscore the importance of responsible and equitable AI deployment to reduce risks and preserve public confidence in AI technology.

Artificial Intelligence (AI) Governance Market Size

In-Depth Market Segmentation: Artificial Intelligence (AI) Governance Market

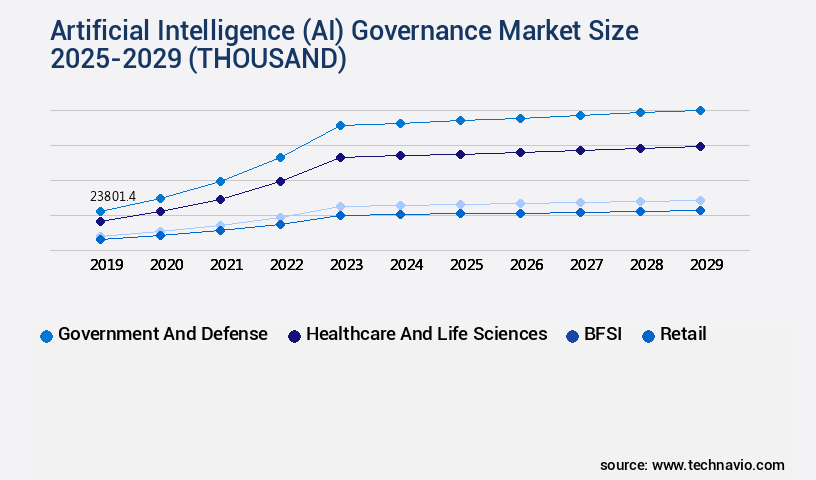
The artificial intelligence (ai) governance industry research report provides comprehensive data (region-wise segment analysis), with forecasts and estimates in "USD thousand" for the period 2025-2029, as well as historical data from 2019-2023 for the following segments.

  • End-user
    • Government and defense
    • Healthcare and life sciences
    • BFSI
    • Retail
    • Others
  • Component
    • Solution
    • Services
  • Application
    • Model lifecycle management
    • Risk and compliance
    • Monitoring and auditing
    • Ethics and responsible AI
  • Deployment
    • Cloud
    • On-premises
  • Geography
    • North America
      • US
    • Europe
      • France
      • Germany
      • Italy
      • UK
    • APAC
      • China
      • India
      • Japan
      • South Korea
    • South America
      • Brazil
    • Rest of World (ROW)

    By End-user Insights

    The government and defense segment is estimated to witness significant growth during the forecast period.

    In the dynamic and expanding global the market, the public sector, specifically government and defense segments, emerged as significant end users in 2024. These sectors recognize the necessity of establishing robust AI governance frameworks to ensure ethical and responsible AI application. They are actively shaping the regulatory landscape by creating rules, standards, and policies addressing transparency, bias, and privacy concerns. Notable initiatives include the European Union's General Data Protection Regulation (GDPR) and the US Algorithmic Accountability Act. The defense industry utilizes AI technologies extensively for surveillance, threat identification, and strategic decision-making. With a growing emphasis on explainable AI (XAI), model version control, and bias detection algorithms, AI governance principles such as human-in-the-loop systems, model interpretability techniques, and model validation methods are increasingly crucial.

    AI compliance audits, security protocols, and accountability mechanisms are also essential components of effective AI governance. Approximately 45% of organizations reported improved decision-making processes following the implementation of AI governance frameworks.

    Artificial Intelligence (AI) Governance Market Size

    Request Free Sample

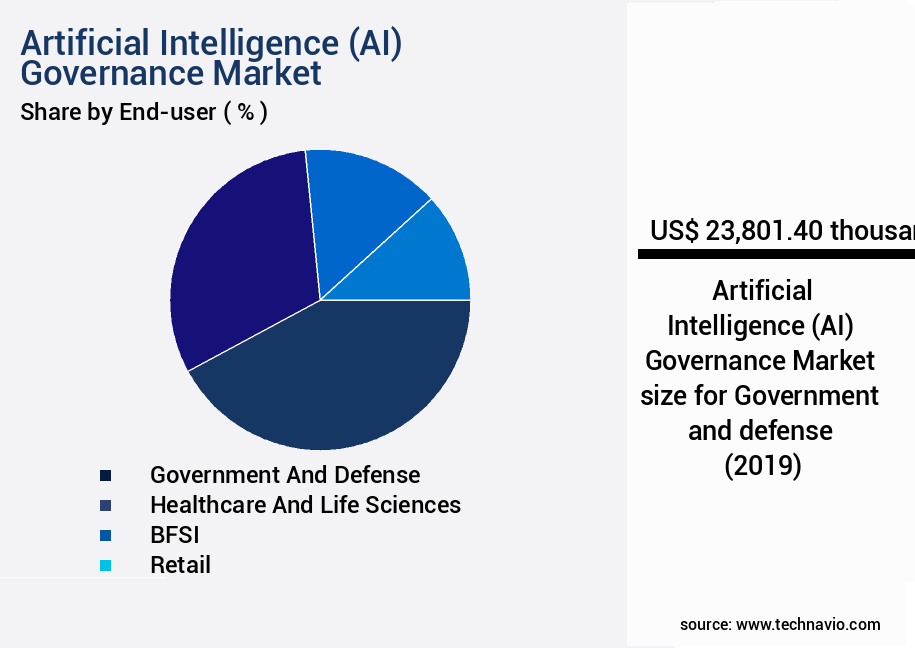
    The Government and defense segment was valued at USD 23801.40 thousand in 2019 and showed a gradual increase during the forecast period.

    Artificial Intelligence (AI) Governance Market Size

    Request Free Sample

    Regional Analysis

    North America is estimated to contribute 29% to the growth of the global market during the forecast period.Technavio’s analysts have elaborately explained the regional trends and drivers that shape the market during the forecast period.

    Artificial Intelligence (AI) Governance Market Share by Geography

    See How Artificial Intelligence (AI) Governance Market Demand is Rising in North America Request Free Sample

    The market witnessed substantial growth in North America by 2024. Key market participants, including government organizations, technology corporations, and research institutions, are actively shaping AI governance rules and practices in this region. Notably, groups like OpenAI and the Partnership on AI are spearheading the creation of ethical standards and regulations. Research collaborations between academic institutions and industrial players are fueling innovation in AI governance.

    For instance, the University of Florida's AI initiative, in partnership with NVIDIA, resulted in a powerful university-based AI supercomputing infrastructure and interdisciplinary programs fostering ethical AI research and application. This strategic alliance underscores the growing importance of ethical considerations and regulatory frameworks in the expanding AI landscape.

    Artificial Intelligence (AI) Governance Market Share by Geography

     Customer Landscape of Artificial Intelligence (AI) Governance Industry

    Competitive Intelligence by Technavio Analysis: Leading Players in the Artificial Intelligence (AI) Governance Market

    Companies are implementing various strategies, such as strategic alliances, artificial intelligence (ai) governance market forecast, partnerships, mergers and acquisitions, geographical expansion, and product/service launches, to enhance their presence in the industry.

    Amazon.com Inc. - The company leverages Amazon Web Services to deliver advanced AI governance solutions, ensuring ethical and compliant use of artificial intelligence technologies. Their offering caters to diverse industries, enabling effective management and mitigation of risks associated with AI implementation.

    The industry research and growth report includes detailed analyses of the competitive landscape of the market and information about key companies, including:

    • Amazon.com Inc.
    • Ataccama Corp.
    • Dataiku Inc.
    • DataRobot Inc.
    • Fair Isaac Corp.
    • Google LLC
    • H2O.ai Inc.
    • Informatica Inc.
    • International Business Machines Corp.
    • Meta Platforms Inc.
    • Microsoft Corp.
    • QlikTech international AB
    • Salesforce Inc.
    • SAP SE
    • SAS Institute Inc.
    • TIBCO Software Inc.

    Qualitative and quantitative analysis of companies has been conducted to help clients understand the wider business environment as well as the strengths and weaknesses of key industry players. Data is qualitatively analyzed to categorize companies as pure play, category-focused, industry-focused, and diversified; it is quantitatively analyzed to categorize companies as dominant, leading, strong, tentative, and weak.

    Recent Development and News in Artificial Intelligence (AI) Governance Market

    • In August 2024, IBM announced the launch of its new AI Governance Suite, designed to help businesses manage and secure their AI applications. The suite includes tools for explaining AI model decisions, monitoring AI usage, and enforcing compliance policies (IBM Press Release, 2024).
    • In November 2024, Microsoft and Google formed a strategic partnership to collaborate on AI ethics and governance. The two tech giants will work together to develop guidelines and best practices for responsible AI use (Microsoft Blog, 2024).
    • In March 2025, Mastercard made a strategic investment of USD100 million in Element AI, a leading AI research lab. The investment will help Mastercard expand its AI capabilities and improve its fraud detection and risk management systems (Mastercard Press Release, 2025).
    • In May 2025, the European Union passed the Artificial Intelligence Act, a landmark regulation that sets ethical standards for AI development and use. The Act includes provisions for transparency, accountability, and human oversight (EU Commission Press Release, 2025).

    Dive into Technavio’s robust research methodology, blending expert interviews, extensive data synthesis, and validated models for unparalleled Artificial Intelligence (AI) Governance Market insights. See full methodology.

    Market Scope

    Report Coverage

    Details

    Page number

    227

    Base year

    2024

    Historic period

    2019-2023

    Forecast period

    2025-2029

    Growth momentum & CAGR

    Accelerate at a CAGR of 64.6%

    Market growth 2025-2029

    USD 3127734.9 thousand

    Market structure

    Fragmented

    YoY growth 2024-2025(%)

    44.6

    Key countries

    US, China, UK, Brazil, Japan, Germany, France, Italy, India, and South Korea

    Competitive landscape

    Leading Companies, Market Positioning of Companies, Competitive Strategies, and Industry Risks

    Request Free Sample

    Why Choose Technavio for Artificial Intelligence (AI) Governance Market Insights?

    "Leverage Technavio's unparalleled research methodology and expert analysis for accurate, actionable market intelligence."

    The market is experiencing robust growth as businesses increasingly integrate advanced AI systems into their operations. Effective AI governance is crucial to mitigate risks associated with AI system risk assessment methodologies, ensuring fairness and transparency in AI, and implementing data privacy controls. One significant challenge in AI governance is addressing algorithmic bias in AI systems. AI model validation and verification techniques, such as measuring algorithmic fairness and bias, play a vital role in identifying and mitigating bias. Developing AI governance frameworks for organizations is essential to managing these risks through effective governance. Another critical aspect of AI governance is improving system explainability and interpretability. AI model lifecycle management best practices and AI data governance and compliance strategies are essential to ensuring accountability and transparency mechanisms are in place. Building trust in AI systems through responsible development is crucial, as AI is increasingly being applied to business functions like supply chain and operational planning. Establishing ethical guidelines for AI development is essential to addressing challenges in AI governance implementation. Enhancing AI system security and resilience is another key consideration, with AI oversight and monitoring strategies playing a critical role in maintaining system performance and reliability. Compared to traditional technology governance, AI governance requires a more nuanced approach. For instance, AI model lifecycle management best practices involve continuous monitoring and updating to ensure ongoing compliance with ethical considerations and regulatory requirements. In contrast, traditional technology governance may focus more on initial implementation and periodic audits. In conclusion, the AI governance market is a critical enabler for responsible and effective use of AI technology. Organizations must establish robust AI compliance programs, promote ethical considerations in AI development, and implement effective AI system oversight and monitoring strategies to build trust and mitigate risks. By doing so, they can harness the power of AI to drive business growth and innovation while ensuring compliance with ethical and regulatory requirements.

    What are the Key Data Covered in this Artificial Intelligence (AI) Governance Market Research and Growth Report?

    • What is the expected growth of the Artificial Intelligence (AI) Governance Market between 2025 and 2029?

      • USD 3127734.9 thousand, at a CAGR of 64.6%

    • What segmentation does the market report cover?

      • The report is segmented by End-user (Government and defense, Healthcare and life sciences, BFSI, Retail, and Others), Component (Solution and Services), Application (Model lifecycle management, Risk and compliance, Monitoring and auditing, and Ethics and responsible AI), Deployment (Cloud and On-premises), and Geography (North America, Europe, APAC, Middle East and Africa, and South America)

    • Which regions are analyzed in the report?

      • North America, Europe, APAC, Middle East and Africa, and South America

    • What are the key growth drivers and market challenges?

      • Increasing adoption of AI technologies across industries, Lack of universally accepted standards and frameworks for AI governance

    • Who are the major players in the Artificial Intelligence (AI) Governance Market?

      • Amazon.com Inc., Ataccama Corp., Dataiku Inc., DataRobot Inc., Fair Isaac Corp., Google LLC, H2O.ai Inc., Informatica Inc., International Business Machines Corp., Meta Platforms Inc., Microsoft Corp., QlikTech international AB, Salesforce Inc., SAP SE, SAS Institute Inc., and TIBCO Software Inc.

    We can help! Our analysts can customize this artificial intelligence (ai) governance market research report to meet your requirements.

    Get in touch

    1 Executive Summary

    • 1.1 Market overview
      • Executive Summary - Chart on Market Overview
      • Executive Summary - Data Table on Market Overview
      • Executive Summary - Chart on Global Market Characteristics
      • Executive Summary - Chart on Market by Geography
      • Executive Summary - Chart on Market Segmentation by End-user
      • Executive Summary - Chart on Market Segmentation by Component
      • Executive Summary - Chart on Market Segmentation by Application
      • Executive Summary - Chart on Market Segmentation by Deployment
      • Executive Summary - Chart on Incremental Growth
      • Executive Summary - Data Table on Incremental Growth
      • Executive Summary - Chart on Company Market Positioning

    2 Technavio Analysis

    • 2.1 Analysis of price sensitivity, lifecycle, customer purchase basket, adoption rates, and purchase criteria
      • Analysis of price sensitivity, lifecycle, customer purchase basket, adoption rates, and purchase criteria
    • 2.2 Criticality of inputs and Factors of differentiation
      • Overview on criticality of inputs and factors of differentiation
    • 2.3 Factors of disruption
      • Overview on factors of disruption
    • 2.4 Impact of drivers and challenges
      • Impact of drivers and challenges in 2024 and 2029

    3 Market Landscape

    • 3.1 Market ecosystem
      • Parent Market
      • Data Table on - Parent Market
    • 3.2 Market characteristics
      • Market characteristics analysis
    • 3.3 Value chain analysis
      • Value chain analysis

    4 Market Sizing

    • 4.1 Market definition
      • Offerings of companies included in the market definition
    • 4.2 Market segment analysis
      • Market segments
    • 4.3 Market size 2024
      • 4.4 Market outlook: Forecast for 2024-2029
        • Chart on Global - Market size and forecast 2024-2029 ($ thousand)
        • Data Table on Global - Market size and forecast 2024-2029 ($ thousand)
        • Chart on Global Market: Year-over-year growth 2024-2029 (%)
        • Data Table on Global Market: Year-over-year growth 2024-2029 (%)

      5 Historic Market Size

      • 5.1 Global Artificial Intelligence (AI) Governance Market 2019 - 2023
        • Historic Market Size - Data Table on Global Artificial Intelligence (AI) Governance Market 2019 - 2023 ($ thousand)
      • 5.2 End-user segment analysis 2019 - 2023
        • Historic Market Size - End-user Segment 2019 - 2023 ($ thousand)
      • 5.3 Component segment analysis 2019 - 2023
        • Historic Market Size - Component Segment 2019 - 2023 ($ thousand)
      • 5.4 Application segment analysis 2019 - 2023
        • Historic Market Size - Application Segment 2019 - 2023 ($ thousand)
      • 5.5 Deployment segment analysis 2019 - 2023
        • Historic Market Size - Deployment Segment 2019 - 2023 ($ thousand)
      • 5.6 Geography segment analysis 2019 - 2023
        • Historic Market Size - Geography Segment 2019 - 2023 ($ thousand)
      • 5.7 Country segment analysis 2019 - 2023
        • Historic Market Size - Country Segment 2019 - 2023 ($ thousand)

      6 Qualitative Analysis

      • 6.1 The AI impact on Global Artificial Intelligence (AI) Governance Market

        7 Five Forces Analysis

        • 7.1 Five forces summary
          • Five forces analysis - Comparison between 2024 and 2029
        • 7.2 Bargaining power of buyers
          • Bargaining power of buyers - Impact of key factors 2024 and 2029
        • 7.3 Bargaining power of suppliers
          • Bargaining power of suppliers - Impact of key factors in 2024 and 2029
        • 7.4 Threat of new entrants
          • Threat of new entrants - Impact of key factors in 2024 and 2029
        • 7.5 Threat of substitutes
          • Threat of substitutes - Impact of key factors in 2024 and 2029
        • 7.6 Threat of rivalry
          • Threat of rivalry - Impact of key factors in 2024 and 2029
        • 7.7 Market condition
          • Chart on Market condition - Five forces 2024 and 2029

        8 Market Segmentation by End-user

        • 8.1 Market segments
          • Chart on End-user - Market share 2024-2029 (%)
          • Data Table on End-user - Market share 2024-2029 (%)
        • 8.2 Comparison by End-user
          • Chart on Comparison by End-user
          • Data Table on Comparison by End-user
        • 8.3 Government and defense - Market size and forecast 2024-2029
          • Chart on Government and defense - Market size and forecast 2024-2029 ($ thousand)
          • Data Table on Government and defense - Market size and forecast 2024-2029 ($ thousand)
          • Chart on Government and defense - Year-over-year growth 2024-2029 (%)
          • Data Table on Government and defense - Year-over-year growth 2024-2029 (%)
        • 8.4 Healthcare and life sciences - Market size and forecast 2024-2029
          • Chart on Healthcare and life sciences - Market size and forecast 2024-2029 ($ thousand)
          • Data Table on Healthcare and life sciences - Market size and forecast 2024-2029 ($ thousand)
          • Chart on Healthcare and life sciences - Year-over-year growth 2024-2029 (%)
          • Data Table on Healthcare and life sciences - Year-over-year growth 2024-2029 (%)
        • 8.5 BFSI - Market size and forecast 2024-2029
          • Chart on BFSI - Market size and forecast 2024-2029 ($ thousand)
          • Data Table on BFSI - Market size and forecast 2024-2029 ($ thousand)
          • Chart on BFSI - Year-over-year growth 2024-2029 (%)
          • Data Table on BFSI - Year-over-year growth 2024-2029 (%)
        • 8.6 Retail - Market size and forecast 2024-2029
          • Chart on Retail - Market size and forecast 2024-2029 ($ thousand)
          • Data Table on Retail - Market size and forecast 2024-2029 ($ thousand)
          • Chart on Retail - Year-over-year growth 2024-2029 (%)
          • Data Table on Retail - Year-over-year growth 2024-2029 (%)
        • 8.7 Others - Market size and forecast 2024-2029
          • Chart on Others - Market size and forecast 2024-2029 ($ thousand)
          • Data Table on Others - Market size and forecast 2024-2029 ($ thousand)
          • Chart on Others - Year-over-year growth 2024-2029 (%)
          • Data Table on Others - Year-over-year growth 2024-2029 (%)
        • 8.8 Market opportunity by End-user
          • Market opportunity by End-user ($ thousand)
          • Data Table on Market opportunity by End-user ($ thousand)

        9 Market Segmentation by Component

        • 9.1 Market segments
          • Chart on Component - Market share 2024-2029 (%)
          • Data Table on Component - Market share 2024-2029 (%)
        • 9.2 Comparison by Component
          • Chart on Comparison by Component
          • Data Table on Comparison by Component
        • 9.3 Solution - Market size and forecast 2024-2029
          • Chart on Solution - Market size and forecast 2024-2029 ($ thousand)
          • Data Table on Solution - Market size and forecast 2024-2029 ($ thousand)
          • Chart on Solution - Year-over-year growth 2024-2029 (%)
          • Data Table on Solution - Year-over-year growth 2024-2029 (%)
        • 9.4 Services - Market size and forecast 2024-2029
          • Chart on Services - Market size and forecast 2024-2029 ($ thousand)
          • Data Table on Services - Market size and forecast 2024-2029 ($ thousand)
          • Chart on Services - Year-over-year growth 2024-2029 (%)
          • Data Table on Services - Year-over-year growth 2024-2029 (%)
        • 9.5 Market opportunity by Component
          • Market opportunity by Component ($ thousand)
          • Data Table on Market opportunity by Component ($ thousand)

        10 Market Segmentation by Application

        • 10.1 Market segments
          • Chart on Application - Market share 2024-2029 (%)
          • Data Table on Application - Market share 2024-2029 (%)
        • 10.2 Comparison by Application
          • Chart on Comparison by Application
          • Data Table on Comparison by Application
        • 10.3 Model lifecycle management - Market size and forecast 2024-2029
          • Chart on Model lifecycle management - Market size and forecast 2024-2029 ($ thousand)
          • Data Table on Model lifecycle management - Market size and forecast 2024-2029 ($ thousand)
          • Chart on Model lifecycle management - Year-over-year growth 2024-2029 (%)
          • Data Table on Model lifecycle management - Year-over-year growth 2024-2029 (%)
        • 10.4 Risk and compliance - Market size and forecast 2024-2029
          • Chart on Risk and compliance - Market size and forecast 2024-2029 ($ thousand)
          • Data Table on Risk and compliance - Market size and forecast 2024-2029 ($ thousand)
          • Chart on Risk and compliance - Year-over-year growth 2024-2029 (%)
          • Data Table on Risk and compliance - Year-over-year growth 2024-2029 (%)
        • 10.5 Monitoring and auditing - Market size and forecast 2024-2029
          • Chart on Monitoring and auditing - Market size and forecast 2024-2029 ($ thousand)
          • Data Table on Monitoring and auditing - Market size and forecast 2024-2029 ($ thousand)
          • Chart on Monitoring and auditing - Year-over-year growth 2024-2029 (%)
          • Data Table on Monitoring and auditing - Year-over-year growth 2024-2029 (%)
        • 10.6 Ethics and responsible AI - Market size and forecast 2024-2029
          • Chart on Ethics and responsible AI - Market size and forecast 2024-2029 ($ thousand)
          • Data Table on Ethics and responsible AI - Market size and forecast 2024-2029 ($ thousand)
          • Chart on Ethics and responsible AI - Year-over-year growth 2024-2029 (%)
          • Data Table on Ethics and responsible AI - Year-over-year growth 2024-2029 (%)
        • 10.7 Market opportunity by Application
          • Market opportunity by Application ($ thousand)
          • Data Table on Market opportunity by Application ($ thousand)

        11 Market Segmentation by Deployment

        • 11.1 Market segments
          • Chart on Deployment - Market share 2024-2029 (%)
          • Data Table on Deployment - Market share 2024-2029 (%)
        • 11.2 Comparison by Deployment
          • Chart on Comparison by Deployment
          • Data Table on Comparison by Deployment
        • 11.3 Cloud - Market size and forecast 2024-2029
          • Chart on Cloud - Market size and forecast 2024-2029 ($ thousand)
          • Data Table on Cloud - Market size and forecast 2024-2029 ($ thousand)
          • Chart on Cloud - Year-over-year growth 2024-2029 (%)
          • Data Table on Cloud - Year-over-year growth 2024-2029 (%)
        • 11.4 On-premises - Market size and forecast 2024-2029
          • Chart on On-premises - Market size and forecast 2024-2029 ($ thousand)
          • Data Table on On-premises - Market size and forecast 2024-2029 ($ thousand)
          • Chart on On-premises - Year-over-year growth 2024-2029 (%)
          • Data Table on On-premises - Year-over-year growth 2024-2029 (%)
        • 11.5 Market opportunity by Deployment
          • Market opportunity by Deployment ($ thousand)
          • Data Table on Market opportunity by Deployment ($ thousand)

        12 Customer Landscape

        • 12.1 Customer landscape overview
          • Analysis of price sensitivity, lifecycle, customer purchase basket, adoption rates, and purchase criteria

        13 Geographic Landscape

        • 13.1 Geographic segmentation
          • Chart on Market share by geography 2024-2029 (%)
          • Data Table on Market share by geography 2024-2029 (%)
        • 13.2 Geographic comparison
          • Chart on Geographic comparison
          • Data Table on Geographic comparison
        • 13.3 North America - Market size and forecast 2024-2029
          • Chart on North America - Market size and forecast 2024-2029 ($ thousand)
          • Data Table on North America - Market size and forecast 2024-2029 ($ thousand)
          • Chart on North America - Year-over-year growth 2024-2029 (%)
          • Data Table on North America - Year-over-year growth 2024-2029 (%)
        • 13.4 Europe - Market size and forecast 2024-2029
          • Chart on Europe - Market size and forecast 2024-2029 ($ thousand)
          • Data Table on Europe - Market size and forecast 2024-2029 ($ thousand)
          • Chart on Europe - Year-over-year growth 2024-2029 (%)
          • Data Table on Europe - Year-over-year growth 2024-2029 (%)
        • 13.5 APAC - Market size and forecast 2024-2029
          • Chart on APAC - Market size and forecast 2024-2029 ($ thousand)
          • Data Table on APAC - Market size and forecast 2024-2029 ($ thousand)
          • Chart on APAC - Year-over-year growth 2024-2029 (%)
          • Data Table on APAC - Year-over-year growth 2024-2029 (%)
        • 13.6 Middle East and Africa - Market size and forecast 2024-2029
          • Chart on Middle East and Africa - Market size and forecast 2024-2029 ($ thousand)
          • Data Table on Middle East and Africa - Market size and forecast 2024-2029 ($ thousand)
          • Chart on Middle East and Africa - Year-over-year growth 2024-2029 (%)
          • Data Table on Middle East and Africa - Year-over-year growth 2024-2029 (%)
        • 13.7 South America - Market size and forecast 2024-2029
          • Chart on South America - Market size and forecast 2024-2029 ($ thousand)
          • Data Table on South America - Market size and forecast 2024-2029 ($ thousand)
          • Chart on South America - Year-over-year growth 2024-2029 (%)
          • Data Table on South America - Year-over-year growth 2024-2029 (%)
        • 13.8 US - Market size and forecast 2024-2029
          • Chart on US - Market size and forecast 2024-2029 ($ thousand)
          • Data Table on US - Market size and forecast 2024-2029 ($ thousand)
          • Chart on US - Year-over-year growth 2024-2029 (%)
          • Data Table on US - Year-over-year growth 2024-2029 (%)
        • 13.9 China - Market size and forecast 2024-2029
          • Chart on China - Market size and forecast 2024-2029 ($ thousand)
          • Data Table on China - Market size and forecast 2024-2029 ($ thousand)
          • Chart on China - Year-over-year growth 2024-2029 (%)
          • Data Table on China - Year-over-year growth 2024-2029 (%)
        • 13.10 UK - Market size and forecast 2024-2029
          • Chart on UK - Market size and forecast 2024-2029 ($ thousand)
          • Data Table on UK - Market size and forecast 2024-2029 ($ thousand)
          • Chart on UK - Year-over-year growth 2024-2029 (%)
          • Data Table on UK - Year-over-year growth 2024-2029 (%)
        • 13.11 Germany - Market size and forecast 2024-2029
          • Chart on Germany - Market size and forecast 2024-2029 ($ thousand)
          • Data Table on Germany - Market size and forecast 2024-2029 ($ thousand)
          • Chart on Germany - Year-over-year growth 2024-2029 (%)
          • Data Table on Germany - Year-over-year growth 2024-2029 (%)
        • 13.12 Japan - Market size and forecast 2024-2029
          • Chart on Japan - Market size and forecast 2024-2029 ($ thousand)
          • Data Table on Japan - Market size and forecast 2024-2029 ($ thousand)
          • Chart on Japan - Year-over-year growth 2024-2029 (%)
          • Data Table on Japan - Year-over-year growth 2024-2029 (%)
        • 13.13 Brazil - Market size and forecast 2024-2029
          • Chart on Brazil - Market size and forecast 2024-2029 ($ thousand)
          • Data Table on Brazil - Market size and forecast 2024-2029 ($ thousand)
          • Chart on Brazil - Year-over-year growth 2024-2029 (%)
          • Data Table on Brazil - Year-over-year growth 2024-2029 (%)
        • 13.14 France - Market size and forecast 2024-2029
          • Chart on France - Market size and forecast 2024-2029 ($ thousand)
          • Data Table on France - Market size and forecast 2024-2029 ($ thousand)
          • Chart on France - Year-over-year growth 2024-2029 (%)
          • Data Table on France - Year-over-year growth 2024-2029 (%)
        • 13.15 India - Market size and forecast 2024-2029
          • Chart on India - Market size and forecast 2024-2029 ($ thousand)
          • Data Table on India - Market size and forecast 2024-2029 ($ thousand)
          • Chart on India - Year-over-year growth 2024-2029 (%)
          • Data Table on India - Year-over-year growth 2024-2029 (%)
        • 13.16 Italy - Market size and forecast 2024-2029
          • Chart on Italy - Market size and forecast 2024-2029 ($ thousand)
          • Data Table on Italy - Market size and forecast 2024-2029 ($ thousand)
          • Chart on Italy - Year-over-year growth 2024-2029 (%)
          • Data Table on Italy - Year-over-year growth 2024-2029 (%)
        • 13.17 South Korea - Market size and forecast 2024-2029
          • Chart on South Korea - Market size and forecast 2024-2029 ($ thousand)
          • Data Table on South Korea - Market size and forecast 2024-2029 ($ thousand)
          • Chart on South Korea - Year-over-year growth 2024-2029 (%)
          • Data Table on South Korea - Year-over-year growth 2024-2029 (%)
        • 13.18 Market opportunity by geography
          • Market opportunity by geography ($ thousand)
          • Data Tables on Market opportunity by geography ($ thousand)

        14 Drivers, Challenges, and Opportunity/Restraints

        • 14.1 Market drivers
          • 14.2 Market challenges
            • 14.3 Impact of drivers and challenges
              • Impact of drivers and challenges in 2024 and 2029
            • 14.4 Market opportunities/restraints

              15 Competitive Landscape

              • 15.1 Overview
                • 15.2 Competitive Landscape
                  • Overview on criticality of inputs and factors of differentiation
                • 15.3 Landscape disruption
                  • Overview on factors of disruption
                • 15.4 Industry risks
                  • Impact of key risks on business

                16 Competitive Analysis

                • 16.1 Companies profiled
                  • Companies covered
                • 16.2 Company ranking index
                  • Company ranking index
                • 16.3 Market positioning of companies
                  • Matrix on companies position and classification
                • 16.4 Amazon.com Inc.
                  • Amazon.com Inc. - Overview
                  • Amazon.com Inc. - Business segments
                  • Amazon.com Inc. - Key news
                  • Amazon.com Inc. - Key offerings
                  • Amazon.com Inc. - Segment focus
                  • SWOT
                • 16.5 Ataccama Corp.
                  • Ataccama Corp. - Overview
                  • Ataccama Corp. - Product / Service
                  • Ataccama Corp. - Key offerings
                  • SWOT
                • 16.6 Dataiku Inc.
                  • Dataiku Inc. - Overview
                  • Dataiku Inc. - Product / Service
                  • Dataiku Inc. - Key offerings
                  • SWOT
                • 16.7 Fair Isaac Corp.
                  • Fair Isaac Corp. - Overview
                  • Fair Isaac Corp. - Business segments
                  • Fair Isaac Corp. - Key news
                  • Fair Isaac Corp. - Key offerings
                  • Fair Isaac Corp. - Segment focus
                  • SWOT
                • 16.8 Google LLC
                  • Google LLC - Overview
                  • Google LLC - Product / Service
                  • Google LLC - Key news
                  • Google LLC - Key offerings
                  • SWOT
                • 16.9 H2O.ai Inc.
                  • H2O.ai Inc. - Overview
                  • H2O.ai Inc. - Product / Service
                  • H2O.ai Inc. - Key offerings
                  • SWOT
                • 16.10 Informatica Inc.
                  • Informatica Inc. - Overview
                  • Informatica Inc. - Product / Service
                  • Informatica Inc. - Key news
                  • Informatica Inc. - Key offerings
                  • SWOT
                • 16.11 International Business Machines Corp.
                  • International Business Machines Corp. - Overview
                  • International Business Machines Corp. - Business segments
                  • International Business Machines Corp. - Key news
                  • International Business Machines Corp. - Key offerings
                  • International Business Machines Corp. - Segment focus
                  • SWOT
                • 16.12 Meta Platforms Inc.
                  • Meta Platforms Inc. - Overview
                  • Meta Platforms Inc. - Product / Service
                  • Meta Platforms Inc. - Key news
                  • Meta Platforms Inc. - Key offerings
                  • SWOT
                • 16.13 Microsoft Corp.
                  • Microsoft Corp. - Overview
                  • Microsoft Corp. - Business segments
                  • Microsoft Corp. - Key news
                  • Microsoft Corp. - Key offerings
                  • Microsoft Corp. - Segment focus
                  • SWOT
                • 16.14 QlikTech international AB
                  • QlikTech international AB - Overview
                  • QlikTech international AB - Product / Service
                  • QlikTech international AB - Key offerings
                  • SWOT
                • 16.15 Salesforce Inc.
                  • Salesforce Inc. - Overview
                  • Salesforce Inc. - Product / Service
                  • Salesforce Inc. - Key news
                  • Salesforce Inc. - Key offerings
                  • SWOT
                • 16.16 SAP SE
                  • SAP SE - Overview
                  • SAP SE - Business segments
                  • SAP SE - Key news
                  • SAP SE - Key offerings
                  • SAP SE - Segment focus
                  • SWOT
                • 16.17 SAS Institute Inc.
                  • SAS Institute Inc. - Overview
                  • SAS Institute Inc. - Product / Service
                  • SAS Institute Inc. - Key news
                  • SAS Institute Inc. - Key offerings
                  • SWOT
                • 16.18 TIBCO Software Inc.
                  • TIBCO Software Inc. - Overview
                  • TIBCO Software Inc. - Product / Service
                  • TIBCO Software Inc. - Key offerings
                  • SWOT

                17 Appendix

                • 17.1 Scope of the report
                  • 17.2 Inclusions and exclusions checklist
                    • Inclusions checklist
                    • Exclusions checklist
                  • 17.3 Currency conversion rates for US$
                    • Currency conversion rates for US$
                  • 17.4 Research methodology
                    • Research methodology
                  • 17.5 Data procurement
                    • Information sources
                  • 17.6 Data validation
                    • Data validation
                  • 17.7 Validation techniques employed for market sizing
                    • Validation techniques employed for market sizing
                  • 17.8 Data synthesis
                    • Data synthesis
                  • 17.9 360 degree market analysis
                    • 360 degree market analysis
                  • 17.10 List of abbreviations
                    • List of abbreviations

                  Research Methodology

                  Technavio presents a detailed picture of the market by way of study, synthesis, and summation of data from multiple sources. The analysts have presented the various facets of the market with a particular focus on identifying the key industry influencers. The data thus presented is comprehensive, reliable, and the result of extensive research, both primary and secondary.

                  INFORMATION SOURCES

                  Primary sources

                  • Manufacturers and suppliers
                  • Channel partners
                  • Industry experts
                  • Strategic decision makers

                  Secondary sources

                  • Industry journals and periodicals
                  • Government data
                  • Financial reports of key industry players
                  • Historical data
                  • Press releases

                  DATA ANALYSIS

                  Data Synthesis

                  • Collation of data
                  • Estimation of key figures
                  • Analysis of derived insights

                  Data Validation

                  • Triangulation with data models
                  • Reference against proprietary databases
                  • Corroboration with industry experts

                  REPORT WRITING

                  Qualitative

                  • Market drivers
                  • Market challenges
                  • Market trends
                  • Five forces analysis

                  Quantitative

                  • Market size and forecast
                  • Market segmentation
                  • Geographical insights
                  • Competitive landscape

                  Interested in this report?

                  Get your sample now to see our research methodology and insights!

                  Download Now

                  Frequently Asked Questions

                  Artificial Intelligence (Ai) Governance market growth will increase by $ 3127734.9 thousand during 2025-2029 .

                  The Artificial Intelligence (Ai) Governance market is expected to grow at a CAGR of 64.6% during 2025-2029 .

                  Artificial Intelligence (Ai) Governance market is segmented by End-user( Government and defense, Healthcare and life sciences, BFSI, Retail, Others) Component( Solution, Services) Application( Model lifecycle management, Risk and compliance, Monitoring and auditing, Ethics and responsible AI, South America)

                  Amazon.com Inc., Ataccama Corp., Dataiku Inc., DataRobot Inc., Fair Isaac Corp., Google LLC, H2O.ai Inc., Informatica Inc., International Business Machines Corp., Meta Platforms Inc., Microsoft Corp., QlikTech international AB, Salesforce Inc., SAP SE, SAS Institute Inc., TIBCO Software Inc. are a few of the key vendors in the Artificial Intelligence (Ai) Governance market.

                  North America will register the highest growth rate of 29% among the other regions. Therefore, the Artificial Intelligence (Ai) Governance market in North America is expected to garner significant business opportunities for the vendors during the forecast period.

                  US, China, UK, Brazil, Japan, Germany, France, Italy, India, South Korea

                  • Increasing adoption of AI technologies across industriesThe global artificial intelligence (AI) governance market is significantly fueled by the growing usage of AI technologies across industries such as aerospace and defense is the driving factor this market.
                  • healthcare is the driving factor this market.
                  • and BFSI is the driving factor this market.
                  • among others. In order to ensure responsible and ethical AI practices is the driving factor this market.
                  • organizations must have strong governance frameworks as they integrate AI technologies into their operations. Concerns about data privacy is the driving factor this market.
                  • bias is the driving factor this market.
                  • accountability is the driving factor this market.
                  • and transparency are growing as AI is being used widely in industries like healthcare is the driving factor this market.
                  • banking is the driving factor this market.
                  • manufacturing is the driving factor this market.
                  • and transportation. To meet these issues is the driving factor this market.
                  • comprehensive AI governance techniques such as Ethical AI frameworks and Algorithmic auditing is the driving factor this market.
                  • among others that consider specific threats and repercussions of adopting AI is the driving factor this market.
                  • are needed. In December 2024 is the driving factor this market.
                  • the U.S. Food and Drug Administration (FDA) finalized guidelines to streamline the approval process for AI-powered medical devices. These new recommendations enable manufacturers to update AI-enabled devices without the need to resubmit extensive documentation is the driving factor this market.
                  • thereby facilitating the quicker deployment of innovative medical technologies while ensuring safety and efficacy standards are maintained. Thus is the driving factor this market.
                  • the global demand for efficient AI governance frameworks and practices is being fueled by the increasing deployment of AI technologies. Therefore is the driving factor this market.
                  • the increasing adoption of AI across industries is expected to drive the growth of the market in focus during the forecast period. is the driving factor this market.

                  The Artificial Intelligence (Ai) Governance market vendors should focus on grabbing business opportunities from the Government and defense segment as it accounted for the largest market share in the base year.