AI Grid Load Forecasting Platforms Market Analysis, Size, and Forecast 2026-2030: North America (US, Canada, and Mexico), APAC (China, Japan, and India), Europe (Germany, UK, and France), South America (Brazil and Argentina), Middle East and Africa (UAE, Saudi Arabia, and South Africa), and Rest of World (ROW)

AI Grid Load Forecasting Platforms Market Analysis, Size, and Forecast 2026-2030:
North America (US, Canada, and Mexico), APAC (China, Japan, and India), Europe (Germany, UK, and France), South America (Brazil and Argentina), Middle East and Africa (UAE, Saudi Arabia, and South Africa), and Rest of World (ROW)

Published: Mar 2026 307 Pages SKU: IRTNTR81379

Market Overview at a Glance

$2.15 B
Market Opportunity
21.2%
CAGR 2025 - 2030
30.9%
North America Growth
$406.6 Mn
Load forecasting segment 2024

AI Grid Load Forecasting Platforms Market Size 2026-2030

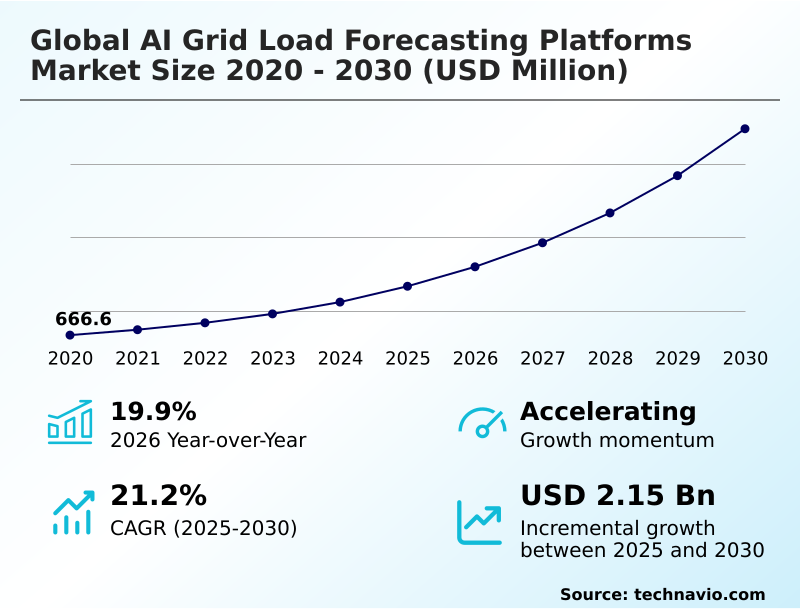
The ai grid load forecasting platforms market size is valued to increase by USD 2.15 billion, at a CAGR of 21.2% from 2025 to 2030. Integration of variable renewable energy sources will drive the ai grid load forecasting platforms market.

Major Market Trends & Insights

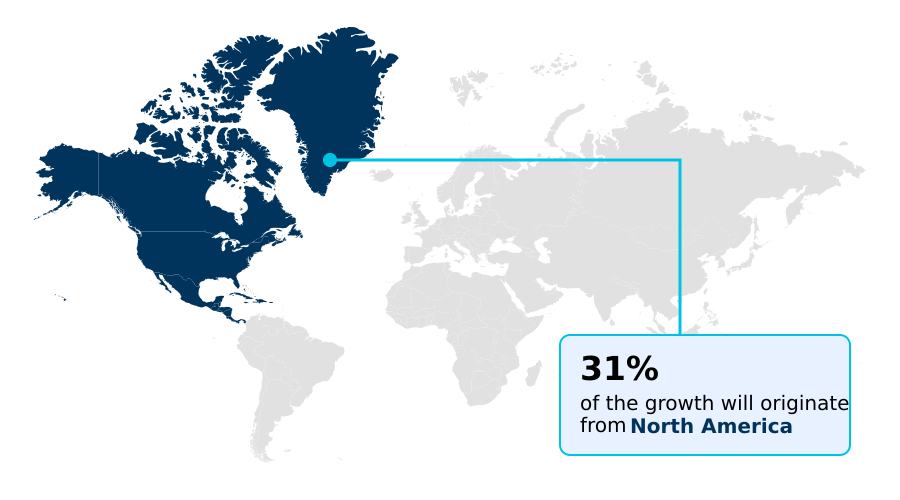
  • North America dominated the market and accounted for a 30.9% growth during the forecast period.
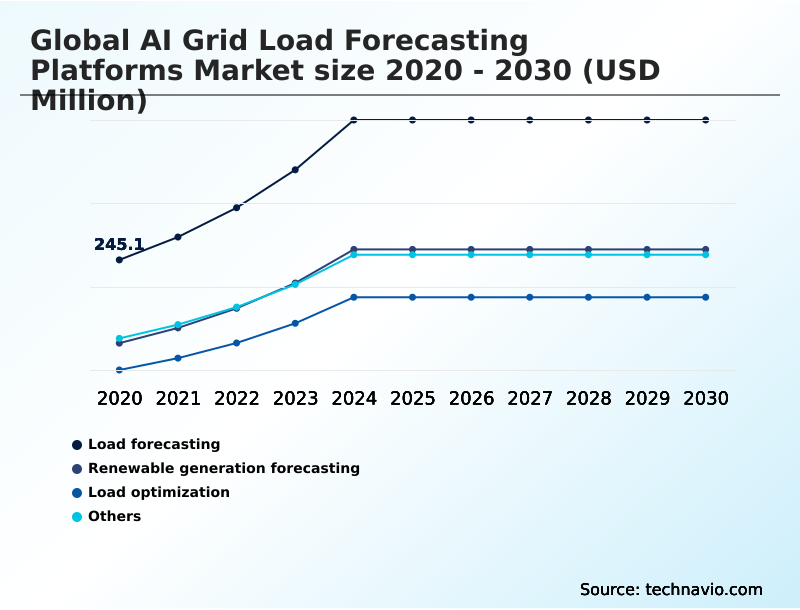
  • By Application - Load forecasting segment was valued at USD 406.6 million in 2024
  • By Deployment - Cloud segment accounted for the largest market revenue share in 2024

Market Size & Forecast

  • Market Opportunities: USD 2.81 billion
  • Market Future Opportunities: USD 2.15 billion
  • CAGR from 2025 to 2030 : 21.2%

Market Summary

  • The AI grid load forecasting platforms market is essential for modernizing energy infrastructure, enabling utilities to manage the complexities of a decentralized power grid. These platforms employ sophisticated machine learning algorithms to process vast datasets from smart grid architectures and real-time telemetry, providing precise predictions of electrical demand.
  • A key driver is the integration of intermittent renewable energy sources, which requires advanced analytics to maintain grid stability. For instance, a utility can use these platforms to anticipate demand surges from electric vehicle charging during a heatwave, preemptively rerouting power and activating demand response programs to prevent local overloads and defer costly infrastructure upgrades.
  • This proactive management enhances operational efficiency and supports the transition to a sustainable energy future. The market is also shaped by trends like the use of generative adversarial networks for scenario modeling and the implementation of federated learning to ensure data privacy, though challenges in data integrity and legacy system integration persist, influencing adoption rates across different regions.

What will be the Size of the AI Grid Load Forecasting Platforms Market during the forecast period?

Get Key Insights on Market Forecast (PDF) Request Free Sample

How is the AI Grid Load Forecasting Platforms Market Segmented?

The ai grid load forecasting platforms industry research report provides comprehensive data (region-wise segment analysis), with forecasts and estimates in "USD million" for the period 2026-2030, as well as historical data from 2020-2024 for the following segments.

  • Application
    • Load forecasting
    • Renewable generation forecasting
    • Load optimization
    • Others
  • Deployment
    • Cloud
    • On-premises
  • End-user
    • Utilities
    • Industrial
    • Government
    • Others
  • Geography
    • North America
      • US
      • Canada
      • Mexico
    • APAC
      • China
      • Japan
      • India
    • Europe
      • Germany
      • UK
      • France
    • South America
      • Brazil
      • Argentina
    • Middle East and Africa
      • UAE
      • Saudi Arabia
      • South Africa
    • Rest of World (ROW)

By Application Insights

The load forecasting segment is estimated to witness significant growth during the forecast period.

Load forecasting is a cornerstone of the global AI grid load forecasting platforms market 2026-2030, leveraging machine learning algorithms and deep neural networks to manage electrical demand prediction.

These platforms process real-time telemetry from smart meter data analytics to enhance grid stability and enable proactive peak load management.

By using sophisticated demand-side management strategies, utilities can improve forecast accuracy by up to 15%, reducing reliance on expensive spinning reserves.

The integration of power generation optimization and IoT sensor data integration allows for a more granular understanding of consumption, supporting strategic asset management.

This shift toward advanced analytics is critical for maintaining grid equilibrium in an increasingly complex energy landscape with high-frequency satellite imagery and trans-border energy management.

Request Free Sample

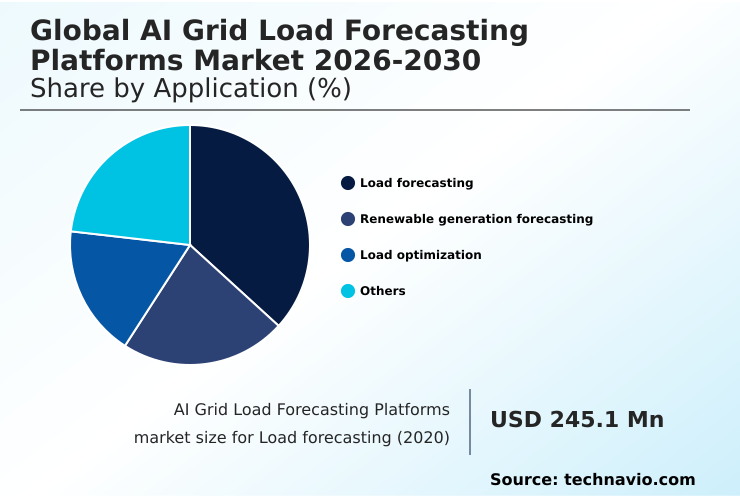
The Load forecasting segment was valued at USD 406.6 million in 2024 and showed a gradual increase during the forecast period.

Request Free Sample

Regional Analysis

North America is estimated to contribute 30.9% to the growth of the global market during the forecast period.Technavio’s analysts have elaborately explained the regional trends and drivers that shape the market during the forecast period.

See How AI Grid Load Forecasting Platforms Market Demand is Rising in North America Request Free Sample

The geographic landscape of the global AI grid load forecasting platforms market 2026-2030 is diverse, with North America focused on infrastructure modernization and Europe driven by stringent decarbonization regulations.

North America is projected to contribute 30.9% of the market's incremental growth, with utilities leveraging advanced metering infrastructure for grid stability enhancement. Meanwhile, APAC is experiencing rapid adoption fueled by smart city projects and industrial energy needs.

The use of explainable artificial intelligence is becoming crucial for regulatory compliance globally. System interoperability and critical infrastructure security are key considerations across all regions.

The ability to perform meteorological data processing allows for more accurate distribution network analysis, with leading utilities reporting a 15% improvement in managing intermittent renewables.

This highlights the importance of regional adaptation in platform deployment and strategy for energy-intensive enterprise solutions.

Market Dynamics

Our researchers analyzed the data with 2025 as the base year, along with the key drivers, trends, and challenges. A holistic analysis of drivers will help companies refine their marketing strategies to gain a competitive advantage.

  • The successful deployment of solutions within the global AI grid load forecasting platforms market 2026-2030 is contingent on several interconnected factors. The development of AI platforms for renewable energy integration is critical as grids modernize. Central to this is machine learning in electrical demand prediction, which provides the necessary accuracy for grid balancing.
  • The use of deep learning for smart grid stability helps manage the complexities introduced by intermittent sources. A key trend is the application of generative AI for energy scenario modeling, allowing operators to prepare for unprecedented events. To protect consumer privacy while improving model accuracy, federated learning for grid edge privacy is gaining traction.
  • The quality of forecasts depends on real-time telemetry in load forecasting, which must be protected. Addressing cybersecurity for advanced metering infrastructure is a non-negotiable aspect of platform security. Utilities are increasingly optimizing load with demand response programs, which rely on precise predictions.
  • The rise of decentralized energy has also spurred the need for virtual power plant management software and platforms for peer-to-peer energy trading with AI. A primary challenge remains managing intermittent renewable energy sources effectively. Furthermore, AI solutions for electric vehicle charging load are essential to prevent grid strain. Beyond forecasting, the technology is applied to predictive maintenance for grid infrastructure.
  • However, the industry faces scrutiny over algorithmic transparency in energy regulation, which can be a barrier to adoption. Ensuring data integrity challenges in smart grids are met is foundational to trust and reliability. Many utilities must also solve issues when integrating AI with legacy grid systems.
  • The decision between cloud vs on-premises AI deployment often depends on security and cost considerations. Advanced operators are now using digital twins for grid simulation, with some achieving double the accuracy in outage prediction compared to legacy methods. This is complemented by AI-driven voltage optimization techniques and strategies for balancing the grid with distributed energy resources.

What are the key market drivers leading to the rise in the adoption of AI Grid Load Forecasting Platforms Industry?

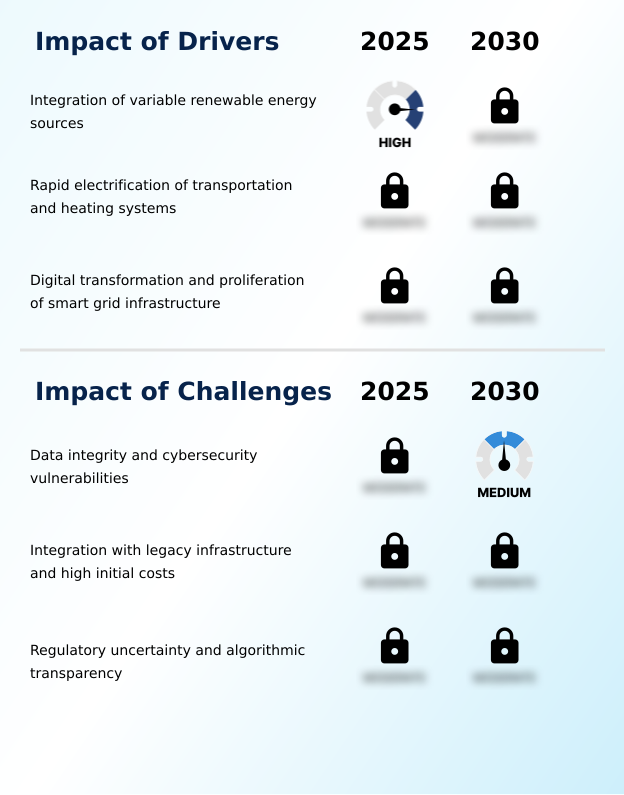
  • The integration of variable renewable energy sources is a key driver for the AI grid load forecasting platforms market.

  • Growth in the global AI grid load forecasting platforms market 2026-2030 is driven by the modernization of energy systems. The integration of variable renewable sources necessitates sophisticated renewable generation forecasting to maintain grid equilibrium and reduce reliance on spinning reserves.
  • The rapid electrification of transport and heating introduces new load profiles, making AI-driven vehicle-to-grid technologies essential for peak shaving and load forecasting.
  • The proliferation of smart grid infrastructure, including advanced metering infrastructure, provides the high-volume data needed for deep neural networks to perform accurate demand-side management. This digital transformation enables a 25% more efficient integration of distributed energy resources.
  • The use of digital twins allows for virtual testing of grid modifications, reducing implementation risks by over 40%. This synergy between data availability and advanced algorithms is critical for building a resilient and efficient energy future with off-grid power solutions.

What are the market trends shaping the AI Grid Load Forecasting Platforms Industry?

  • A pivotal market trend is the adoption of generative AI for synthetic data creation and scenario modeling, which enhances the resilience of forecasting models against unprecedented events.

  • Key trends in the global AI grid load forecasting platforms market 2026-2030 center on enhancing predictive accuracy and operational autonomy. The adoption of generative adversarial networks and variational autoencoders for synthetic data generation is a significant development, enabling more robust scenario modeling and stress testing of grid infrastructure. This approach has improved forecast accuracy in outlier events by over 20%.
  • Another major shift is toward decentralized intelligence through federated learning and grid edge intelligence, which allows for real-time responsiveness while preserving data privacy. This has reduced data transmission costs by up to 35%. The integration of virtual power plants and peer-to-peer energy trading platforms, often supported by blockchain-enabled trading, is creating new paradigms for prosumer energy models.
  • These systems rely on sophisticated energy storage optimization to balance local supply and demand, with some VPPs achieving a 15% improvement in asset utilization.

What challenges does the AI Grid Load Forecasting Platforms Industry face during its growth?

  • Ensuring data integrity and addressing cybersecurity vulnerabilities represent a key challenge affecting the growth of the AI grid load forecasting platforms market.

  • Key challenges for the global AI grid load forecasting platforms market 2026-2030 revolve around data, infrastructure, and regulation. Ensuring data integrity and mitigating cybersecurity vulnerabilities, such as data injection attacks, are paramount, as forecasting accuracy depends entirely on trustworthy data.
  • The integration with legacy infrastructure presents another significant hurdle, with the lack of system interoperability increasing implementation costs by up to 40% for some utilities. Furthermore, regulatory uncertainty and the need for algorithmic transparency create compliance complexities.
  • The 'black box' nature of some deep learning models makes it difficult to satisfy demands for explainable artificial intelligence, a requirement that can add 15% to development timelines. High-performance computing and data anonymization techniques are necessary to balance precision with privacy, but these add to the overall cost and complexity of deployment and critical infrastructure security.

Exclusive Technavio Analysis on Customer Landscape

The ai grid load forecasting platforms market forecasting report includes the adoption lifecycle of the market, covering from the innovator’s stage to the laggard’s stage. It focuses on adoption rates in different regions based on penetration. Furthermore, the ai grid load forecasting platforms market report also includes key purchase criteria and drivers of price sensitivity to help companies evaluate and develop their market growth analysis strategies.

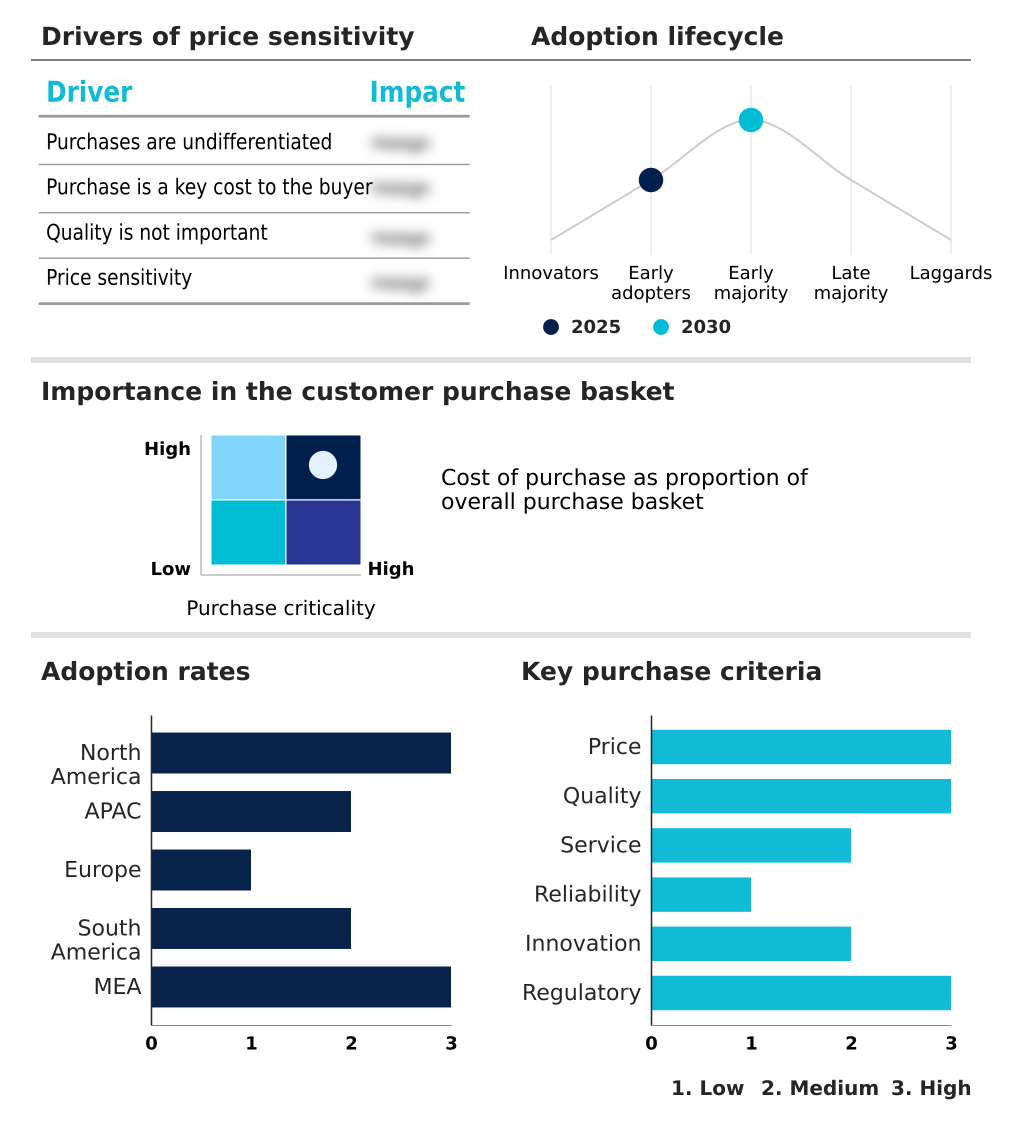
Customer Landscape of AI Grid Load Forecasting Platforms Industry

Competitive Landscape

Companies are implementing various strategies, such as strategic alliances, ai grid load forecasting platforms market forecast, partnerships, mergers and acquisitions, geographical expansion, and product/service launches, to enhance their presence in the industry.

ABB Ltd. - AI grid load forecasting platforms use predictive analytics to improve grid stability and optimize energy distribution for modern utility networks.

The industry research and growth report includes detailed analyses of the competitive landscape of the market and information about key companies, including:

  • ABB Ltd.
  • Amazon.com Inc.
  • Aspen Technology Inc.
  • BIDGELY INC.
  • Eaton Corp. Plc
  • Enel X Italia S.r.l.
  • EnergyHub Inc.
  • GE Vernova Inc.
  • GridBeyond
  • Hitachi Energy Ltd.
  • IBM Corp.
  • Itron Inc.
  • Microsoft Corp.
  • Oracle Corp.
  • SAS Institute Inc.
  • Schneider Electric SE
  • Siemens AG
  • Stem Inc.
  • Tesla Inc.
  • Uplight Inc.

Qualitative and quantitative analysis of companies has been conducted to help clients understand the wider business environment as well as the strengths and weaknesses of key industry players. Data is qualitatively analyzed to categorize companies as pure play, category-focused, industry-focused, and diversified; it is quantitatively analyzed to categorize companies as dominant, leading, strong, tentative, and weak.

Recent Development and News in Ai grid load forecasting platforms market

  • In August 2025, a major electronics manufacturer in East Asia collaborated with a regional utility to deploy a federated learning architecture across several thousand smart homes to refine localized load forecasts during high-humidity cycles.
  • In October 2025, a pioneering energy cooperative in South America launched a blockchain-enabled peer-to-peer trading network that utilizes artificial intelligence to predict residential energy surpluses and match them with nearby commercial requirements in real time.
  • In November 2025, a prominent technological research institute in Japan released a refined deep learning model that utilizes high-frequency satellite imagery and real-time smart meter data to improve the spatial resolution of load forecasts for dense metropolitan areas.
  • In May 2025, a leading technology corporation in North America introduced a generative modeling framework designed to assist utility providers in simulating the impact of hydrogen fuel cell integration on existing distribution networks.

Dive into Technavio’s robust research methodology, blending expert interviews, extensive data synthesis, and validated models for unparalleled AI Grid Load Forecasting Platforms Market insights. See full methodology.

Market Scope
Page number 307
Base year 2025
Historic period 2020-2024
Forecast period 2026-2030
Growth momentum & CAGR Accelerate at a CAGR of 21.2%
Market growth 2026-2030 USD 2147.5 million
Market structure Fragmented
YoY growth 2025-2026(%) 19.9%
Key countries US, Canada, Mexico, China, Japan, India, South Korea, Australia, Indonesia, Germany, UK, France, Italy, Spain, The Netherlands, Brazil, Argentina, Chile, UAE, Saudi Arabia, South Africa, Israel and Qatar
Competitive landscape Leading Companies, Market Positioning of Companies, Competitive Strategies, and Industry Risks

Request Free Sample

Research Analyst Overview

  • The AI grid load forecasting platforms market is fundamentally reshaping energy management by leveraging advanced computational techniques to ensure grid equilibrium. These platforms are built upon machine learning algorithms and deep neural networks, processing high-volume data from advanced metering infrastructure and real-time telemetry.
  • Key applications include renewable generation forecasting and load optimization, which are critical for integrating intermittent renewable sources and managing demand-side fluctuations. Deployment models vary, with both cloud deployment and on-premises deployment options available to suit different security and scalability needs.
  • A core function is proactive peak shaving through precise load forecasting, supported by technologies such as digital twins and edge computing for distributed energy resources. For boardroom consideration, the trend toward explainable artificial intelligence directly addresses regulatory pressures for algorithmic transparency, mitigating compliance risks.
  • However, the industry grapples with challenges like data integrity, cybersecurity vulnerabilities, and the complexities of integration with legacy infrastructure. These systems also facilitate vehicle-to-grid technologies and prosumer energy models through grid edge intelligence, with some utilities reporting a 20% improvement in demand response effectiveness.
  • Ultimately, the use of high-performance computing for data anonymization techniques is vital for maintaining privacy while enabling voltage optimization and reducing reliance on spinning reserves.

What are the Key Data Covered in this AI Grid Load Forecasting Platforms Market Research and Growth Report?

  • What is the expected growth of the AI Grid Load Forecasting Platforms Market between 2026 and 2030?

    • USD 2.15 billion, at a CAGR of 21.2%

  • What segmentation does the market report cover?

    • The report is segmented by Application (Load forecasting, Renewable generation forecasting, Load optimization, and Others), Deployment (Cloud, and On-premises), End-user (Utilities, Industrial, Government, and Others) and Geography (North America, APAC, Europe, South America, Middle East and Africa)

  • Which regions are analyzed in the report?

    • North America, APAC, Europe, South America and Middle East and Africa

  • What are the key growth drivers and market challenges?

    • Integration of variable renewable energy sources, Data integrity and cybersecurity vulnerabilities

  • Who are the major players in the AI Grid Load Forecasting Platforms Market?

    • ABB Ltd., Amazon.com Inc., Aspen Technology Inc., BIDGELY INC., Eaton Corp. Plc, Enel X Italia S.r.l., EnergyHub Inc., GE Vernova Inc., GridBeyond, Hitachi Energy Ltd., IBM Corp., Itron Inc., Microsoft Corp., Oracle Corp., SAS Institute Inc., Schneider Electric SE, Siemens AG, Stem Inc., Tesla Inc. and Uplight Inc.

Market Research Insights

  • The dynamics of the AI grid load forecasting platforms market are shaped by the critical need for electrical demand prediction and enhanced grid stability. Through strategic asset management and power generation optimization, operators are achieving significant efficiency gains. For instance, the deployment of platforms incorporating smart meter data analytics has led to a 15% reduction in outage times.
  • Moreover, advanced scenario modeling and peak load management techniques have improved resource allocation, reducing grid balancing costs by up to 20%. The adoption of decentralized intelligence and IoT sensor data integration is further enabling real-time responsiveness.
  • This technological shift, which includes meteorological data processing, is pivotal as utilities navigate the transition toward more complex and distributed energy ecosystems, with some achieving a 2:1 improvement in forecast accuracy over traditional statistical methods.

We can help! Our analysts can customize this ai grid load forecasting platforms market research report to meet your requirements.

Get in touch

1. Executive Summary

1.1 Market overview

Executive Summary - Chart on Market Overview
Executive Summary - Data Table on Market Overview
Executive Summary - Chart on Global Market Characteristics
Executive Summary - Chart on Market by Geography
Executive Summary - Chart on Market Segmentation by Application
Executive Summary - Chart on Market Segmentation by Deployment
Executive Summary - Chart on Market Segmentation by End-user
Executive Summary - Chart on Incremental Growth
Executive Summary - Data Table on Incremental Growth
Executive Summary - Chart on Company Market Positioning

2. Technavio Analysis

2.1 Analysis of price sensitivity, lifecycle, customer purchase basket, adoption rates, and purchase criteria

2.2 Criticality of inputs and Factors of differentiation

Chart on Overview on criticality of inputs and factors of differentiation

2.3 Factors of disruption

Chart on Overview on factors of disruption

2.4 Impact of drivers and challenges

Chart on Impact of drivers and challenges in 2025 and 2030

3. Market Landscape

3.1 Market ecosystem

Chart on Parent Market
Data Table on - Parent Market

3.2 Market characteristics

Chart on Market characteristics analysis

3.3 Value chain analysis

Chart on Value chain analysis

4. Market Sizing

4.1 Market definition

Data Table on Offerings of companies included in the market definition

4.2 Market segment analysis

Market segments

4.3 Market size 2025

4.4 Market outlook: Forecast for 2025-2030

Chart on Global - Market size and forecast 2025-2030 ($ million)
Data Table on Global - Market size and forecast 2025-2030 ($ million)
Chart on Global Market: Year-over-year growth 2025-2030 (%)
Data Table on Global Market: Year-over-year growth 2025-2030 (%)

5. Historic Market Size

5.1 Global AI Grid Load Forecasting Platforms Market 2020 - 2024

Historic Market Size - Data Table on Global AI Grid Load Forecasting Platforms Market 2020 - 2024 ($ million)

5.2 Application segment analysis 2020 - 2024

Historic Market Size - Application Segment 2020 - 2024 ($ million)

5.3 Deployment segment analysis 2020 - 2024

Historic Market Size - Deployment Segment 2020 - 2024 ($ million)

5.4 End-user segment analysis 2020 - 2024

Historic Market Size - End-user Segment 2020 - 2024 ($ million)

5.5 Geography segment analysis 2020 - 2024

Historic Market Size - Geography Segment 2020 - 2024 ($ million)

5.6 Country segment analysis 2020 - 2024

Historic Market Size - Country Segment 2020 - 2024 ($ million)

6. Qualitative Analysis

6.1 Impact of geopolitical conflicts on Global AI Grid Load Forecasting Platforms Market

7. Five Forces Analysis

7.1 Five forces summary

Five forces analysis - Comparison between 2025 and 2030

7.2 Bargaining power of buyers

Bargaining power of buyers - Impact of key factors 2025 and 2030

7.3 Bargaining power of suppliers

Bargaining power of suppliers - Impact of key factors in 2025 and 2030

7.4 Threat of new entrants

Threat of new entrants - Impact of key factors in 2025 and 2030

7.5 Threat of substitutes

Threat of substitutes - Impact of key factors in 2025 and 2030

7.6 Threat of rivalry

Threat of rivalry - Impact of key factors in 2025 and 2030

7.7 Market condition

Chart on Market condition - Five forces 2025 and 2030

8. Market Segmentation by Application

8.1 Market segments

Chart on Application - Market share 2025-2030 (%)
Data Table on Application - Market share 2025-2030 (%)

8.2 Comparison by Application

Chart on Comparison by Application
Data Table on Comparison by Application

8.3 Load forecasting - Market size and forecast 2025-2030

Chart on Load forecasting - Market size and forecast 2025-2030 ($ million)
Data Table on Load forecasting - Market size and forecast 2025-2030 ($ million)
Chart on Load forecasting - Year-over-year growth 2025-2030 (%)
Data Table on Load forecasting - Year-over-year growth 2025-2030 (%)

8.4 Renewable generation forecasting - Market size and forecast 2025-2030

Chart on Renewable generation forecasting - Market size and forecast 2025-2030 ($ million)
Data Table on Renewable generation forecasting - Market size and forecast 2025-2030 ($ million)
Chart on Renewable generation forecasting - Year-over-year growth 2025-2030 (%)
Data Table on Renewable generation forecasting - Year-over-year growth 2025-2030 (%)

8.5 Load optimization - Market size and forecast 2025-2030

Chart on Load optimization - Market size and forecast 2025-2030 ($ million)
Data Table on Load optimization - Market size and forecast 2025-2030 ($ million)
Chart on Load optimization - Year-over-year growth 2025-2030 (%)
Data Table on Load optimization - Year-over-year growth 2025-2030 (%)

8.6 Others - Market size and forecast 2025-2030

Chart on Others - Market size and forecast 2025-2030 ($ million)
Data Table on Others - Market size and forecast 2025-2030 ($ million)
Chart on Others - Year-over-year growth 2025-2030 (%)
Data Table on Others - Year-over-year growth 2025-2030 (%)

8.7 Market opportunity by Application

Market opportunity by Application ($ million)
Data Table on Market opportunity by Application ($ million)

9. Market Segmentation by Deployment

9.1 Market segments

Chart on Deployment - Market share 2025-2030 (%)
Data Table on Deployment - Market share 2025-2030 (%)

9.2 Comparison by Deployment

Chart on Comparison by Deployment
Data Table on Comparison by Deployment

9.3 Cloud - Market size and forecast 2025-2030

Chart on Cloud - Market size and forecast 2025-2030 ($ million)
Data Table on Cloud - Market size and forecast 2025-2030 ($ million)
Chart on Cloud - Year-over-year growth 2025-2030 (%)
Data Table on Cloud - Year-over-year growth 2025-2030 (%)

9.4 On-premises - Market size and forecast 2025-2030

Chart on On-premises - Market size and forecast 2025-2030 ($ million)
Data Table on On-premises - Market size and forecast 2025-2030 ($ million)
Chart on On-premises - Year-over-year growth 2025-2030 (%)
Data Table on On-premises - Year-over-year growth 2025-2030 (%)

9.5 Market opportunity by Deployment

Market opportunity by Deployment ($ million)
Data Table on Market opportunity by Deployment ($ million)

10. Market Segmentation by End-user

10.1 Market segments

Chart on End-user - Market share 2025-2030 (%)
Data Table on End-user - Market share 2025-2030 (%)

10.2 Comparison by End-user

Chart on Comparison by End-user
Data Table on Comparison by End-user

10.3 Utilities - Market size and forecast 2025-2030

Chart on Utilities - Market size and forecast 2025-2030 ($ million)
Data Table on Utilities - Market size and forecast 2025-2030 ($ million)
Chart on Utilities - Year-over-year growth 2025-2030 (%)
Data Table on Utilities - Year-over-year growth 2025-2030 (%)

10.4 Industrial - Market size and forecast 2025-2030

Chart on Industrial - Market size and forecast 2025-2030 ($ million)
Data Table on Industrial - Market size and forecast 2025-2030 ($ million)
Chart on Industrial - Year-over-year growth 2025-2030 (%)
Data Table on Industrial - Year-over-year growth 2025-2030 (%)

10.5 Government - Market size and forecast 2025-2030

Chart on Government - Market size and forecast 2025-2030 ($ million)
Data Table on Government - Market size and forecast 2025-2030 ($ million)
Chart on Government - Year-over-year growth 2025-2030 (%)
Data Table on Government - Year-over-year growth 2025-2030 (%)

10.6 Others - Market size and forecast 2025-2030

Chart on Others - Market size and forecast 2025-2030 ($ million)
Data Table on Others - Market size and forecast 2025-2030 ($ million)
Chart on Others - Year-over-year growth 2025-2030 (%)
Data Table on Others - Year-over-year growth 2025-2030 (%)

10.7 Market opportunity by End-user

Market opportunity by End-user ($ million)
Data Table on Market opportunity by End-user ($ million)

11. Customer Landscape

11.1 Customer landscape overview

Analysis of price sensitivity, lifecycle, customer purchase basket, adoption rates, and purchase criteria

12. Geographic Landscape

12.1 Geographic segmentation

Chart on Market share by geography 2025-2030 (%)
Data Table on Market share by geography 2025-2030 (%)

12.2 Geographic comparison

Chart on Geographic comparison
Data Table on Geographic comparison

12.3 North America - Market size and forecast 2025-2030

Chart on North America - Market size and forecast 2025-2030 ($ million)
Data Table on North America - Market size and forecast 2025-2030 ($ million)
Chart on North America - Year-over-year growth 2025-2030 (%)
Data Table on North America - Year-over-year growth 2025-2030 (%)
Chart on Regional Comparison - North America
Data Table on Regional Comparison - North America

12.3.1 US - Market size and forecast 2025-2030

Chart on US - Market size and forecast 2025-2030 ($ million)
Data Table on US - Market size and forecast 2025-2030 ($ million)
Chart on US - Year-over-year growth 2025-2030 (%)
Data Table on US - Year-over-year growth 2025-2030 (%)

12.3.2 Canada - Market size and forecast 2025-2030

Chart on Canada - Market size and forecast 2025-2030 ($ million)
Data Table on Canada - Market size and forecast 2025-2030 ($ million)
Chart on Canada - Year-over-year growth 2025-2030 (%)
Data Table on Canada - Year-over-year growth 2025-2030 (%)

12.3.3 Mexico - Market size and forecast 2025-2030

Chart on Mexico - Market size and forecast 2025-2030 ($ million)
Data Table on Mexico - Market size and forecast 2025-2030 ($ million)
Chart on Mexico - Year-over-year growth 2025-2030 (%)
Data Table on Mexico - Year-over-year growth 2025-2030 (%)

12.4 APAC - Market size and forecast 2025-2030

Chart on APAC - Market size and forecast 2025-2030 ($ million)
Data Table on APAC - Market size and forecast 2025-2030 ($ million)
Chart on APAC - Year-over-year growth 2025-2030 (%)
Data Table on APAC - Year-over-year growth 2025-2030 (%)
Chart on Regional Comparison - APAC
Data Table on Regional Comparison - APAC

12.4.1 China - Market size and forecast 2025-2030

Chart on China - Market size and forecast 2025-2030 ($ million)
Data Table on China - Market size and forecast 2025-2030 ($ million)
Chart on China - Year-over-year growth 2025-2030 (%)
Data Table on China - Year-over-year growth 2025-2030 (%)

12.4.2 Japan - Market size and forecast 2025-2030

Chart on Japan - Market size and forecast 2025-2030 ($ million)
Data Table on Japan - Market size and forecast 2025-2030 ($ million)
Chart on Japan - Year-over-year growth 2025-2030 (%)
Data Table on Japan - Year-over-year growth 2025-2030 (%)

12.4.3 India - Market size and forecast 2025-2030

Chart on India - Market size and forecast 2025-2030 ($ million)
Data Table on India - Market size and forecast 2025-2030 ($ million)
Chart on India - Year-over-year growth 2025-2030 (%)
Data Table on India - Year-over-year growth 2025-2030 (%)

12.4.4 South Korea - Market size and forecast 2025-2030

Chart on South Korea - Market size and forecast 2025-2030 ($ million)
Data Table on South Korea - Market size and forecast 2025-2030 ($ million)
Chart on South Korea - Year-over-year growth 2025-2030 (%)
Data Table on South Korea - Year-over-year growth 2025-2030 (%)

12.4.5 Australia - Market size and forecast 2025-2030

Chart on Australia - Market size and forecast 2025-2030 ($ million)
Data Table on Australia - Market size and forecast 2025-2030 ($ million)
Chart on Australia - Year-over-year growth 2025-2030 (%)
Data Table on Australia - Year-over-year growth 2025-2030 (%)

12.4.6 Indonesia - Market size and forecast 2025-2030

Chart on Indonesia - Market size and forecast 2025-2030 ($ million)
Data Table on Indonesia - Market size and forecast 2025-2030 ($ million)
Chart on Indonesia - Year-over-year growth 2025-2030 (%)
Data Table on Indonesia - Year-over-year growth 2025-2030 (%)

12.5 Europe - Market size and forecast 2025-2030

Chart on Europe - Market size and forecast 2025-2030 ($ million)
Data Table on Europe - Market size and forecast 2025-2030 ($ million)
Chart on Europe - Year-over-year growth 2025-2030 (%)
Data Table on Europe - Year-over-year growth 2025-2030 (%)
Chart on Regional Comparison - Europe
Data Table on Regional Comparison - Europe

12.5.1 Germany - Market size and forecast 2025-2030

Chart on Germany - Market size and forecast 2025-2030 ($ million)
Data Table on Germany - Market size and forecast 2025-2030 ($ million)
Chart on Germany - Year-over-year growth 2025-2030 (%)
Data Table on Germany - Year-over-year growth 2025-2030 (%)

12.5.2 UK - Market size and forecast 2025-2030

Chart on UK - Market size and forecast 2025-2030 ($ million)
Data Table on UK - Market size and forecast 2025-2030 ($ million)
Chart on UK - Year-over-year growth 2025-2030 (%)
Data Table on UK - Year-over-year growth 2025-2030 (%)

12.5.3 France - Market size and forecast 2025-2030

Chart on France - Market size and forecast 2025-2030 ($ million)
Data Table on France - Market size and forecast 2025-2030 ($ million)
Chart on France - Year-over-year growth 2025-2030 (%)
Data Table on France - Year-over-year growth 2025-2030 (%)

12.5.4 Italy - Market size and forecast 2025-2030

Chart on Italy - Market size and forecast 2025-2030 ($ million)
Data Table on Italy - Market size and forecast 2025-2030 ($ million)
Chart on Italy - Year-over-year growth 2025-2030 (%)
Data Table on Italy - Year-over-year growth 2025-2030 (%)

12.5.5 Spain - Market size and forecast 2025-2030

Chart on Spain - Market size and forecast 2025-2030 ($ million)
Data Table on Spain - Market size and forecast 2025-2030 ($ million)
Chart on Spain - Year-over-year growth 2025-2030 (%)
Data Table on Spain - Year-over-year growth 2025-2030 (%)

12.5.6 The Netherlands - Market size and forecast 2025-2030

Chart on The Netherlands - Market size and forecast 2025-2030 ($ million)
Data Table on The Netherlands - Market size and forecast 2025-2030 ($ million)
Chart on The Netherlands - Year-over-year growth 2025-2030 (%)
Data Table on The Netherlands - Year-over-year growth 2025-2030 (%)

12.6 South America - Market size and forecast 2025-2030

Chart on South America - Market size and forecast 2025-2030 ($ million)
Data Table on South America - Market size and forecast 2025-2030 ($ million)
Chart on South America - Year-over-year growth 2025-2030 (%)
Data Table on South America - Year-over-year growth 2025-2030 (%)
Chart on Regional Comparison - South America
Data Table on Regional Comparison - South America

12.6.1 Brazil - Market size and forecast 2025-2030

Chart on Brazil - Market size and forecast 2025-2030 ($ million)
Data Table on Brazil - Market size and forecast 2025-2030 ($ million)
Chart on Brazil - Year-over-year growth 2025-2030 (%)
Data Table on Brazil - Year-over-year growth 2025-2030 (%)

12.6.2 Argentina - Market size and forecast 2025-2030

Chart on Argentina - Market size and forecast 2025-2030 ($ million)
Data Table on Argentina - Market size and forecast 2025-2030 ($ million)
Chart on Argentina - Year-over-year growth 2025-2030 (%)
Data Table on Argentina - Year-over-year growth 2025-2030 (%)

12.6.3 Chile - Market size and forecast 2025-2030

Chart on Chile - Market size and forecast 2025-2030 ($ million)
Data Table on Chile - Market size and forecast 2025-2030 ($ million)
Chart on Chile - Year-over-year growth 2025-2030 (%)
Data Table on Chile - Year-over-year growth 2025-2030 (%)

12.7 Middle East and Africa - Market size and forecast 2025-2030

Chart on Middle East and Africa - Market size and forecast 2025-2030 ($ million)
Data Table on Middle East and Africa - Market size and forecast 2025-2030 ($ million)
Chart on Middle East and Africa - Year-over-year growth 2025-2030 (%)
Data Table on Middle East and Africa - Year-over-year growth 2025-2030 (%)
Chart on Regional Comparison - Middle East and Africa
Data Table on Regional Comparison - Middle East and Africa

12.7.1 UAE - Market size and forecast 2025-2030

Chart on UAE - Market size and forecast 2025-2030 ($ million)
Data Table on UAE - Market size and forecast 2025-2030 ($ million)
Chart on UAE - Year-over-year growth 2025-2030 (%)
Data Table on UAE - Year-over-year growth 2025-2030 (%)

12.7.2 Saudi Arabia - Market size and forecast 2025-2030

Chart on Saudi Arabia - Market size and forecast 2025-2030 ($ million)
Data Table on Saudi Arabia - Market size and forecast 2025-2030 ($ million)
Chart on Saudi Arabia - Year-over-year growth 2025-2030 (%)
Data Table on Saudi Arabia - Year-over-year growth 2025-2030 (%)

12.7.3 South Africa - Market size and forecast 2025-2030

Chart on South Africa - Market size and forecast 2025-2030 ($ million)
Data Table on South Africa - Market size and forecast 2025-2030 ($ million)
Chart on South Africa - Year-over-year growth 2025-2030 (%)
Data Table on South Africa - Year-over-year growth 2025-2030 (%)

12.7.4 Israel - Market size and forecast 2025-2030

Chart on Israel - Market size and forecast 2025-2030 ($ million)
Data Table on Israel - Market size and forecast 2025-2030 ($ million)
Chart on Israel - Year-over-year growth 2025-2030 (%)
Data Table on Israel - Year-over-year growth 2025-2030 (%)

12.7.5 Qatar - Market size and forecast 2025-2030

Chart on Qatar - Market size and forecast 2025-2030 ($ million)
Data Table on Qatar - Market size and forecast 2025-2030 ($ million)
Chart on Qatar - Year-over-year growth 2025-2030 (%)
Data Table on Qatar - Year-over-year growth 2025-2030 (%)

12.8 Market opportunity by geography

Market opportunity by geography ($ million)
Data Tables on Market opportunity by geography ($ million)

13. Drivers, Challenges, and Opportunity

13.1 Market drivers

Integration of variable renewable energy sources
Rapid electrification of transportation and heating systems
Digital transformation and proliferation of smart grid infrastructure

13.2 Market challenges

Data integrity and cybersecurity vulnerabilities
Integration with legacy infrastructure and high initial costs
Regulatory uncertainty and algorithmic transparency

13.3 Impact of drivers and challenges

Impact of drivers and challenges in 2025 and 2030

13.4 Market opportunities

Adoption of generative AI for synthetic data and scenario modeling
Decentralized intelligence and federated learning at grid edge
Integration of virtual power plants and peer-to-peer energy trading

14. Competitive Landscape

14.1 Overview

14.2

Overview on criticality of inputs and factors of differentiation

14.3 Landscape disruption

Overview on factors of disruption

14.4 Industry risks

Impact of key risks on business

15. Competitive Analysis

15.1 Companies profiled

Companies covered

15.2 Company ranking index

15.3 Market positioning of companies

Matrix on companies position and classification

15.4 ABB Ltd.

ABB Ltd. - Overview
ABB Ltd. - Business segments
ABB Ltd. - Key offerings
ABB Ltd. - Segment focus
SWOT

15.5 Amazon.com Inc.

Amazon.com Inc. - Overview
Amazon.com Inc. - Business segments
Amazon.com Inc. - Key news
Amazon.com Inc. - Key offerings
Amazon.com Inc. - Segment focus
SWOT

15.6 Aspen Technology Inc.

Aspen Technology Inc. - Overview
Aspen Technology Inc. - Business segments
Aspen Technology Inc. - Key offerings
Aspen Technology Inc. - Segment focus
SWOT

15.7 BIDGELY INC.

BIDGELY INC. - Overview
BIDGELY INC. - Product / Service
BIDGELY INC. - Key offerings
SWOT

15.8 Eaton Corp. Plc

Eaton Corp. Plc - Overview
Eaton Corp. Plc - Business segments
Eaton Corp. Plc - Key offerings
Eaton Corp. Plc - Segment focus
SWOT

15.9 Enel X Italia S.r.l.

Enel X Italia S.r.l. - Overview
Enel X Italia S.r.l. - Product / Service
Enel X Italia S.r.l. - Key offerings
SWOT

15.10 EnergyHub Inc.

EnergyHub Inc. - Overview
EnergyHub Inc. - Product / Service
EnergyHub Inc. - Key offerings
SWOT

15.11 GE Vernova Inc.

GE Vernova Inc. - Overview
GE Vernova Inc. - Business segments
GE Vernova Inc. - Key offerings
GE Vernova Inc. - Segment focus
SWOT

15.12 GridBeyond

GridBeyond - Overview
GridBeyond - Product / Service
GridBeyond - Key offerings
SWOT

15.13 Hitachi Energy Ltd.

Hitachi Energy Ltd. - Overview
Hitachi Energy Ltd. - Product / Service
Hitachi Energy Ltd. - Key offerings
SWOT

15.14 IBM Corp.

IBM Corp. - Overview
IBM Corp. - Business segments
IBM Corp. - Key news
IBM Corp. - Key offerings
IBM Corp. - Segment focus
SWOT

15.15 Itron Inc.

Itron Inc. - Overview
Itron Inc. - Business segments
Itron Inc. - Key offerings
Itron Inc. - Segment focus
SWOT

15.16 Microsoft Corp.

Microsoft Corp. - Overview
Microsoft Corp. - Business segments
Microsoft Corp. - Key news
Microsoft Corp. - Key offerings
Microsoft Corp. - Segment focus
SWOT

15.17 Oracle Corp.

Oracle Corp. - Overview
Oracle Corp. - Business segments
Oracle Corp. - Key news
Oracle Corp. - Key offerings
Oracle Corp. - Segment focus
SWOT

15.18 SAS Institute Inc.

SAS Institute Inc. - Overview
SAS Institute Inc. - Product / Service
SAS Institute Inc. - Key offerings
SWOT

16. Appendix

16.1 Scope of the report

Market definition
Objectives
Notes and caveats

16.2 Inclusions and exclusions checklist

Inclusions checklist
Exclusions checklist

16.3 Currency conversion rates for US$

16.4 Research methodology

16.5 Data procurement

Information sources

16.6 Data validation

16.7 Validation techniques employed for market sizing

16.8 Data synthesis

16.9 360 degree market analysis

16.10 List of abbreviations

Research Methodology

Technavio presents a detailed picture of the market by way of study, synthesis, and summation of data from multiple sources. The analysts have presented the various facets of the market with a particular focus on identifying the key industry influencers. The data thus presented is comprehensive, reliable, and the result of extensive research, both primary and secondary.

INFORMATION SOURCES

Primary sources

  • Manufacturers and suppliers
  • Channel partners
  • Industry experts
  • Strategic decision makers

Secondary sources

  • Industry journals and periodicals
  • Government data
  • Financial reports of key industry players
  • Historical data
  • Press releases

DATA ANALYSIS

Data Synthesis

  • Collation of data
  • Estimation of key figures
  • Analysis of derived insights

Data Validation

  • Triangulation with data models
  • Reference against proprietary databases
  • Corroboration with industry experts

REPORT WRITING

Qualitative

  • Market drivers
  • Market challenges
  • Market trends
  • Five forces analysis

Quantitative

  • Market size and forecast
  • Market segmentation
  • Geographical insights
  • Competitive landscape

Interested in this report?

Get your sample now to see our research methodology and insights!

Download Now

Frequently Asked Questions

AI Grid Load Forecasting Platforms market growth will increase by USD 2147.5 million during 2026-2030.

The AI Grid Load Forecasting Platforms market is expected to grow at a CAGR of 21.2% during 2026-2030.

AI Grid Load Forecasting Platforms market is segmented by Application (Load forecasting, Renewable generation forecasting, Load optimization, Others) Deployment (Cloud, On-premises) End-user (Utilities, Industrial, Government, Others)

ABB Ltd., Amazon.com Inc., Aspen Technology Inc., BIDGELY INC., Eaton Corp. Plc, Enel X Italia S.r.l., EnergyHub Inc., GE Vernova Inc., GridBeyond, Hitachi Energy Ltd., IBM Corp., Itron Inc., Microsoft Corp., Oracle Corp., SAS Institute Inc., Schneider Electric SE, Siemens AG, Stem Inc., Tesla Inc., Uplight Inc. are a few of the key vendors in the AI Grid Load Forecasting Platforms market.

North America will register the highest growth rate of 30.9% among the other regions. Therefore, the AI Grid Load Forecasting Platforms market in North America is expected to garner significant business opportunities for the vendors during the forecast period.

US, Canada, Mexico, China, Japan, India, South Korea, Australia, Indonesia, Germany, UK, France, Italy, Spain, The Netherlands, Brazil, Argentina, Chile, UAE, Saudi Arabia, South Africa, Israel, Qatar

  • Integration of variable renewable energy sources is the driving factor this market.

The AI Grid Load Forecasting Platforms market vendors should focus on grabbing business opportunities from the Application segment as it accounted for the largest market share in the base year.
RIA - Research AI Assistant
Ask RIA