AI In Drug Screening Market Analysis, Size, and Forecast 2025-2029: North America (US, Canada, and Mexico), Europe (Germany, UK, and France), APAC (China, Japan, and India), South America (Brazil), Middle East and Africa (South Africa, UAE, and Saudi Arabia), Asia, Rest of World (ROW)

AI In Drug Screening Market Analysis, Size, and Forecast 2025-2029:
North America (US, Canada, and Mexico), Europe (Germany, UK, and France), APAC (China, Japan, and India), South America (Brazil), Middle East and Africa (South Africa, UAE, and Saudi Arabia), Asia, Rest of World (ROW)

Published: Dec 2025 301 Pages SKU: IRTNTR81080

Market Overview at a Glance

$2.98 B
Market Opportunity
41.1%
CAGR 2024 - 2029
35.7%
North America Growth
$198 Mn
Drug repurposing segment 2023

AI In Drug Screening Market Size 2025-2029

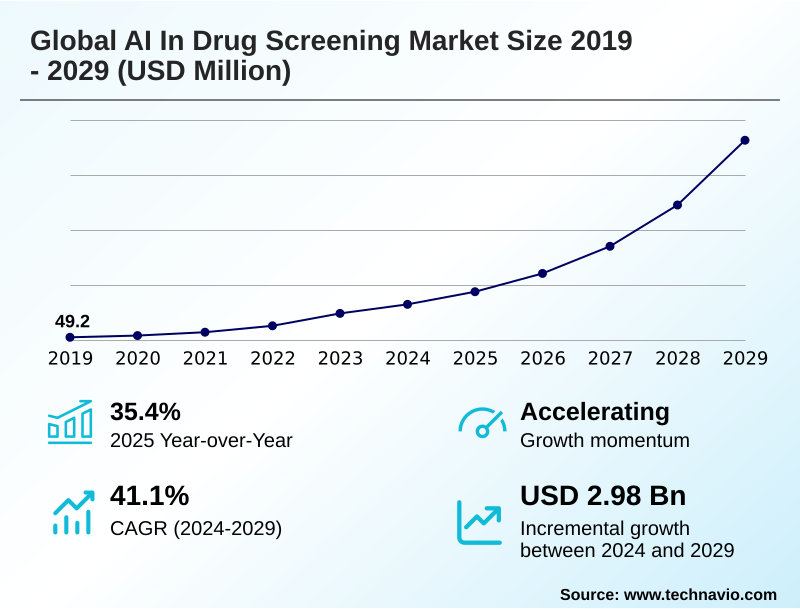
The ai in drug screening market size is valued to increase by USD 2.98 billion, at a CAGR of 41.1% from 2024 to 2029. Rising imperative to curtail drug discovery timelines and costs will drive the ai in drug screening market.

Major Market Trends & Insights

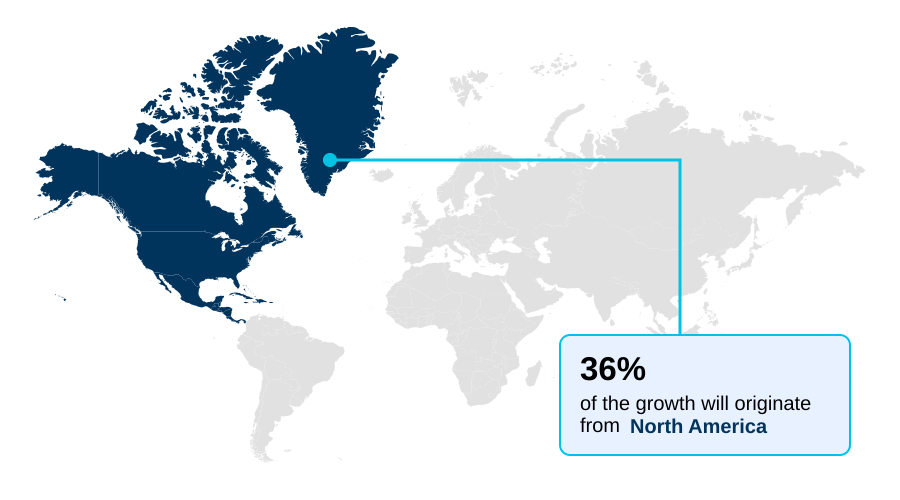
  • North America dominated the market and accounted for a 35.7% growth during the forecast period.
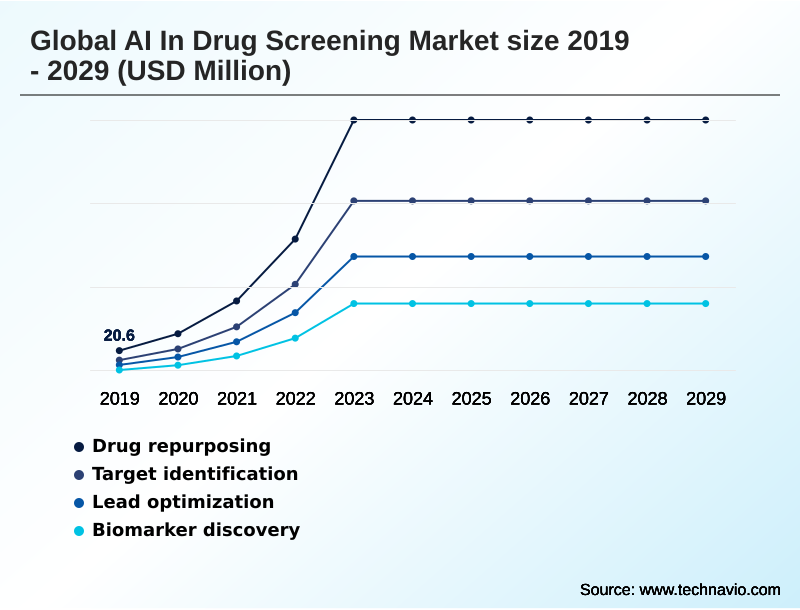
  • By Application - Drug repurposing segment was valued at USD 198 million in 2023
  • By Type - Preclinical testing segment accounted for the largest market revenue share in 2023

Market Size & Forecast

  • Market Opportunities: USD 3.58 billion
  • Market Future Opportunities: USD 2.98 billion
  • CAGR from 2024 to 2029 : 41.1%

Market Summary

  • The AI in drug screening market is fundamentally transforming pharmaceutical R&D by addressing the critical need for greater efficiency and cost-effectiveness. The core of this market involves the application of sophisticated machine learning models and deep learning algorithms to analyze vast and complex biological datasets.
  • This capability is a primary driver, enabling the rapid identification of viable drug targets and the prediction of molecular interactions with a speed unattainable through traditional methods. A key trend is the rise of generative AI drug creation, which moves beyond data analysis to the de novo design of novel therapeutics.
  • However, the industry faces challenges with data quality and accessibility, as the performance of any AI-powered drug discovery platform is contingent on high-quality training data.
  • In a common business scenario, a mid-sized biotechnology firm utilizes a computational drug design platform to screen billions of virtual compounds against a novel protein target for a rare neurological disorder, successfully identifying a dozen high-potential lead candidates in under three months—a process that would have previously taken several years and substantially more capital.

What will be the Size of the AI In Drug Screening Market during the forecast period?

Get Key Insights on Market Forecast (PDF) Request Free Sample

How is the AI In Drug Screening Market Segmented?

The ai in drug screening industry research report provides comprehensive data (region-wise segment analysis), with forecasts and estimates in "USD million" for the period 2025-2029, as well as historical data from 2019-2023 for the following segments.

  • Application
    • Drug repurposing
    • Target identification
    • Lead optimization
    • Biomarker discovery
  • Type
    • Preclinical testing
    • Clinical trials
    • Toxicity prediction
    • Virtual screening
  • End-user
    • Pharmaceutical companies
    • Biotechnology firms
    • Research institutes
    • Contract research organization
  • Geography
    • North America
      • US
      • Canada
      • Mexico
    • Europe
      • Germany
      • UK
      • France
    • Asia
    • Rest of World (ROW)

By Application Insights

The drug repurposing segment is estimated to witness significant growth during the forecast period.

The market is significantly shaped by drug repurposing, where existing therapeutics are evaluated for new indications. This strategy, accelerated by AI-powered drug discovery, allows firms to leverage established safety profiles, drastically reducing development risk.

Advanced deep learning algorithms systematically analyze complex biological and chemical data, identifying novel drug-disease connections that are often missed by traditional methods. Through in-silico drug discovery, these platforms can shorten preclinical timelines by more than 33%.

The application of AI for rare disease therapies is particularly impactful, opening new avenues where none existed.

This approach facilitates a shift toward data-driven R&D, where generative AI drug creation and even de novo therapeutic design can build upon existing molecular scaffolds to create superior next-generation treatments.

Request Free Sample

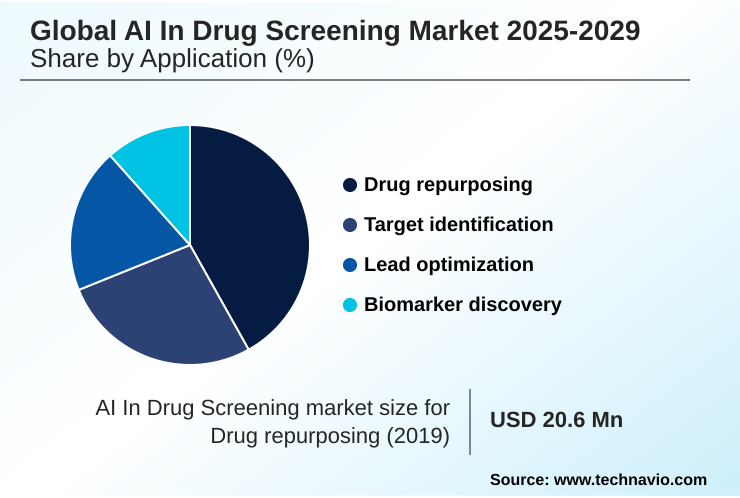
The Drug repurposing segment was valued at USD 198 million in 2023 and showed a gradual increase during the forecast period.

Request Free Sample

Regional Analysis

North America is estimated to contribute 35.7% to the growth of the global market during the forecast period.Technavio’s analysts have elaborately explained the regional trends and drivers that shape the market during the forecast period.

See How AI In Drug Screening Market Demand is Rising in North America Request Free Sample

Geographically, the market landscape is led by North America, which accounts for over 35% of the market's incremental growth, driven by its robust R&D infrastructure and venture capital ecosystem.

The region's focus on computational drug design and preclinical development optimization supports its dominant position.

Meanwhile, Asia is experiencing the most rapid expansion, with a growth rate outpacing other regions by nearly 4%, fueled by government initiatives and a burgeoning pharmaceutical sector.

This growth is supported by advancements in machine learning models and target identification and validation techniques.

Europe maintains a strong presence through strategic collaborations and a focus on predictive toxicology modeling, while other regions are building capabilities in specialized areas like high-throughput virtual screening, contributing to a globally interconnected innovation network.

Market Dynamics

Our researchers analyzed the data with 2024 as the base year, along with the key drivers, trends, and challenges. A holistic analysis of drivers will help companies refine their marketing strategies to gain a competitive advantage.

  • Strategic adoption of AI is becoming a key differentiator across therapeutic areas, shaping the future of pharmaceutical R&D. The impact of generative AI on antibody design is particularly transformative, enabling the creation of biologics with precisely engineered properties.
  • In parallel, the development of robust AI models for early stage toxicity prediction is helping to de-risk candidates much earlier in the pipeline, saving significant resources. Firms are increasingly relying on advanced QSAR modeling for novel drug candidates and leveraging deep learning applications in target identification to uncover previously unknown disease pathways.
  • This is especially evident in specialized fields like using AI for small molecule drug discovery and AI in drug screening for neurodegenerative diseases. The operational impact is significant; for example, implementing AI for optimizing preclinical testing protocols has demonstrated the ability to reduce animal model usage by up to 40%.
  • The sophistication of these tools is growing, with machine learning for clinical trial patient selection ensuring more homogenous study populations and higher success rates. The push for regulatory acceptance is driven by the need for explainable AI for regulatory approval processes, ensuring transparency in how candidates are selected.
  • This comprehensive integration of technology, from AI-driven virtual screening for kinase inhibitors to AI-based drug repurposing for rare diseases, is shortening development timelines and increasing the probability of success.

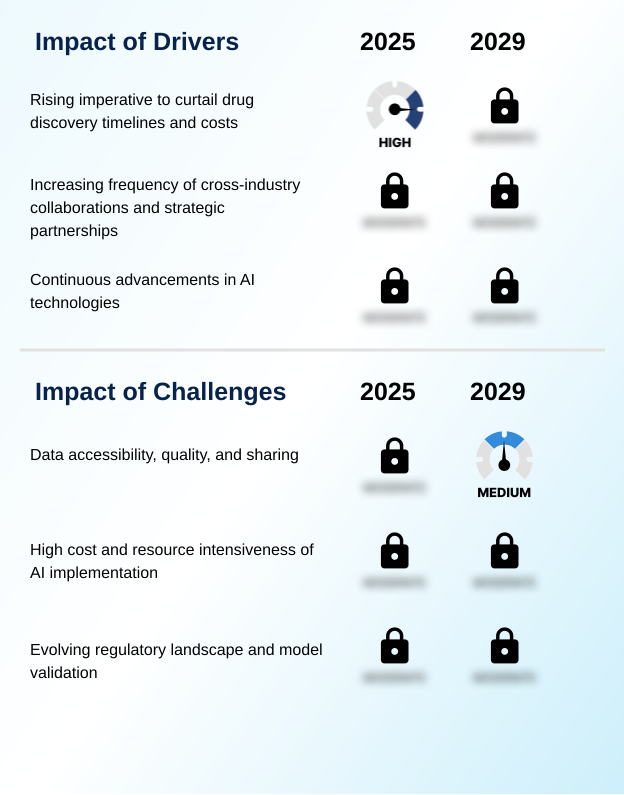
What are the key market drivers leading to the rise in the adoption of AI In Drug Screening Industry?

  • The increasing imperative to curtail drug discovery timelines and reduce the substantial costs associated with pharmaceutical R&D serves as a primary driver for the market.

  • Key market drivers are centered on efficiency and innovation. The adoption of protein structure prediction tools, building on breakthroughs like AlphaFold, has dramatically accelerated research, reducing the time for structural determination from months to hours.
  • This directly supports more accurate therapeutic antibody engineering and advanced quantitative structure-activity relationship (QSAR) modeling. The use of molecular dynamics simulation allows for a deeper understanding of drug-target interactions, which is critical for designing highly selective therapies.
  • These advanced computational biology models and bioinformatics platform integration are driving a paradigm shift.
  • For instance, integrated end-to-end AI discovery platforms have proven to shorten the preclinical phase from over three years to less than two, a greater than 30% reduction in time, significantly impacting R&D cost structures and speed to clinic.

What are the market trends shaping the AI In Drug Screening Industry?

  • The proliferation of generative AI represents a significant market trend, as this technology profoundly accelerates drug screening processes by enabling the in-silico design of novel molecules.

  • Market trends are increasingly defined by the sophistication of AI technologies. The application of molecular docking simulation is becoming more precise, with new algorithms improving prediction accuracy by over 15% for complex protein targets. This enhances lead optimization strategies and the utility of pharmacophore modeling.
  • Furthermore, the integration of multi-omics data integration is providing a more holistic view of disease biology, making biomarker discovery platforms more effective. The use of knowledge graph analysis enables researchers to uncover non-obvious relationships between genes, proteins, and diseases. This is particularly valuable for ADMET property prediction, where understanding downstream effects is critical.
  • A notable advancement is in generative chemistry platforms, which, when combined with retrosynthesis planning tools, can design novel, synthesizable molecules, accelerating hit-to-lead timelines by up to six months.

What challenges does the AI In Drug Screening Industry face during its growth?

  • Significant challenges related to data accessibility, quality standards, and the complexities of data sharing are restraining the industry's growth potential.

  • Despite significant advancements, the market faces persistent challenges, primarily concerning data and model validation. The 'black box' nature of some algorithms is a significant hurdle, making drug-target interaction prediction difficult to interpret for regulatory bodies. The integration of complex AI-based polypharmacology prediction tools requires deep domain expertise, which remains a scarce resource.
  • Furthermore, the lack of standardized data formats hinders the effectiveness of automated high-throughput screening and clinical trial outcome simulation, as poor data quality can reduce predictive accuracy by up to 20%.
  • The high computational cost of running organ-on-a-chip simulation at scale also presents a barrier for smaller organizations, limiting widespread adoption and creating a competitive disparity in the use of cutting-edge in-silico validation methods.

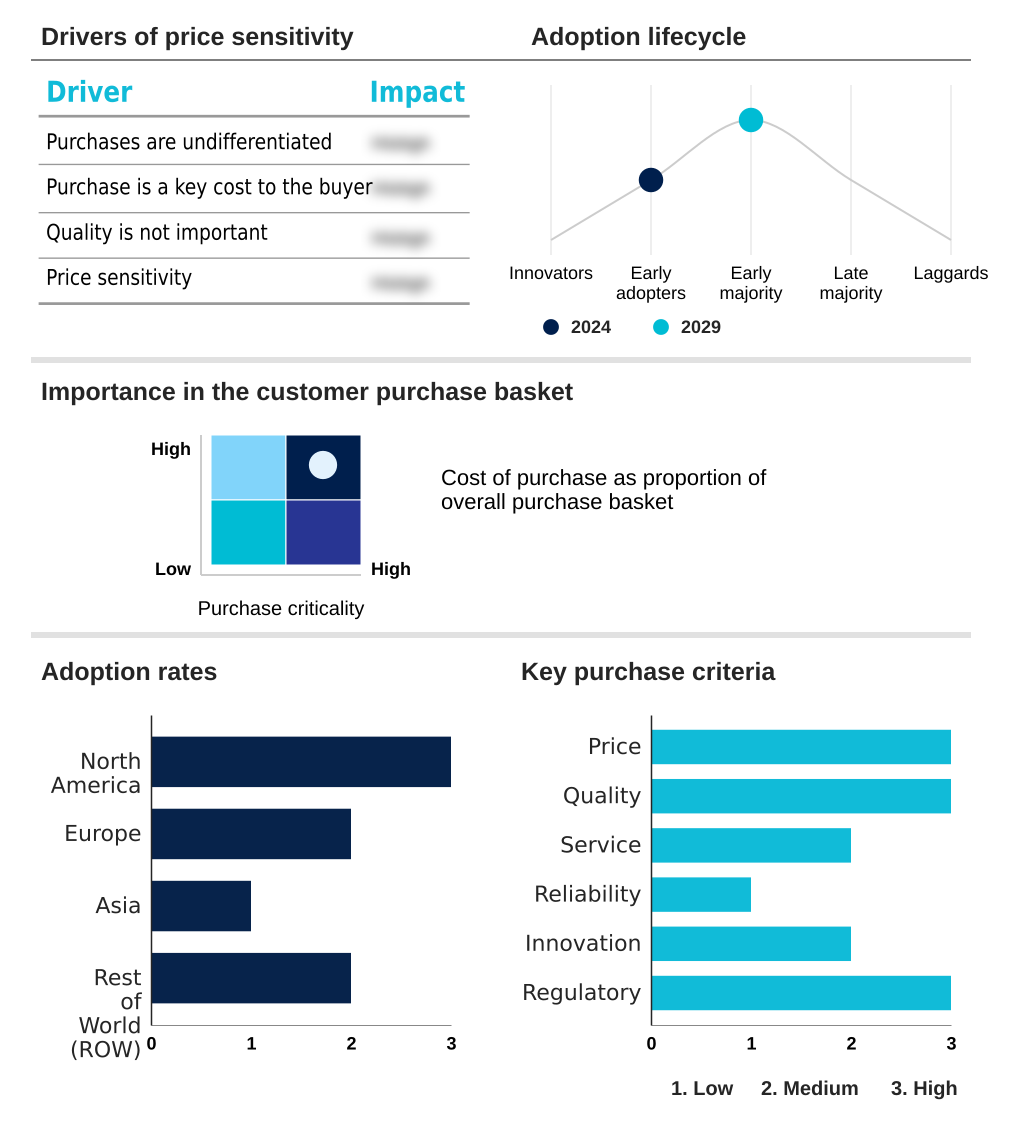
Exclusive Technavio Analysis on Customer Landscape

The ai in drug screening market forecasting report includes the adoption lifecycle of the market, covering from the innovator’s stage to the laggard’s stage. It focuses on adoption rates in different regions based on penetration. Furthermore, the ai in drug screening market report also includes key purchase criteria and drivers of price sensitivity to help companies evaluate and develop their market growth analysis strategies.

Customer Landscape of AI In Drug Screening Industry

Competitive Landscape

Companies are implementing various strategies, such as strategic alliances, ai in drug screening market forecast, partnerships, mergers and acquisitions, geographical expansion, and product/service launches, to enhance their presence in the industry.

Anima Biotech - Deep learning-driven platforms enable structure-based drug design, accelerating identification of novel small-molecule drug candidates and finding hits for hundreds of drug targets with high success rates.

The industry research and growth report includes detailed analyses of the competitive landscape of the market and information about key companies, including:

  • Anima Biotech
  • Atomwise Inc.
  • BenevolentAI
  • BioXcel Therapeutics Inc.
  • Charles River Laboratories
  • Deep Genomics Inc.
  • DenovAI
  • Evotec SE
  • Exscientia plc
  • Generate Biomedicines
  • Iktos
  • Insilico Medicine
  • insitro
  • Isomorphic Labs
  • Schrodinger Inc.
  • WuXi AppTec Co. Ltd.

Qualitative and quantitative analysis of companies has been conducted to help clients understand the wider business environment as well as the strengths and weaknesses of key industry players. Data is qualitatively analyzed to categorize companies as pure play, category-focused, industry-focused, and diversified; it is quantitatively analyzed to categorize companies as dominant, leading, strong, tentative, and weak.

Recent Development and News in Ai in drug screening market

  • In October 2024, BenevolentAI is scheduled to present its Retrieve to Explain system at a major European conference, showcasing a platform designed to provide transparent, interpretable explanations for its AI-driven drug target predictions.
  • In November 2024, NVIDIA announced a collaboration with Novo Nordisk to build customized AI models and agents for early-stage research and clinical development, powered by a new supercomputer to accelerate therapeutic innovation.
  • In February 2025, Pfizer announced a strategic partnership with AbCellera to leverage its advanced AI platform, aiming to automate and significantly accelerate the discovery process for therapeutic antibodies across multiple disease areas.
  • In April 2025, the Ignition AI Accelerator announced a strategic partnership with Pfizer aimed at transforming its drug discovery and development processes, with a key focus on leveraging AI for more efficient target identification.

Dive into Technavio’s robust research methodology, blending expert interviews, extensive data synthesis, and validated models for unparalleled AI In Drug Screening Market insights. See full methodology.

Market Scope
Page number 301
Base year 2024
Historic period 2019-2023
Forecast period 2025-2029
Growth momentum & CAGR Accelerate at a CAGR of 41.1%
Market growth 2025-2029 USD 2983.7 million
Market structure Fragmented
YoY growth 2024-2025(%) 35.4%
Key countries US, Canada, Mexico, Germany, UK, France, The Netherlands, Spain, Italy, Russia, China, Japan, India, South Korea, Singapore, Indonesia, Thailand, Australia, Brazil, South Africa, UAE, Saudi Arabia and Turkey
Competitive landscape Leading Companies, Market Positioning of Companies, Competitive Strategies, and Industry Risks

Request Free Sample

Research Analyst Overview

  • The AI in drug screening market is characterized by rapid innovation, where the convergence of biology and computation is creating unprecedented opportunities. Central to this evolution are generative AI drug creation and AI-powered drug discovery platforms, which are no longer niche technologies but core components of R&D.
  • The application of sophisticated deep learning algorithms for in-silico drug discovery and computational drug design is becoming standard practice. Progress in machine learning models enables superior target identification and validation and more effective preclinical development optimization. A key boardroom consideration is the trend toward explainable AI, which directly impacts regulatory strategy and risk management.
  • The ability to validate and interpret the outputs of predictive toxicology modeling is critical for gaining regulatory trust and securing investment. The efficiency gains are tangible; integrated platforms utilizing high-throughput virtual screening have demonstrated the capacity to reduce initial hit discovery timelines by over 70% compared to traditional lab-based methods, fundamentally altering the economics of early-stage pharmaceutical research and development.

What are the Key Data Covered in this AI In Drug Screening Market Research and Growth Report?

  • What is the expected growth of the AI In Drug Screening Market between 2025 and 2029?

    • USD 2.98 billion, at a CAGR of 41.1%

  • What segmentation does the market report cover?

    • The report is segmented by Application (Drug repurposing, Target identification, Lead optimization, and Biomarker discovery), Type (Preclinical testing, Clinical trials, Virtual screening, and Toxicity prediction), End-user (Pharmaceutical companies, Biotechnology firms, Research institutes, and Contract research organizations (CROs)) and Geography (North America, Europe, Asia, Rest of World (ROW))

  • Which regions are analyzed in the report?

    • North America, Europe, Asia and Rest of World (ROW)

  • What are the key growth drivers and market challenges?

    • Rising imperative to curtail drug discovery timelines and costs, Data accessibility, quality, and sharing

  • Who are the major players in the AI In Drug Screening Market?

    • Anima Biotech, Atomwise Inc., BenevolentAI, BioXcel Therapeutics Inc., Charles River Laboratories, Deep Genomics Inc., DenovAI, Evotec SE, Exscientia plc, Generate Biomedicines, Iktos, Insilico Medicine, insitro, Isomorphic Labs, Schrodinger Inc. and WuXi AppTec Co. Ltd.

Market Research Insights

  • Market dynamics are defined by a rapid technological evolution where end-to-end AI discovery platforms are becoming central to R&D strategy. The integration of causal AI in drug research is enabling firms to move beyond correlation to understand disease mechanisms, leading to higher quality target selection.
  • For instance, the use of AI-driven patient stratification has been shown to increase the success probability of clinical trials by over 15%. Furthermore, real-world evidence analysis, powered by natural language processing for literature mining, helps de-risk development by providing continuous insights.
  • This data-centric approach, leveraging digital twin technology for biology, is yielding significant returns, with some platforms demonstrating a fivefold improvement in hit-to-lead optimization efficiency compared to conventional high-throughput screening methods.

We can help! Our analysts can customize this ai in drug screening market research report to meet your requirements.

Get in touch

1. Executive Summary

1.1 Market overview

Executive Summary - Chart on Market Overview
Executive Summary - Data Table on Market Overview
Executive Summary - Chart on Global Market Characteristics
Executive Summary - Chart on Market by Geography
Executive Summary - Chart on Market Segmentation by Application
Executive Summary - Chart on Market Segmentation by Type
Executive Summary - Chart on Market Segmentation by End-user
Executive Summary - Chart on Incremental Growth
Executive Summary - Data Table on Incremental Growth
Executive Summary - Chart on Company Market Positioning

2. Technavio Analysis

2.1 Analysis of price sensitivity, lifecycle, customer purchase basket, adoption rates, and purchase criteria

2.2 Criticality of inputs and Factors of differentiation

Chart on Overview on criticality of inputs and factors of differentiation

2.3 Factors of disruption

Chart on Overview on factors of disruption

2.4 Impact of drivers and challenges

Chart on Impact of drivers and challenges in 2024 and 2029

3. Market Landscape

3.1 Market ecosystem

Chart on Parent Market
Data Table on - Parent Market

3.2 Market characteristics

Chart on Market characteristics analysis

3.3 Value chain analysis

Chart on Value chain analysis

4. Market Sizing

4.1 Market definition

Data Table on Offerings of companies included in the market definition

4.2 Market segment analysis

Market segments

4.3 Market size 2024

4.4 Market outlook: Forecast for 2024-2029

Chart on Global - Market size and forecast 2024-2029 ($ million)
Data Table on Global - Market size and forecast 2024-2029 ($ million)
Chart on Global Market: Year-over-year growth 2024-2029 (%)
Data Table on Global Market: Year-over-year growth 2024-2029 (%)

5. Historic Market Size

5.1 Global AI In Drug Screening Market 2019 - 2023

Historic Market Size - Data Table on Global AI In Drug Screening Market 2019 - 2023 ($ million)

5.2 Application segment analysis 2019 - 2023

Historic Market Size - Application Segment 2019 - 2023 ($ million)

5.3 Type segment analysis 2019 - 2023

Historic Market Size - Type Segment 2019 - 2023 ($ million)

5.4 End-user segment analysis 2019 - 2023

Historic Market Size - End-user Segment 2019 - 2023 ($ million)

5.5 Geography segment analysis 2019 - 2023

Historic Market Size - Geography Segment 2019 - 2023 ($ million)

5.6 Country segment analysis 2019 - 2023

Historic Market Size - Country Segment 2019 - 2023 ($ million)

6. Five Forces Analysis

6.1 Five forces summary

Five forces analysis - Comparison between 2024 and 2029

6.2 Bargaining power of buyers

Bargaining power of buyers - Impact of key factors 2024 and 2029

6.3 Bargaining power of suppliers

Bargaining power of suppliers - Impact of key factors in 2024 and 2029

6.4 Threat of new entrants

Threat of new entrants - Impact of key factors in 2024 and 2029

6.5 Threat of substitutes

Threat of substitutes - Impact of key factors in 2024 and 2029

6.6 Threat of rivalry

Threat of rivalry - Impact of key factors in 2024 and 2029

6.7 Market condition

Chart on Market condition - Five forces 2024 and 2029

7. Market Segmentation by Application

7.1 Market segments

Chart on Application - Market share 2024-2029 (%)
Data Table on Application - Market share 2024-2029 (%)

7.2 Comparison by Application

Chart on Comparison by Application
Data Table on Comparison by Application

7.3 Drug repurposing - Market size and forecast 2024-2029

Chart on Drug repurposing - Market size and forecast 2024-2029 ($ million)
Data Table on Drug repurposing - Market size and forecast 2024-2029 ($ million)
Chart on Drug repurposing - Year-over-year growth 2024-2029 (%)
Data Table on Drug repurposing - Year-over-year growth 2024-2029 (%)

7.4 Target identification - Market size and forecast 2024-2029

Chart on Target identification - Market size and forecast 2024-2029 ($ million)
Data Table on Target identification - Market size and forecast 2024-2029 ($ million)
Chart on Target identification - Year-over-year growth 2024-2029 (%)
Data Table on Target identification - Year-over-year growth 2024-2029 (%)

7.5 Lead optimization - Market size and forecast 2024-2029

Chart on Lead optimization - Market size and forecast 2024-2029 ($ million)
Data Table on Lead optimization - Market size and forecast 2024-2029 ($ million)
Chart on Lead optimization - Year-over-year growth 2024-2029 (%)
Data Table on Lead optimization - Year-over-year growth 2024-2029 (%)

7.6 Biomarker discovery - Market size and forecast 2024-2029

Chart on Biomarker discovery - Market size and forecast 2024-2029 ($ million)
Data Table on Biomarker discovery - Market size and forecast 2024-2029 ($ million)
Chart on Biomarker discovery - Year-over-year growth 2024-2029 (%)
Data Table on Biomarker discovery - Year-over-year growth 2024-2029 (%)

7.7 Market opportunity by Application

Market opportunity by Application ($ million)
Data Table on Market opportunity by Application ($ million)

8. Market Segmentation by Type

8.1 Market segments

Chart on Type - Market share 2024-2029 (%)
Data Table on Type - Market share 2024-2029 (%)

8.2 Comparison by Type

Chart on Comparison by Type
Data Table on Comparison by Type

8.3 Preclinical testing - Market size and forecast 2024-2029

Chart on Preclinical testing - Market size and forecast 2024-2029 ($ million)
Data Table on Preclinical testing - Market size and forecast 2024-2029 ($ million)
Chart on Preclinical testing - Year-over-year growth 2024-2029 (%)
Data Table on Preclinical testing - Year-over-year growth 2024-2029 (%)

8.4 Clinical trials - Market size and forecast 2024-2029

Chart on Clinical trials - Market size and forecast 2024-2029 ($ million)
Data Table on Clinical trials - Market size and forecast 2024-2029 ($ million)
Chart on Clinical trials - Year-over-year growth 2024-2029 (%)
Data Table on Clinical trials - Year-over-year growth 2024-2029 (%)

8.5 Toxicity prediction - Market size and forecast 2024-2029

Chart on Toxicity prediction - Market size and forecast 2024-2029 ($ million)
Data Table on Toxicity prediction - Market size and forecast 2024-2029 ($ million)
Chart on Toxicity prediction - Year-over-year growth 2024-2029 (%)
Data Table on Toxicity prediction - Year-over-year growth 2024-2029 (%)

8.6 Virtual screening - Market size and forecast 2024-2029

Chart on Virtual screening - Market size and forecast 2024-2029 ($ million)
Data Table on Virtual screening - Market size and forecast 2024-2029 ($ million)
Chart on Virtual screening - Year-over-year growth 2024-2029 (%)
Data Table on Virtual screening - Year-over-year growth 2024-2029 (%)

8.7 Market opportunity by Type

Market opportunity by Type ($ million)
Data Table on Market opportunity by Type ($ million)

9. Market Segmentation by End-user

9.1 Market segments

Chart on End-user - Market share 2024-2029 (%)
Data Table on End-user - Market share 2024-2029 (%)

9.2 Comparison by End-user

Chart on Comparison by End-user
Data Table on Comparison by End-user

9.3 Pharmaceutical companies - Market size and forecast 2024-2029

Chart on Pharmaceutical companies - Market size and forecast 2024-2029 ($ million)
Data Table on Pharmaceutical companies - Market size and forecast 2024-2029 ($ million)
Chart on Pharmaceutical companies - Year-over-year growth 2024-2029 (%)
Data Table on Pharmaceutical companies - Year-over-year growth 2024-2029 (%)

9.4 Biotechnology firms - Market size and forecast 2024-2029

Chart on Biotechnology firms - Market size and forecast 2024-2029 ($ million)
Data Table on Biotechnology firms - Market size and forecast 2024-2029 ($ million)
Chart on Biotechnology firms - Year-over-year growth 2024-2029 (%)
Data Table on Biotechnology firms - Year-over-year growth 2024-2029 (%)

9.5 Research institutes - Market size and forecast 2024-2029

Chart on Research institutes - Market size and forecast 2024-2029 ($ million)
Data Table on Research institutes - Market size and forecast 2024-2029 ($ million)
Chart on Research institutes - Year-over-year growth 2024-2029 (%)
Data Table on Research institutes - Year-over-year growth 2024-2029 (%)

9.6 Contract research organization - Market size and forecast 2024-2029

Chart on Contract research organization - Market size and forecast 2024-2029 ($ million)
Data Table on Contract research organization - Market size and forecast 2024-2029 ($ million)
Chart on Contract research organization - Year-over-year growth 2024-2029 (%)
Data Table on Contract research organization - Year-over-year growth 2024-2029 (%)

9.7 Market opportunity by End-user

Market opportunity by End-user ($ million)
Data Table on Market opportunity by End-user ($ million)

10. Customer Landscape

10.1 Customer landscape overview

Analysis of price sensitivity, lifecycle, customer purchase basket, adoption rates, and purchase criteria

11. Geographic Landscape

11.1 Geographic segmentation

Chart on Market share by geography 2024-2029 (%)
Data Table on Market share by geography 2024-2029 (%)

11.2 Geographic comparison

Chart on Geographic comparison
Data Table on Geographic comparison

11.3 North America - Market size and forecast 2024-2029

Chart on North America - Market size and forecast 2024-2029 ($ million)
Data Table on North America - Market size and forecast 2024-2029 ($ million)
Chart on North America - Year-over-year growth 2024-2029 (%)
Data Table on North America - Year-over-year growth 2024-2029 (%)
Chart on Regional Comparison - North America
Data Table on Regional Comparison - North America

11.3.1 US - Market size and forecast 2024-2029

Chart on US - Market size and forecast 2024-2029 ($ million)
Data Table on US - Market size and forecast 2024-2029 ($ million)
Chart on US - Year-over-year growth 2024-2029 (%)
Data Table on US - Year-over-year growth 2024-2029 (%)

11.3.2 Canada - Market size and forecast 2024-2029

Chart on Canada - Market size and forecast 2024-2029 ($ million)
Data Table on Canada - Market size and forecast 2024-2029 ($ million)
Chart on Canada - Year-over-year growth 2024-2029 (%)
Data Table on Canada - Year-over-year growth 2024-2029 (%)

11.3.3 Mexico - Market size and forecast 2024-2029

Chart on Mexico - Market size and forecast 2024-2029 ($ million)
Data Table on Mexico - Market size and forecast 2024-2029 ($ million)
Chart on Mexico - Year-over-year growth 2024-2029 (%)
Data Table on Mexico - Year-over-year growth 2024-2029 (%)

11.4 Europe - Market size and forecast 2024-2029

Chart on Europe - Market size and forecast 2024-2029 ($ million)
Data Table on Europe - Market size and forecast 2024-2029 ($ million)
Chart on Europe - Year-over-year growth 2024-2029 (%)
Data Table on Europe - Year-over-year growth 2024-2029 (%)
Chart on Regional Comparison - Europe
Data Table on Regional Comparison - Europe

11.4.1 Germany - Market size and forecast 2024-2029

Chart on Germany - Market size and forecast 2024-2029 ($ million)
Data Table on Germany - Market size and forecast 2024-2029 ($ million)
Chart on Germany - Year-over-year growth 2024-2029 (%)
Data Table on Germany - Year-over-year growth 2024-2029 (%)

11.4.2 UK - Market size and forecast 2024-2029

Chart on UK - Market size and forecast 2024-2029 ($ million)
Data Table on UK - Market size and forecast 2024-2029 ($ million)
Chart on UK - Year-over-year growth 2024-2029 (%)
Data Table on UK - Year-over-year growth 2024-2029 (%)

11.4.3 France - Market size and forecast 2024-2029

Chart on France - Market size and forecast 2024-2029 ($ million)
Data Table on France - Market size and forecast 2024-2029 ($ million)
Chart on France - Year-over-year growth 2024-2029 (%)
Data Table on France - Year-over-year growth 2024-2029 (%)

11.4.4 The Netherlands - Market size and forecast 2024-2029

Chart on The Netherlands - Market size and forecast 2024-2029 ($ million)
Data Table on The Netherlands - Market size and forecast 2024-2029 ($ million)
Chart on The Netherlands - Year-over-year growth 2024-2029 (%)
Data Table on The Netherlands - Year-over-year growth 2024-2029 (%)

11.4.5 Spain - Market size and forecast 2024-2029

Chart on Spain - Market size and forecast 2024-2029 ($ million)
Data Table on Spain - Market size and forecast 2024-2029 ($ million)
Chart on Spain - Year-over-year growth 2024-2029 (%)
Data Table on Spain - Year-over-year growth 2024-2029 (%)

11.4.6 Italy - Market size and forecast 2024-2029

Chart on Italy - Market size and forecast 2024-2029 ($ million)
Data Table on Italy - Market size and forecast 2024-2029 ($ million)
Chart on Italy - Year-over-year growth 2024-2029 (%)
Data Table on Italy - Year-over-year growth 2024-2029 (%)

11.4.7 Russia - Market size and forecast 2024-2029

Chart on Russia - Market size and forecast 2024-2029 ($ million)
Data Table on Russia - Market size and forecast 2024-2029 ($ million)
Chart on Russia - Year-over-year growth 2024-2029 (%)
Data Table on Russia - Year-over-year growth 2024-2029 (%)

11.5 Asia - Market size and forecast 2024-2029

Chart on Asia - Market size and forecast 2024-2029 ($ million)
Data Table on Asia - Market size and forecast 2024-2029 ($ million)
Chart on Asia - Year-over-year growth 2024-2029 (%)
Data Table on Asia - Year-over-year growth 2024-2029 (%)
Chart on Regional Comparison - Asia
Data Table on Regional Comparison - Asia

11.5.1 China - Market size and forecast 2024-2029

Chart on China - Market size and forecast 2024-2029 ($ million)
Data Table on China - Market size and forecast 2024-2029 ($ million)
Chart on China - Year-over-year growth 2024-2029 (%)
Data Table on China - Year-over-year growth 2024-2029 (%)

11.5.2 Japan - Market size and forecast 2024-2029

Chart on Japan - Market size and forecast 2024-2029 ($ million)
Data Table on Japan - Market size and forecast 2024-2029 ($ million)
Chart on Japan - Year-over-year growth 2024-2029 (%)
Data Table on Japan - Year-over-year growth 2024-2029 (%)

11.5.3 India - Market size and forecast 2024-2029

Chart on India - Market size and forecast 2024-2029 ($ million)
Data Table on India - Market size and forecast 2024-2029 ($ million)
Chart on India - Year-over-year growth 2024-2029 (%)
Data Table on India - Year-over-year growth 2024-2029 (%)

11.5.4 South Korea - Market size and forecast 2024-2029

Chart on South Korea - Market size and forecast 2024-2029 ($ million)
Data Table on South Korea - Market size and forecast 2024-2029 ($ million)
Chart on South Korea - Year-over-year growth 2024-2029 (%)
Data Table on South Korea - Year-over-year growth 2024-2029 (%)

11.5.5 Singapore - Market size and forecast 2024-2029

Chart on Singapore - Market size and forecast 2024-2029 ($ million)
Data Table on Singapore - Market size and forecast 2024-2029 ($ million)
Chart on Singapore - Year-over-year growth 2024-2029 (%)
Data Table on Singapore - Year-over-year growth 2024-2029 (%)

11.5.6 Indonesia - Market size and forecast 2024-2029

Chart on Indonesia - Market size and forecast 2024-2029 ($ million)
Data Table on Indonesia - Market size and forecast 2024-2029 ($ million)
Chart on Indonesia - Year-over-year growth 2024-2029 (%)
Data Table on Indonesia - Year-over-year growth 2024-2029 (%)

11.5.7 Thailand - Market size and forecast 2024-2029

Chart on Thailand - Market size and forecast 2024-2029 ($ million)
Data Table on Thailand - Market size and forecast 2024-2029 ($ million)
Chart on Thailand - Year-over-year growth 2024-2029 (%)
Data Table on Thailand - Year-over-year growth 2024-2029 (%)

11.6 Rest of World (ROW) - Market size and forecast 2024-2029

Chart on Rest of World (ROW) - Market size and forecast 2024-2029 ($ million)
Data Table on Rest of World (ROW) - Market size and forecast 2024-2029 ($ million)
Chart on Rest of World (ROW) - Year-over-year growth 2024-2029 (%)
Data Table on Rest of World (ROW) - Year-over-year growth 2024-2029 (%)
Chart on Regional Comparison - Rest of World (ROW)
Data Table on Regional Comparison - Rest of World (ROW)

11.6.1 Australia - Market size and forecast 2024-2029

Chart on Australia - Market size and forecast 2024-2029 ($ million)
Data Table on Australia - Market size and forecast 2024-2029 ($ million)
Chart on Australia - Year-over-year growth 2024-2029 (%)
Data Table on Australia - Year-over-year growth 2024-2029 (%)

11.6.2 Brazil - Market size and forecast 2024-2029

Chart on Brazil - Market size and forecast 2024-2029 ($ million)
Data Table on Brazil - Market size and forecast 2024-2029 ($ million)
Chart on Brazil - Year-over-year growth 2024-2029 (%)
Data Table on Brazil - Year-over-year growth 2024-2029 (%)

11.6.3 South Africa - Market size and forecast 2024-2029

Chart on South Africa - Market size and forecast 2024-2029 ($ million)
Data Table on South Africa - Market size and forecast 2024-2029 ($ million)
Chart on South Africa - Year-over-year growth 2024-2029 (%)
Data Table on South Africa - Year-over-year growth 2024-2029 (%)

11.6.4 UAE - Market size and forecast 2024-2029

Chart on UAE - Market size and forecast 2024-2029 ($ million)
Data Table on UAE - Market size and forecast 2024-2029 ($ million)
Chart on UAE - Year-over-year growth 2024-2029 (%)
Data Table on UAE - Year-over-year growth 2024-2029 (%)

11.6.5 Saudi Arabia - Market size and forecast 2024-2029

Chart on Saudi Arabia - Market size and forecast 2024-2029 ($ million)
Data Table on Saudi Arabia - Market size and forecast 2024-2029 ($ million)
Chart on Saudi Arabia - Year-over-year growth 2024-2029 (%)
Data Table on Saudi Arabia - Year-over-year growth 2024-2029 (%)

11.6.6 Turkey - Market size and forecast 2024-2029

Chart on Turkey - Market size and forecast 2024-2029 ($ million)
Data Table on Turkey - Market size and forecast 2024-2029 ($ million)
Chart on Turkey - Year-over-year growth 2024-2029 (%)
Data Table on Turkey - Year-over-year growth 2024-2029 (%)

11.7 Market opportunity by geography

Market opportunity by geography ($ million)
Data Tables on Market opportunity by geography ($ million)

12. Drivers, Challenges, and Opportunity

12.1 Market drivers

Rising imperative to curtail drug discovery timelines and costs
Increasing frequency of cross-industry collaborations and strategic partnerships
Continuous advancements in AI technologies

12.2 Market challenges

Data accessibility, quality, and sharing
High cost and resource intensiveness of AI implementation
Evolving regulatory landscape and model validation

12.3 Impact of drivers and challenges

Impact of drivers and challenges in 2024 and 2029

12.4 Market opportunities

Proliferation of generative AI in accelerating drug screening
Imperative of explainable AI for regulatory trust and adoption
AI-powered target identification and validation as foundational strategy

13. Competitive Landscape

13.1 Overview

13.2

Overview on criticality of inputs and factors of differentiation

13.3 Landscape disruption

Overview on factors of disruption

13.4 Industry risks

Impact of key risks on business

14. Competitive Analysis

14.1 Companies profiled

Companies covered

14.2 Company ranking index

14.3 Market positioning of companies

Matrix on companies position and classification

14.4 Anima Biotech

Anima Biotech - Overview
Anima Biotech - Product / Service
Anima Biotech - Key offerings
SWOT

14.5 Atomwise Inc.

Atomwise Inc. - Overview
Atomwise Inc. - Product / Service
Atomwise Inc. - Key offerings
SWOT

14.6 BenevolentAI

BenevolentAI - Overview
BenevolentAI - Product / Service
BenevolentAI - Key offerings
SWOT

14.7 BioXcel Therapeutics Inc.

BioXcel Therapeutics Inc. - Overview
BioXcel Therapeutics Inc. - Product / Service
BioXcel Therapeutics Inc. - Key offerings
SWOT

14.8 Charles River Laboratories

Charles River Laboratories - Overview
Charles River Laboratories - Business segments
Charles River Laboratories - Key offerings
Charles River Laboratories - Segment focus
SWOT

14.9 Deep Genomics Inc.

Deep Genomics Inc. - Overview
Deep Genomics Inc. - Product / Service
Deep Genomics Inc. - Key offerings
SWOT

14.10 Evotec SE

Evotec SE - Overview
Evotec SE - Business segments
Evotec SE - Key news
Evotec SE - Key offerings
Evotec SE - Segment focus
SWOT

14.11 Exscientia plc

Exscientia plc - Overview
Exscientia plc - Product / Service
Exscientia plc - Key offerings
SWOT

14.12 Generate Biomedicines

Generate Biomedicines - Overview
Generate Biomedicines - Product / Service
Generate Biomedicines - Key offerings
SWOT

14.13 Iktos

Iktos - Overview
Iktos - Product / Service
Iktos - Key offerings
SWOT

14.14 Insilico Medicine

Insilico Medicine - Overview
Insilico Medicine - Product / Service
Insilico Medicine - Key offerings
SWOT

14.15 insitro

insitro - Overview
insitro - Product / Service
insitro - Key offerings
SWOT

14.16 Isomorphic Labs

Isomorphic Labs - Overview
Isomorphic Labs - Product / Service
Isomorphic Labs - Key offerings
SWOT

14.17 Schrodinger Inc.

Schrodinger Inc. - Overview
Schrodinger Inc. - Business segments
Schrodinger Inc. - Key offerings
Schrodinger Inc. - Segment focus
SWOT

14.18 WuXi AppTec Co. Ltd.

WuXi AppTec Co. Ltd. - Overview
WuXi AppTec Co. Ltd. - Business segments
WuXi AppTec Co. Ltd. - Key offerings
WuXi AppTec Co. Ltd. - Segment focus
SWOT

15. Appendix

15.1 Scope of the report

Market definition
Objectives
Notes and caveats

15.2 Inclusions and exclusions checklist

Inclusions checklist
Exclusions checklist

15.3 Currency conversion rates for US$

15.4 Research methodology

15.5 Data procurement

Information sources

15.6 Data validation

15.7 Validation techniques employed for market sizing

15.8 Data synthesis

15.9 360 degree market analysis

15.10 List of abbreviations

Research Methodology

Technavio presents a detailed picture of the market by way of study, synthesis, and summation of data from multiple sources. The analysts have presented the various facets of the market with a particular focus on identifying the key industry influencers. The data thus presented is comprehensive, reliable, and the result of extensive research, both primary and secondary.

INFORMATION SOURCES

Primary sources

  • Manufacturers and suppliers
  • Channel partners
  • Industry experts
  • Strategic decision makers

Secondary sources

  • Industry journals and periodicals
  • Government data
  • Financial reports of key industry players
  • Historical data
  • Press releases

DATA ANALYSIS

Data Synthesis

  • Collation of data
  • Estimation of key figures
  • Analysis of derived insights

Data Validation

  • Triangulation with data models
  • Reference against proprietary databases
  • Corroboration with industry experts

REPORT WRITING

Qualitative

  • Market drivers
  • Market challenges
  • Market trends
  • Five forces analysis

Quantitative

  • Market size and forecast
  • Market segmentation
  • Geographical insights
  • Competitive landscape

Interested in this report?

Get your sample now to see our research methodology and insights!

Download Now

Frequently Asked Questions

AI In Drug Screening market growth will increase by USD 2983.7 million during 2025-2029 .

The AI In Drug Screening market is expected to grow at a CAGR of 41.1% during 2025-2029 .

AI In Drug Screening market is segmented by Application (Drug repurposing, Target identification, Lead optimization, Biomarker discovery) Type (Preclinical testing, Clinical trials, Toxicity prediction, Virtual screening) End-user (Pharmaceutical companies, Biotechnology firms, Research institutes, Contract research organization)

Anima Biotech, Atomwise Inc., BenevolentAI, BioXcel Therapeutics Inc., Charles River Laboratories, Deep Genomics Inc., DenovAI, Evotec SE, Exscientia plc, Generate Biomedicines, Iktos, Insilico Medicine, insitro, Isomorphic Labs, Schrodinger Inc., WuXi AppTec Co. Ltd. are a few of the key vendors in the AI In Drug Screening market.

North America will register the highest growth rate of 35.7% among the other regions. Therefore, the AI In Drug Screening market in North America is expected to garner significant business opportunities for the vendors during the forecast period.

US, Canada, Mexico, Germany, UK, France, The Netherlands, Spain, Italy, Russia, China, Japan, India, South Korea, Singapore, Indonesia, Thailand, Australia, Brazil, South Africa, UAE, Saudi Arabia, Turkey

  • Rising imperative to curtail drug discovery timelines and costs is the driving factor this market.

The AI In Drug Screening market vendors should focus on grabbing business opportunities from the Application segment as it accounted for the largest market share in the base year.