
AI In Financial Forecasting Market Size 2025-2029
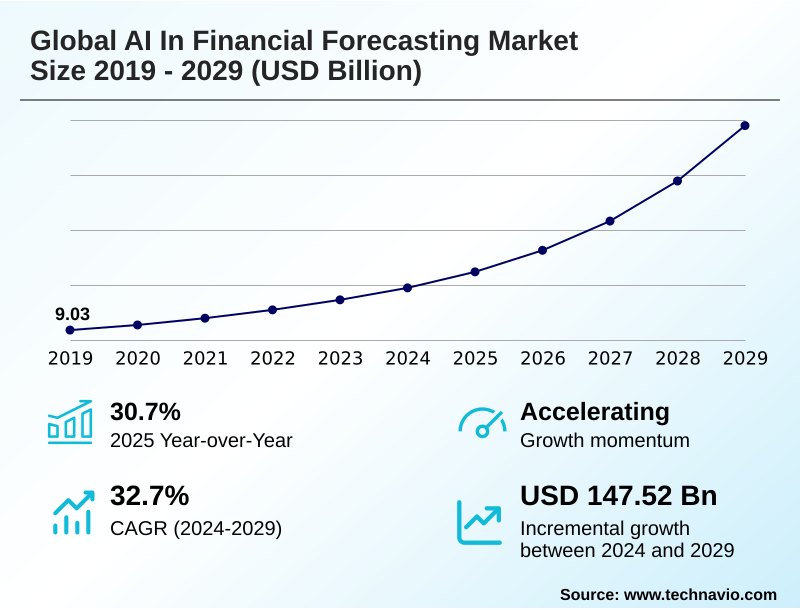
The ai in financial forecasting market size is valued to increase by USD 147.52 billion, at a CAGR of 32.7% from 2024 to 2029. Proliferation of big data and complex datasets will drive the ai in financial forecasting market.
Major Market Trends & Insights
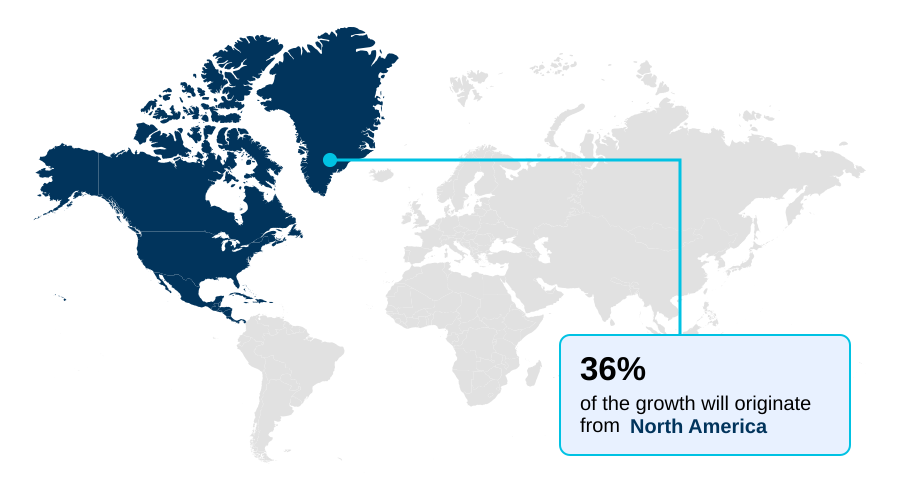
- North America dominated the market and accounted for a 36.1% growth during the forecast period.
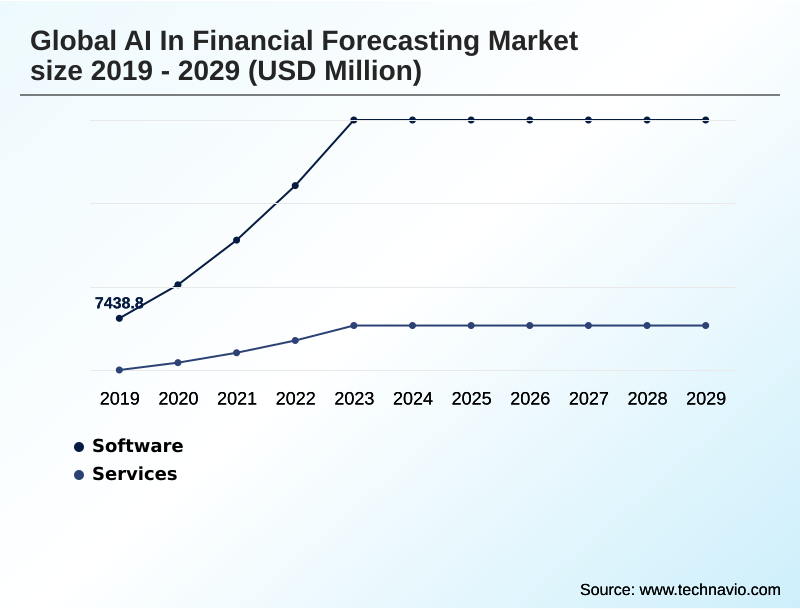
- By Component - Software segment was valued at USD 29.89 billion in 2023
- By Deployment - Cloud-based segment accounted for the largest market revenue share in 2023
Market Size & Forecast
- Market Opportunities: USD 185.88 billion
- Market Future Opportunities: USD 147.52 billion
- CAGR from 2024 to 2029 : 32.7%
Market Summary
- The AI in financial forecasting market is rapidly evolving beyond traditional statistical modeling, driven by the convergence of advanced computational power and immense data availability. This shift enables more dynamic, predictive, and adaptive forecasting methodologies. Financial institutions are progressively integrating artificial intelligence to automate complex analytical tasks, refine risk management protocols, and deliver highly personalized financial guidance.
- The ability of these systems to process and interpret vast streams of unstructured data, such as market news and economic reports, provides a more comprehensive and forward-looking perspective.
- For instance, a multinational corporation can leverage AI to analyze its global supply chain finances, using predictive modeling to anticipate currency fluctuations and scenario simulation to stress-test its cash flow against potential disruptions. This proactive approach improves financial risk management and strategic planning.
- Key market trends include the rise of explainable AI (XAI) to address model opacity and the integration of generative AI for advanced scenario analysis. However, challenges such as ensuring data quality and navigating a fragmented regulatory landscape, including varied AI governance frameworks, remain significant hurdles for widespread adoption. This transformation is cultivating a highly competitive and innovative market landscape.
What will be the Size of the AI In Financial Forecasting Market during the forecast period?
Get Key Insights on Market Forecast (PDF) Get Free Sample
How is the AI In Financial Forecasting Market Segmented?
The ai in financial forecasting industry research report provides comprehensive data (region-wise segment analysis), with forecasts and estimates in "USD million" for the period 2025-2029, as well as historical data from 2019-2023 for the following segments.
- Component
- Software
- Services
- Deployment
- Cloud-based
- On-premises
- End-user
- Large enterprises
- SMEs
- Startup
- Geography
- North America
- US
- Canada
- Mexico
- Europe
- Germany
- UK
- France
- APAC
- China
- Japan
- India
- South America
- Brazil
- Argentina
- Colombia
- Middle East and Africa
- Saudi Arabia
- UAE
- South Africa
- Rest of World (ROW)
- North America
By Component Insights
The software segment is estimated to witness significant growth during the forecast period.
The software segment is the core technological enabler, defined by platforms that embed predictive analytics into financial operations. Innovation is centered on improving asset performance forecasting and cash flow modeling through sophisticated credit risk modeling.
Modern solutions focus on driver-based planning and automated variance analysis, moving beyond static spreadsheets. Leading FP&A platforms now incorporate explainable AI (XAI) to build trust and meet regulatory technology needs.
Adoption is widespread, with over half of finance teams now utilizing AI, achieving a 20% improvement in forecast accuracy.
This shift is supported by tools for corporate performance management that enable hyper-personalization of financial services while using privacy-enhancing technologies and federated learning to protect data, transforming financial risk management and automated bookkeeping.
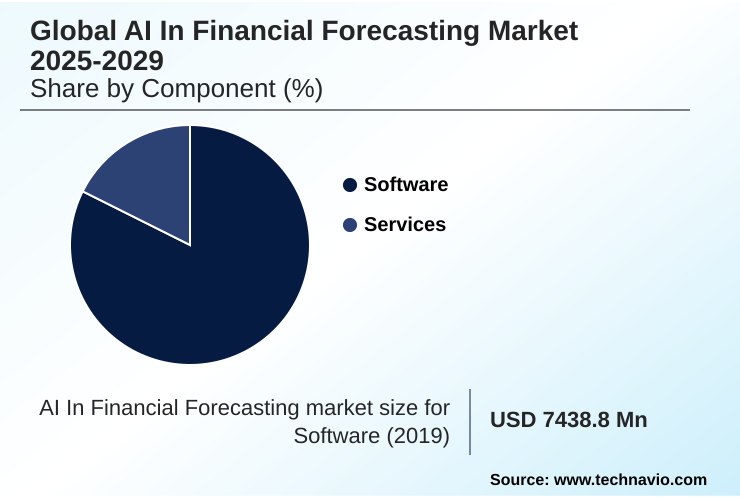
The Software segment was valued at USD 29.89 billion in 2023 and showed a gradual increase during the forecast period.
Regional Analysis
North America is estimated to contribute 36.1% to the growth of the global market during the forecast period.Technavio’s analysts have elaborately explained the regional trends and drivers that shape the market during the forecast period.
See How AI In Financial Forecasting Market Demand is Rising in North America Get Free Sample
North America is the dominant region, accounting for 36% of the market's incremental growth, driven by its advanced technology infrastructure and significant investments in AI.
The region leads in deploying AI for fraud detection and risk assessment models, with adoption among finance teams surging to 58%.
Europe is another significant market, where regulatory frameworks are shaping the development of auditable systems for treasury management and working capital optimization, and stress testing reports generation.
The APAC region is the fastest-growing market, with a CAGR of 34.1%, fueled by rapid digitalization and a burgeoning fintech ecosystem that leverages lending platforms and AI-powered chatbots for financial inclusion.
This growth is supported by AI innovation hub initiatives and the adoption of market intelligence platform and customer relationship management tools that facilitate continuous planning and sentiment analysis.
Market Dynamics
Our researchers analyzed the data with 2024 as the base year, along with the key drivers, trends, and challenges. A holistic analysis of drivers will help companies refine their marketing strategies to gain a competitive advantage.
- The strategic adoption of AI for cash flow forecasting is becoming a critical differentiator for businesses seeking to enhance financial resilience. The implementation of machine learning in credit scoring is fundamentally reshaping lending decisions, often leading to a significant reduction in default rates compared to traditional underwriting methods.
- Simultaneously, the use of generative AI for financial stress testing enables institutions to simulate complex market shocks with greater granularity, improving risk preparedness. A key trend is the demand for explainable AI in wealth management, which builds client trust by providing clear rationale for automated investment advice.
- Operationally, automated variance analysis with AI streamlines reporting cycles, freeing up finance teams for strategic tasks. Businesses also leverage predictive analytics for asset performance to optimize maintenance schedules and capital allocation. The application of using NLP for market sentiment analysis provides an edge in predicting market movements.
- For compliance, the adoption of AI-driven regulatory compliance reporting is essential, alongside AI-based regulatory technology solutions. Firms are increasingly turning to deep learning for algorithmic trading strategies to capitalize on market inefficiencies. The integration of AI platforms for corporate performance management unifies these capabilities.
- This evolution is further supported by intelligent process automation in finance and the move toward hyper-personalization of financial services. Solutions for AI for accounts payable automation and AI-powered spend management solutions drive back-office efficiency, while robotic process automation for bookkeeping reduces manual errors.
- The adoption of cloud-native BI for financial reporting centralizes insights, and predictive modeling for revenue forecasting, coupled with fraud detection using AI algorithms and algorithmic trading risk management, creates a robust financial ecosystem.
What are the key market drivers leading to the rise in the adoption of AI In Financial Forecasting Industry?
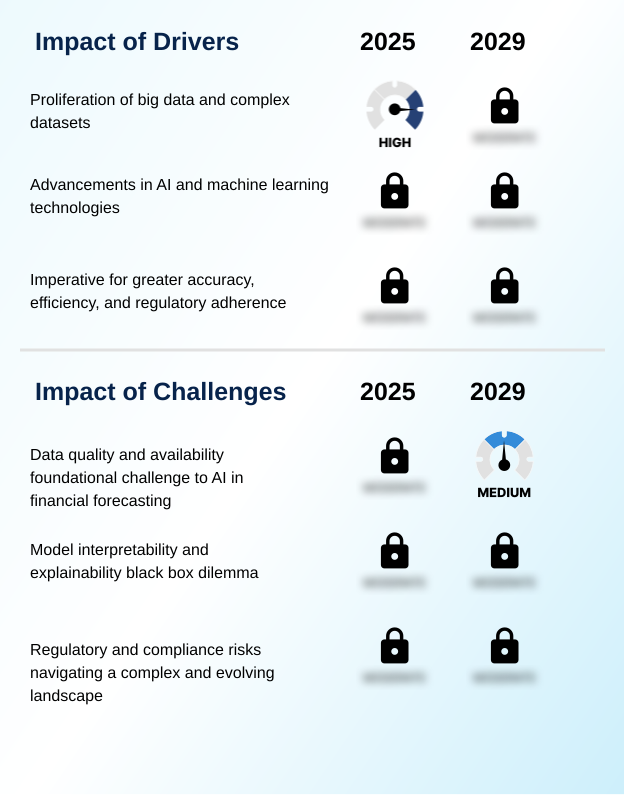
- The proliferation of big data and complex datasets is a key driver for the market, creating an imperative for advanced analytical capabilities.
- Market growth is driven by the relentless advancement in AI technologies and the imperative for greater accuracy.
- Innovations in algorithmic trading strategies and portfolio optimization are enabling firms to achieve higher returns, with some reporting a 5% increase in alpha generation. The proliferation of big data necessitates sophisticated tools for sentiment analysis and market abuse surveillance.
- The demand for operational efficiency is fueling the adoption of AI-native FP&A solutions that support continuous planning and enhance treasury management.
- These systems, often integrated into a financial management suite or enterprise resource planning infrastructure via data integration platforms, automate complex tasks.
- The accessibility of these tools through cloud-native BI has democratized advanced analytics, allowing more firms to leverage synthetic data generation for robust model training.
What are the market trends shaping the AI In Financial Forecasting Industry?
- The trend toward hyper-personalization of financial forecasting and services is reshaping customer expectations. It compels financial providers to innovate with bespoke advisory services.
- Key market trends are reshaping customer expectations and operational models. The move towards hyper-personalization is prominent, with financial institutions leveraging AI to deliver tailored services, resulting in a 15% uplift in customer engagement.
- Concurrently, the increasing complexity of models has spurred demand for explainable AI (XAI) to ensure model interpretability and algorithmic fairness, a crucial component of modern AI governance frameworks. The integration of generative AI is enabling advanced scenario analysis and improving corporate performance management.
- These trends are supported by intelligent process automation and robotic process automation, which streamline back-office functions like accounts payable automation. Firms using AI-powered insights for fraud detection have reported a 20% improvement in accuracy, showcasing the technology's impact on security and trust.
What challenges does the AI In Financial Forecasting Industry face during its growth?
- The foundational challenge of ensuring data quality and availability for AI in financial forecasting is a key factor affecting industry growth.
- Despite strong growth drivers, the market faces significant challenges. Data quality remains a primary hurdle, with over 60% of firms in some regions citing it as a major barrier to successful predictive modeling. The 'black box' nature of complex machine learning algorithms and deep learning neural networks creates issues with transparency and regulatory compliance, particularly for credit underwriting solutions.
- Navigating the fragmented and evolving regulatory landscape is another key challenge, demanding robust IT management software and governance. The effective use of natural language processing and generative adversarial networks is contingent on high-quality training data, which is often siloed in legacy systems. Implementing real-time data streams for anomaly detection requires significant infrastructure investment, which can be prohibitive for smaller organizations.
Exclusive Technavio Analysis on Customer Landscape
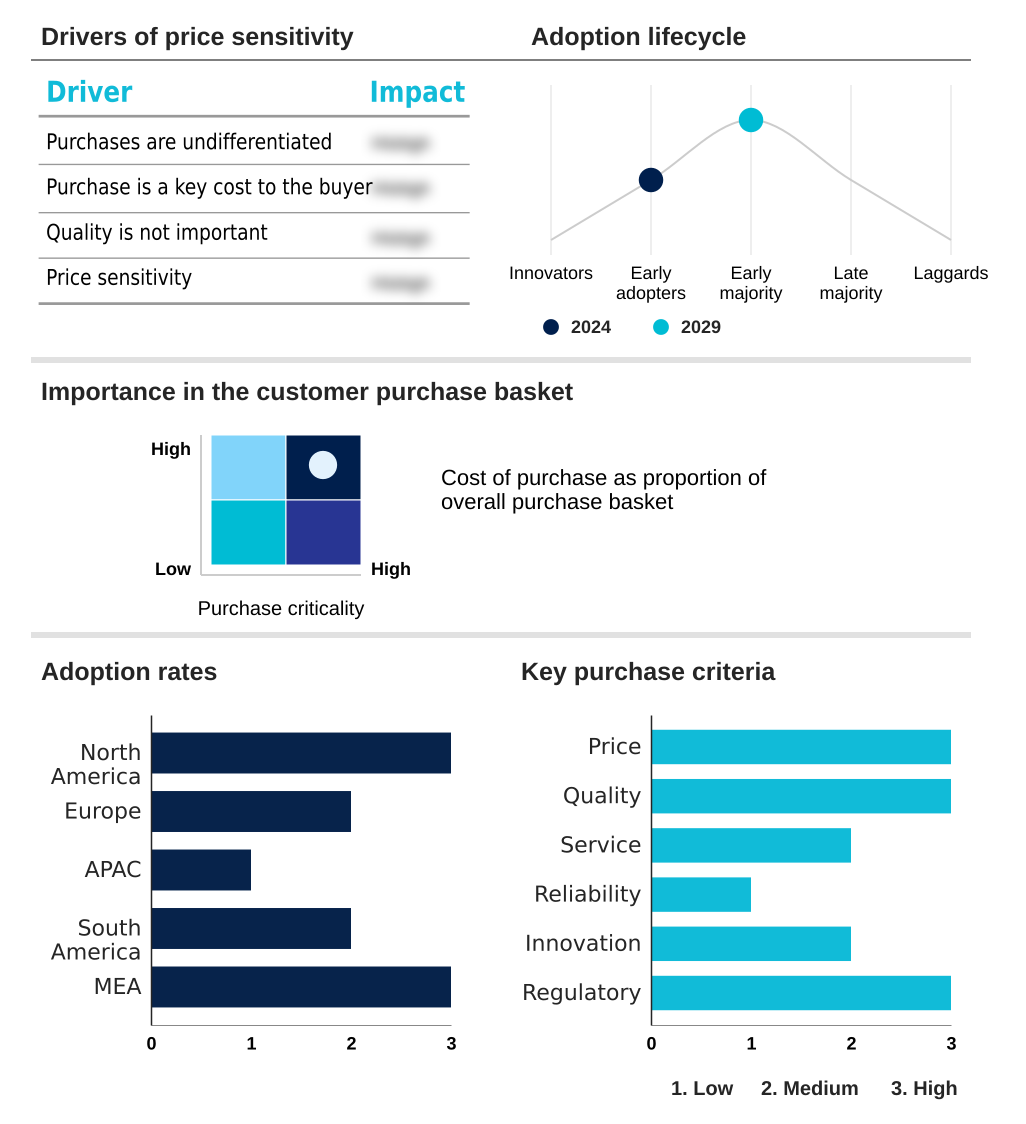
The ai in financial forecasting market forecasting report includes the adoption lifecycle of the market, covering from the innovator’s stage to the laggard’s stage. It focuses on adoption rates in different regions based on penetration. Furthermore, the ai in financial forecasting market report also includes key purchase criteria and drivers of price sensitivity to help companies evaluate and develop their market growth analysis strategies.
Customer Landscape of AI In Financial Forecasting Industry
Competitive Landscape
Companies are implementing various strategies, such as strategic alliances, ai in financial forecasting market forecast, partnerships, mergers and acquisitions, geographical expansion, and product/service launches, to enhance their presence in the industry.
Access Workspace Australia Pty Ltd. - Analysts highlight the Connected Planning platform's role in advancing financial forecasting, using machine learning to enable dynamic outcome simulation and anomaly detection for optimized strategies.
The industry research and growth report includes detailed analyses of the competitive landscape of the market and information about key companies, including:
- Access Workspace Australia Pty Ltd.
- AlphaSense Inc.
- Anaplan Inc.
- Botkeeper Inc.
- Cube Planning Inc.
- Datarails Inc.
- Domo Inc.
- IBM Corp.
- Intuit Inc.
- Lithasa Technologies Pvt. Ltd.
- Planful Inc.
- Prophix Software Inc.
- Quantivate LLC.
- Spindle Technologies Inc.
- Tipalti Inc.
- Vena Solutions Inc.
- Workday Inc.
- ZestFinance Inc.
Qualitative and quantitative analysis of companies has been conducted to help clients understand the wider business environment as well as the strengths and weaknesses of key industry players. Data is qualitatively analyzed to categorize companies as pure play, category-focused, industry-focused, and diversified; it is quantitatively analyzed to categorize companies as dominant, leading, strong, tentative, and weak.
Recent Development and News in Ai in financial forecasting market
- In August 2024, Germany's Federal Financial Supervisory Authority (BaFin) published new guidance addressing algorithmic fairness and the prevention of discrimination in AI systems used in finance.
- In September 2024, South Korea’s Financial Services Commission (FSC) approved the use of generative AI and cloud computing for financial firms, aiming to foster innovation and enhance operational efficiency.
- In December 2024, the U.S. Department of the Treasury released a report calling for federal financial regulators to clarify supervisory expectations regarding AI risk management, with an emphasis on model explainability.
- In March 2025, APMIC launched PrivStation, an on-premises AI platform designed for highly regulated sectors, including finance, to ensure data sovereignty and accelerate secure AI model development.
Dive into Technavio’s robust research methodology, blending expert interviews, extensive data synthesis, and validated models for unparalleled AI In Financial Forecasting Market insights. See full methodology.
| Market Scope | |
|---|---|
| Page number | 286 |
| Base year | 2024 |
| Historic period | 2019-2023 |
| Forecast period | 2025-2029 |
| Growth momentum & CAGR | Accelerate at a CAGR of 32.7% |
| Market growth 2025-2029 | USD 147521.0 million |
| Market structure | Fragmented |
| YoY growth 2024-2025(%) | 30.7% |
| Key countries | US, Canada, Mexico, Germany, UK, France, Italy, Spain, The Netherlands, China, Japan, India, South Korea, Australia, Indonesia, Brazil, Argentina, Colombia, Saudi Arabia, UAE, South Africa, Israel and Turkey |
| Competitive landscape | Leading Companies, Market Positioning of Companies, Competitive Strategies, and Industry Risks |
Research Analyst Overview
- The market is undergoing a significant transformation, moving from static analysis to dynamic predictive modeling. At the boardroom level, the trend toward advanced scenario simulation is influencing strategic capital allocation, allowing executives to test business resilience against market volatility. Firms are leveraging machine learning algorithms and deep learning neural networks to power these simulations.
- The adoption of natural language processing is unlocking insights from unstructured data for enhanced sentiment analysis, while generative adversarial networks enable robust synthetic data generation for training risk assessment models. This has resulted in tangible performance improvements, with some institutions achieving a 20% reduction in false positives for fraud detection.
- Core applications include financial risk management, credit risk modeling, and cash flow modeling, all supported by real-time data streams. The push for transparency is driving the need for model interpretability and strong AI governance frameworks. Operationally, tools for intelligent process automation, robotic process automation, data consolidation, and automated variance analysis are streamlining workflows.
- AI is also critical for regulatory technology, portfolio optimization, and developing algorithmic trading strategies to prevent market abuse surveillance. The emergence of AI-native FP&A facilitates continuous planning, driver-based planning, and better treasury management for working capital optimization, delivering superior asset performance forecasting and AI-powered insights through predictive analytics, all while ensuring algorithmic fairness in stress testing reports.
What are the Key Data Covered in this AI In Financial Forecasting Market Research and Growth Report?
-
What is the expected growth of the AI In Financial Forecasting Market between 2025 and 2029?
-
USD 147.52 billion, at a CAGR of 32.7%
-
-
What segmentation does the market report cover?
-
The report is segmented by Component (Software, and Services), Deployment (Cloud-based, and On-premises), End-user (Large enterprises, SMEs, and Startup) and Geography (North America, Europe, APAC, South America, Middle East and Africa)
-
-
Which regions are analyzed in the report?
-
North America, Europe, APAC, South America and Middle East and Africa
-
-
What are the key growth drivers and market challenges?
-
Proliferation of big data and complex datasets, Data quality and availability foundational challenge to AI in financial forecasting
-
-
Who are the major players in the AI In Financial Forecasting Market?
-
Access Workspace Australia Pty Ltd., AlphaSense Inc., Anaplan Inc., Botkeeper Inc., Cube Planning Inc., Datarails Inc., Domo Inc., IBM Corp., Intuit Inc., Lithasa Technologies Pvt. Ltd., Planful Inc., Prophix Software Inc., Quantivate LLC., Spindle Technologies Inc., Tipalti Inc., Vena Solutions Inc., Workday Inc. and ZestFinance Inc.
-
Market Research Insights
- The market is characterized by a rapid integration of intelligent systems into core financial workflows. FP&A platforms are evolving with AI-powered insights, with adoption rates among finance teams surging past 58% in some regions. This shift drives significant operational gains; for instance, automated bookkeeping and accounts payable automation reduce manual processing times by over 40%.
- The demand for explainable AI (XAI) is growing as firms deploy complex credit underwriting solutions. Enterprise resource planning systems are now frequently augmented by business intelligence tools and data integration platforms to support continuous planning. This ecosystem is enhanced by hyper-personalization delivered through AI-powered chatbots and robo-advisory services, leading to a 15% increase in customer engagement.
- The development of managed AI services and privacy-enhancing technologies further supports this dynamic landscape.
We can help! Our analysts can customize this ai in financial forecasting market research report to meet your requirements.
 RIA -
RIA - 
