
AI In Fraud Detection Market Size 2025-2029
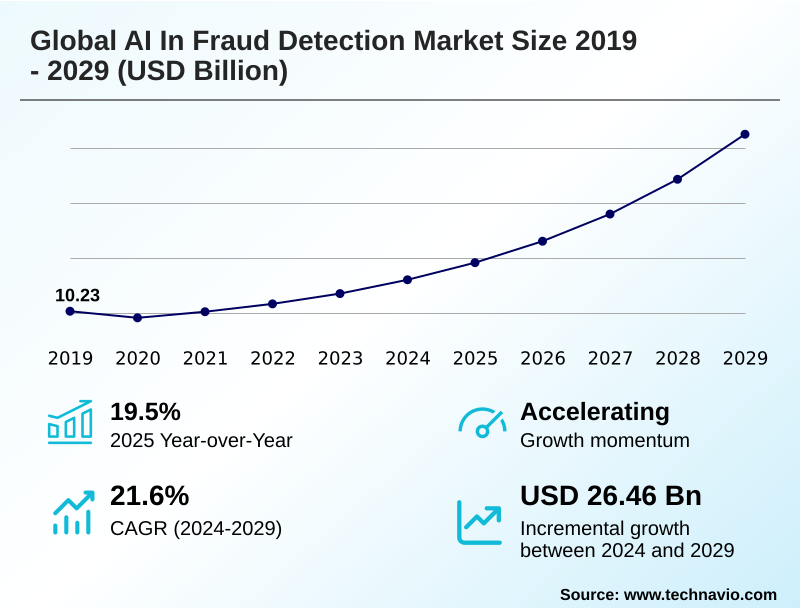
The ai in fraud detection market size is valued to increase by USD 26.46 billion, at a CAGR of 21.6% from 2024 to 2029. Escalating sophistication and proliferation of AI-powered fraud will drive the ai in fraud detection market.
Major Market Trends & Insights
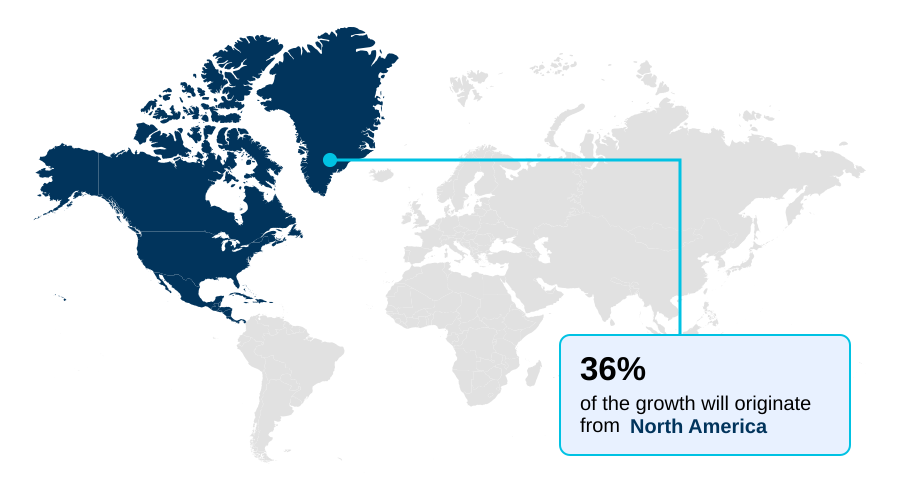
- North America dominated the market and accounted for a 36.5% growth during the forecast period.
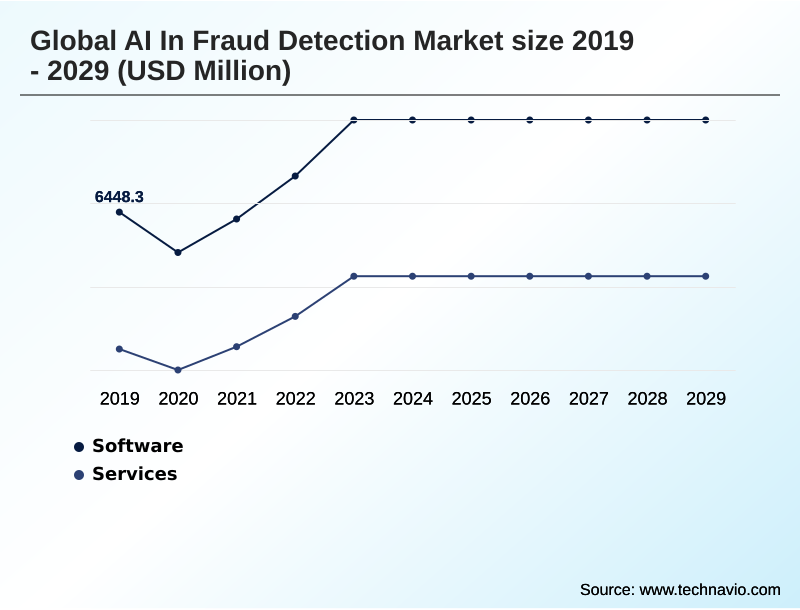
- By Component - Software segment was valued at USD 8.24 billion in 2023
- By Technology - Machine learning segment accounted for the largest market revenue share in 2023
Market Size & Forecast
- Market Opportunities: USD 32.19 billion
- Market Future Opportunities: USD 26.46 billion
- CAGR from 2024 to 2029 : 21.6%
Market Summary
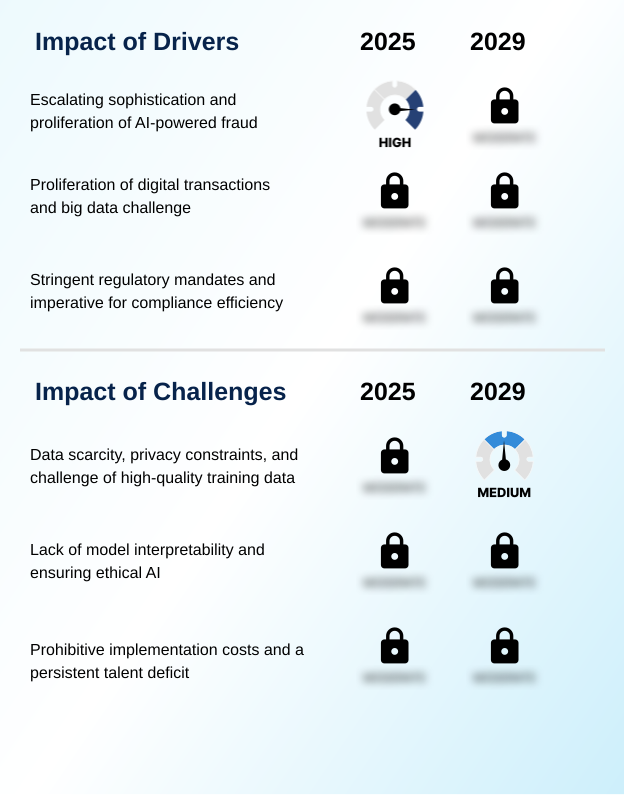
- The AI in fraud detection market is driven by the critical need for organizations to defend against increasingly sophisticated and automated financial crimes. Legacy rule-based systems are no longer sufficient to counter threats orchestrated with advanced technology, compelling a shift toward dynamic, AI-powered defenses.
- Key drivers include the exponential growth of digital transactions and big data, which creates a vast landscape for fraudulent activity that can only be monitored effectively through automation. Trends such as the dual-edged sword of generative AI are reshaping risk models, as criminals leverage it for synthetic identity fraud while defenders use synthetic data generation for robust model training.
- Technologies like machine learning models and deep learning algorithms are central, enabling real-time transaction scoring and anomaly detection. For instance, a financial institution can deploy behavioral biometrics to analyze user interaction patterns, successfully thwarting an account takeover prevention attempt even if the fraudster has the correct credentials.
- However, the market faces challenges related to data privacy, prohibitive implementation costs, and the persistent need for explainable AI to meet stringent regulatory requirements for model interpretability.
What will be the Size of the AI In Fraud Detection Market during the forecast period?
Get Key Insights on Market Forecast (PDF) Get Free Sample
How is the AI In Fraud Detection Market Segmented?
The ai in fraud detection industry research report provides comprehensive data (region-wise segment analysis), with forecasts and estimates in "USD million" for the period 2025-2029, as well as historical data from 2019-2023 for the following segments.
- Component
- Software
- Services
- Technology
- Machine learning
- Deep learning
- NLP
- Others
- Application
- Payment fraud
- Anti-money laundering
- Identity fraud
- Insurance fraud
- Others
- Geography
- North America
- US
- Canada
- Mexico
- Europe
- UK
- Germany
- France
- APAC
- China
- India
- Japan
- Middle East and Africa
- UAE
- Saudi Arabia
- South Africa
- South America
- Brazil
- Argentina
- Colombia
- Rest of World (ROW)
- North America
By Component Insights
The software segment is estimated to witness significant growth during the forecast period.
The software segment is the core of the market, characterized by end-to-end platforms that automate fraud identification. Innovation is focused on integrating advanced AI sub-disciplines, including unsupervised learning for detecting novel threats and graph analytics for uncovering collusive fraud rings.
computer vision and biometric verification are now standard for onboarding, leveraging digital identity intelligence for robust account takeover prevention. These systems enhance security in procurement fraud detection and invoice fraud analysis by identifying anomalous patterns in transactional data.
Adopters of these platforms report a chargeback fraud reduction of over 15% within the first year, demonstrating a clear return on investment by moving beyond static, rule-based engines to more adaptive defense mechanisms.
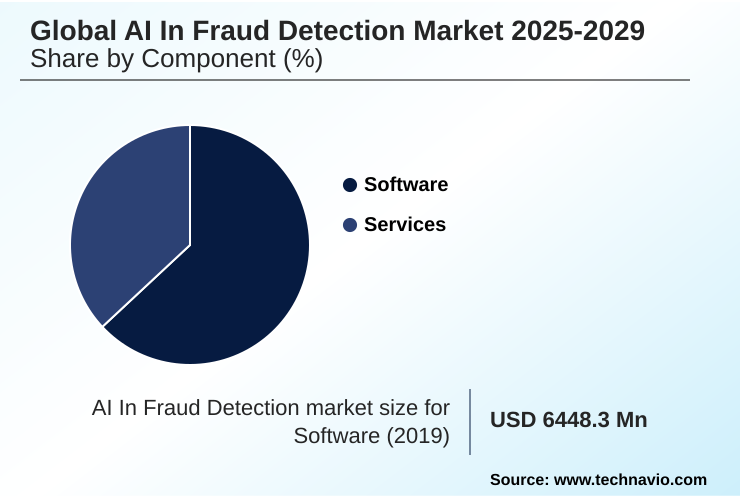
The Software segment was valued at USD 8.24 billion in 2023 and showed a gradual increase during the forecast period.
Regional Analysis
North America is estimated to contribute 36.5% to the growth of the global market during the forecast period.Technavio’s analysts have elaborately explained the regional trends and drivers that shape the market during the forecast period.
See How AI In Fraud Detection Market Demand is Rising in North America Get Free Sample
North America is the dominant market region, contributing over 36% of the incremental growth, driven by its highly digitized economy and concentration of financial institutions.
Europe follows, with a market distinguished by a stringent regulatory focus on data privacy that propels demand for explainable AI. The APAC region is the fastest-growing market, fueled by explosive digitalization and mobile-first economies in countries like India and China.
In this region, natural language processing is increasingly used for tax evasion detection from unstructured financial reports.
behavioral biometrics are deployed for friendly fraud identification, while advanced anomaly detection and entity resolution techniques are crucial for trade finance fraud prevention in global hubs like Singapore, improving detection rates by over 20%.
Market Dynamics
Our researchers analyzed the data with 2024 as the base year, along with the key drivers, trends, and challenges. A holistic analysis of drivers will help companies refine their marketing strategies to gain a competitive advantage.
- The practical application of AI in fraud detection is becoming highly specialized. Financial institutions are refining ai models for credit card transaction fraud to operate with sub-second latency, directly impacting real-time fraud scoring in payment gateways.
- The complexity of deep learning applications in aml compliance is being addressed through explainable ai for regulatory reporting in finance, ensuring that decisions made by ai-powered anti-money laundering transaction monitoring systems are transparent and defensible.
- The generative ai impact on synthetic identity risk has made robust identity verification paramount, combining computer vision for identity document verification with liveness detection against deepfake spoofing. To combat internal and external threats, firms are focused on ai for detecting business email compromise attacks and preventing account takeover with behavioral analytics that leverage behavioral biometrics for continuous authentication.
- The use of nlp for insurance claims document analysis and machine learning models for preventing invoice fraud has streamlined investigations, with some insurers reporting a reduction in claim processing times that is twice as fast as manual methods. graph analytics for uncovering fraud rings and anomaly detection in real-time payment networks are now essential for identifying sophisticated, coordinated attacks.
- The development of synthetic data generation for model training and federated learning for cross-border fraud data addresses key data challenges, while a focus on reducing false positives in transaction monitoring improves operational efficiency.
- These targeted applications are also extending to newer financial products, with a growing need for solutions capable of securing buy now pay later services with ai and advanced ai techniques for identifying tax evasion schemes.
What are the key market drivers leading to the rise in the adoption of AI In Fraud Detection Industry?
- A primary driver for the market is the escalating sophistication and proliferation of fraudulent activities, which are increasingly orchestrated using AI itself.
- The accelerating shift to a digital-first economy necessitates the use of machine learning models capable of processing billions of events.
- The proliferation of real-time payment networks shrinks the fraud detection window to mere seconds, making AI-powered real-time transaction scoring an essential capability for real-time payment security.
- Advanced risk scoring engines leverage predictive analytics to provide in-stream payment fraud analysis, a critical tool for card-not-present fraud mitigation.
- These pattern recognition systems are crucial for effective social engineering attack defense, as they can identify anomalous user behaviors that indicate a compromised account.
- Organizations deploying such systems have reported a reduction in manual review times by up to 60%, showcasing a direct operational efficiency gain.
What are the market trends shaping the AI In Fraud Detection Industry?
- The market is undergoing a paradigm shift, driven by the dual-edged sword of generative AI, which both enables and combats sophisticated fraud.
- A key trend is the convergence of advanced technologies to create a multi-layered defense. The use of deep learning algorithms and generative adversarial networks is pivotal for both synthetic identity fraud creation and deepfake detection. This has led to the development of sophisticated liveness detection capabilities that analyze subtle user cues, improving verification accuracy by over 25%.
- network analysis is being combined with secure multi-party computation to trace illicit fund flows across different platforms without compromising data privacy. This integrated approach is also transforming insurance claims fraud analytics and enabling more robust know your customer automation, moving beyond siloed solutions toward a more resilient security architecture that can identify sophisticated criminal schemes.
What challenges does the AI In Fraud Detection Industry face during its growth?
- A formidable challenge is the persistent issue of data scarcity, privacy constraints, and the difficulty of acquiring high-quality, labeled training data.
- A primary challenge is the black box problem, where a lack of model interpretability hinders regulatory adherence, particularly for anti-money laundering compliance. The need for explainable AI is paramount, as regulators demand transparent justifications for automated decisions affecting customer due diligence. While techniques like synthetic data generation help address data scarcity, they add complexity.
- Furthermore, stringent data privacy rules limit data sharing, compelling firms to explore privacy-enhancing technologies and federated learning. These solutions, while promising for tasks like adverse media screening, are still maturing. This creates a difficult trade-off, as deploying the most accurate models can conflict with the need for transparency, which is critical for achieving significant false positive reduction.
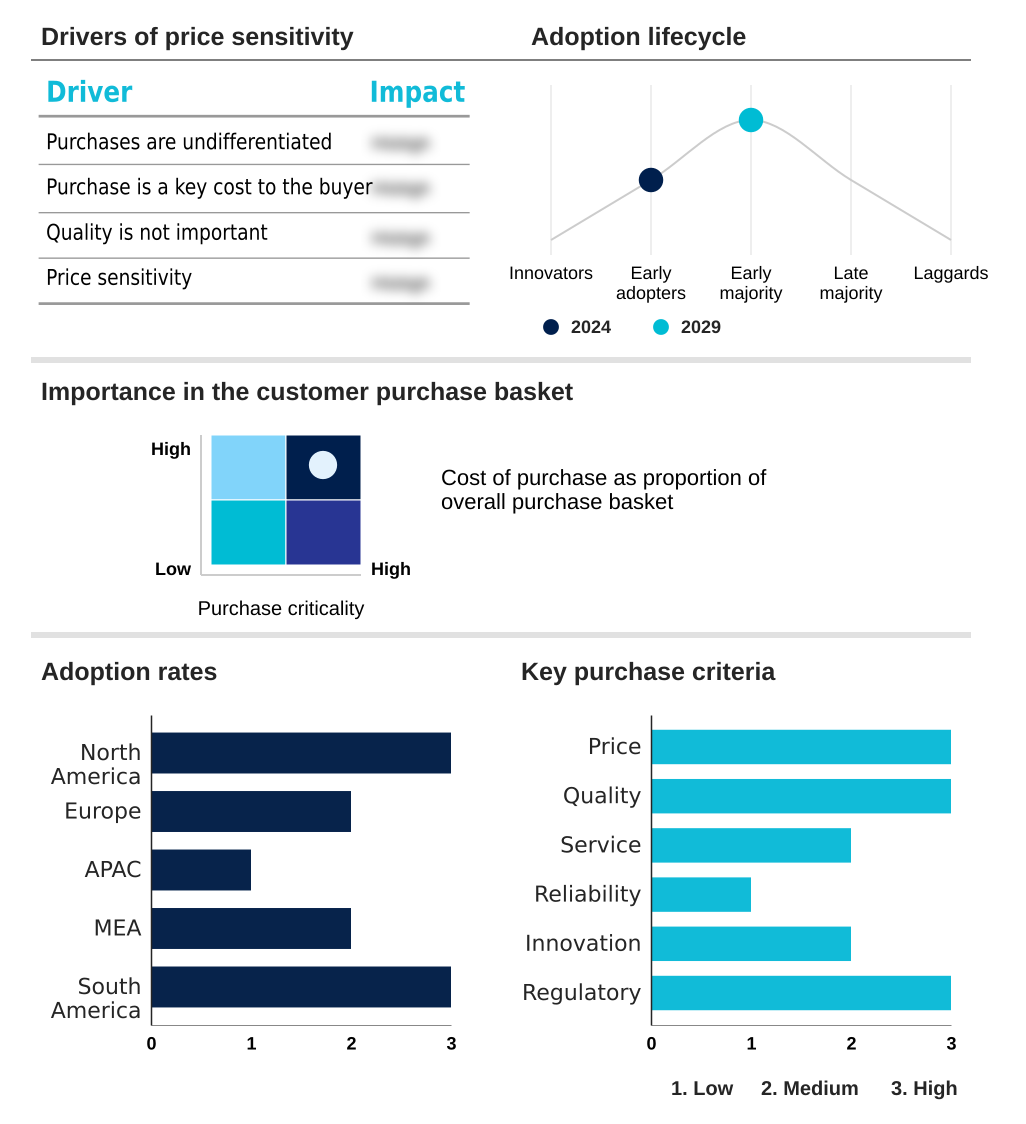
Exclusive Technavio Analysis on Customer Landscape
The ai in fraud detection market forecasting report includes the adoption lifecycle of the market, covering from the innovator’s stage to the laggard’s stage. It focuses on adoption rates in different regions based on penetration. Furthermore, the ai in fraud detection market report also includes key purchase criteria and drivers of price sensitivity to help companies evaluate and develop their market growth analysis strategies.
Customer Landscape of AI In Fraud Detection Industry
Competitive Landscape
Companies are implementing various strategies, such as strategic alliances, ai in fraud detection market forecast, partnerships, mergers and acquisitions, geographical expansion, and product/service launches, to enhance their presence in the industry.
ACI Worldwide Inc. - Offers real-time fraud and risk management solutions using a combination of machine learning, predictive analytics, and expert rules to identify and prevent payment fraud.
The industry research and growth report includes detailed analyses of the competitive landscape of the market and information about key companies, including:
- ACI Worldwide Inc.
- Amazon Web Services Inc.
- BAE Systems Plc
- Consultadoria e Inovacao Tecnologica S.A.
- Fair Isaac Corp.
- Fiserv Inc.
- Google Cloud
- IBM Corp.
- LexisNexis Risk Solutions.
- Microsoft Corp.
- Oracle Corp.
- RSA Security LLC
- SAS Institute Inc.
- Splunk Inc.
- SUBEX Ltd.
- Thales Group
- TransUnion
Qualitative and quantitative analysis of companies has been conducted to help clients understand the wider business environment as well as the strengths and weaknesses of key industry players. Data is qualitatively analyzed to categorize companies as pure play, category-focused, industry-focused, and diversified; it is quantitatively analyzed to categorize companies as dominant, leading, strong, tentative, and weak.
Recent Development and News in Ai in fraud detection market
- In August, 2024, SAS Institute Inc. announced the integration of advanced generative AI capabilities into its SAS Viya platform, designed to improve investigator productivity by over 30% and enhance the detection of complex financial crimes.
- In November, 2024, Consultadoria e Inovacao Tecnologica S.A. closed a USD 150 million Series E funding round to expand its RiskOps platform, focusing on enhancing its deep learning models for real-time payment fraud analysis and AML compliance.
- In March, 2025, Thales Group received EU AI Act compliance certification for its AI-powered identity verification solutions, which leverage liveness detection and document analysis to combat synthetic identity fraud.
- In May, 2025, ACI Worldwide Inc. and Microsoft Corp. announced a strategic partnership to integrate ACI's real-time fraud management solutions with Microsoft Azure's confidential computing services, enhancing data security for financial institutions.
Dive into Technavio’s robust research methodology, blending expert interviews, extensive data synthesis, and validated models for unparalleled AI In Fraud Detection Market insights. See full methodology.
| Market Scope | |
|---|---|
| Page number | 312 |
| Base year | 2024 |
| Historic period | 2019-2023 |
| Forecast period | 2025-2029 |
| Growth momentum & CAGR | Accelerate at a CAGR of 21.6% |
| Market growth 2025-2029 | USD 26464.7 million |
| Market structure | Fragmented |
| YoY growth 2024-2025(%) | 19.5% |
| Key countries | US, Canada, Mexico, UK, Germany, France, Italy, Spain, The Netherlands, China, India, Japan, South Korea, Australia, Indonesia, UAE, Saudi Arabia, South Africa, Israel, Turkey, Brazil, Argentina and Colombia |
| Competitive landscape | Leading Companies, Market Positioning of Companies, Competitive Strategies, and Industry Risks |
Research Analyst Overview
- The AI in fraud detection market is defined by a rapid evolution from static pattern recognition systems to adaptive security frameworks. At the core are machine learning models and deep learning algorithms that power real-time transaction scoring and predictive analytics.
- The integration of behavioral biometrics and biometric verification provides robust digital identity intelligence, while computer vision and liveness detection are crucial for secure onboarding. Boardroom decisions are increasingly influenced by the need for explainable AI to ensure model interpretability for regulators. Technologies like graph analytics and network analysis excel at uncovering complex fraud rings through advanced entity resolution.
- In response to data privacy constraints, firms are adopting federated learning, secure multi-party computation, and other privacy-enhancing technologies. The use of unsupervised learning for anomaly detection has enabled some organizations to identify novel threats 30% faster than with supervised methods.
- generative adversarial networks are also being used defensively for synthetic data generation, enhancing the resilience of risk scoring engines against new attack vectors.
What are the Key Data Covered in this AI In Fraud Detection Market Research and Growth Report?
-
What is the expected growth of the AI In Fraud Detection Market between 2025 and 2029?
-
USD 26.46 billion, at a CAGR of 21.6%
-
-
What segmentation does the market report cover?
-
The report is segmented by Component (Software, and Services), Technology (Machine learning, Deep learning, NLP, and Others), Application (Payment fraud, Anti-money laundering, Identity fraud, Insurance fraud, and Others) and Geography (North America, Europe, APAC, Middle East and Africa, South America)
-
-
Which regions are analyzed in the report?
-
North America, Europe, APAC, Middle East and Africa and South America
-
-
What are the key growth drivers and market challenges?
-
Escalating sophistication and proliferation of AI-powered fraud, Data scarcity, privacy constraints, and challenge of high-quality training data
-
-
Who are the major players in the AI In Fraud Detection Market?
-
ACI Worldwide Inc., Amazon Web Services Inc., BAE Systems Plc, Consultadoria e Inovacao Tecnologica S.A., Fair Isaac Corp., Fiserv Inc., Google Cloud, IBM Corp., LexisNexis Risk Solutions., Microsoft Corp., Oracle Corp., RSA Security LLC, SAS Institute Inc., Splunk Inc., SUBEX Ltd., Thales Group and TransUnion
-
Market Research Insights
- The market dynamics are shaped by an escalating technological arms race. AI is essential for anti-money laundering compliance and know your customer automation, where firms have achieved a false positive reduction of up to 70%, drastically improving operational efficiency. In e-commerce, sophisticated payment fraud analysis and card-not-present fraud mitigation are critical.
- The integration of AI for insurance claims fraud analytics has enabled insurers to identify organized fraud rings more effectively, reducing payout on fraudulent claims by over 15%. Advanced systems are also being deployed for social engineering attack defense and account takeover prevention.
- The need to secure emerging financial services is expanding AI's role into areas like trade finance fraud prevention and procurement fraud detection.
We can help! Our analysts can customize this ai in fraud detection market research report to meet your requirements.
 RIA -
RIA - 
