
Artificial Intelligence (AI) In Retail Sector Market Size 2025-2029
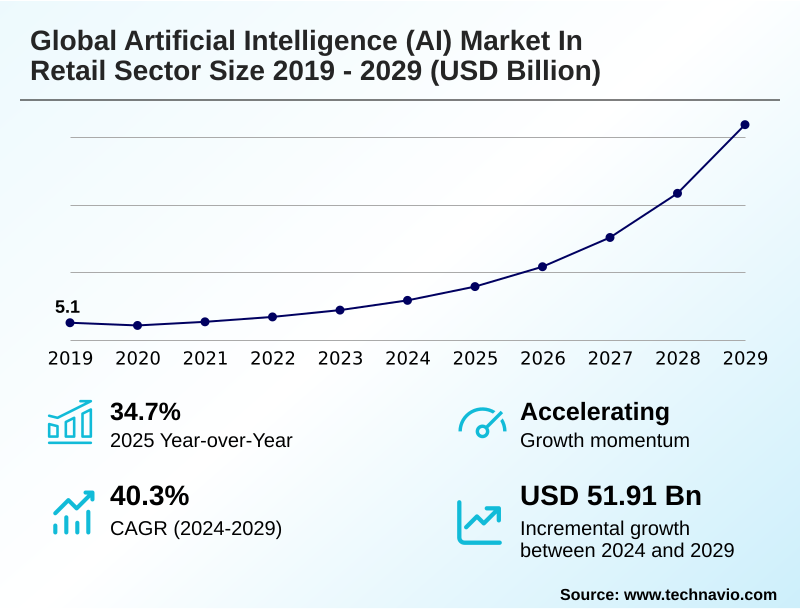
The artificial intelligence (ai) in retail sector market size is valued to increase by USD 51.91 billion, at a CAGR of 40.3% from 2024 to 2029. Rise in investments and research and development in AI startups will drive the artificial intelligence (ai) in retail sector market.
Major Market Trends & Insights
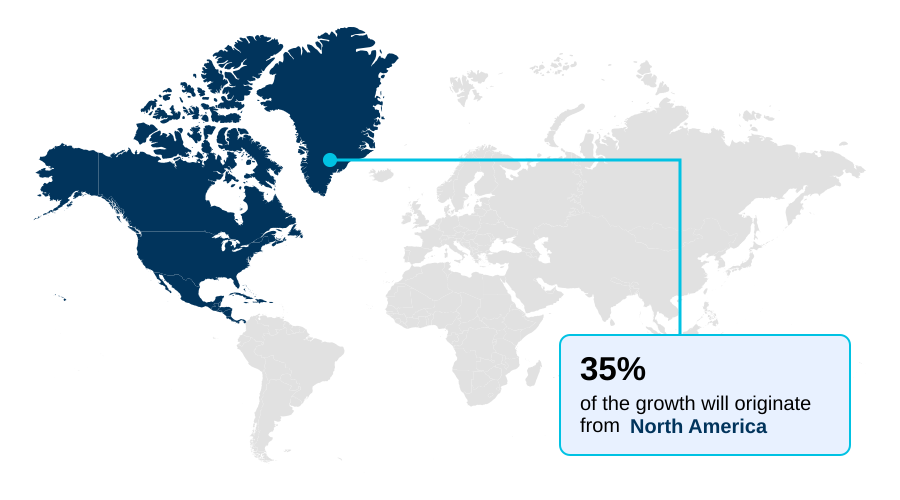
- North America dominated the market and accounted for a 35.1% growth during the forecast period.
- By Application - Sales and marketing segment was valued at USD 4.50 billion in 2023
- By Technology - Machine learning segment accounted for the largest market revenue share in 2023
Market Size & Forecast
- Market Opportunities: USD 58.52 billion
- Market Future Opportunities: USD 51.91 billion
- CAGR from 2024 to 2029 : 40.3%
Market Summary
- The artificial intelligence in retail sector market is undergoing a profound transformation, moving beyond basic automation to strategic integration. This evolution is driven by the dual imperatives of achieving extreme operational efficiency and delivering hyper-personalization at scale. Core technologies like machine learning are fundamental to optimizing complex processes, from predictive inventory management to end-to-end supply chain optimization.
- For example, a retailer can use AI to analyze real-time sales data, weather patterns, and local events to automatically adjust stock levels across hundreds of stores, minimizing waste and preventing lost sales. The recent emergence of generative AI has introduced a new paradigm, enabling creative and conversational applications that redefine customer engagement.
- However, the increasing sophistication of these systems, including the use of computer vision for in-store analytics, places a significant emphasis on the need for robust data governance frameworks to manage privacy and ensure ethical use, a challenge that is becoming as critical as the technology itself.
What will be the Size of the Artificial Intelligence (AI) In Retail Sector Market during the forecast period?
Get Key Insights on Market Forecast (PDF) Get Free Sample
How is the Artificial Intelligence (AI) In Retail Sector Market Segmented?
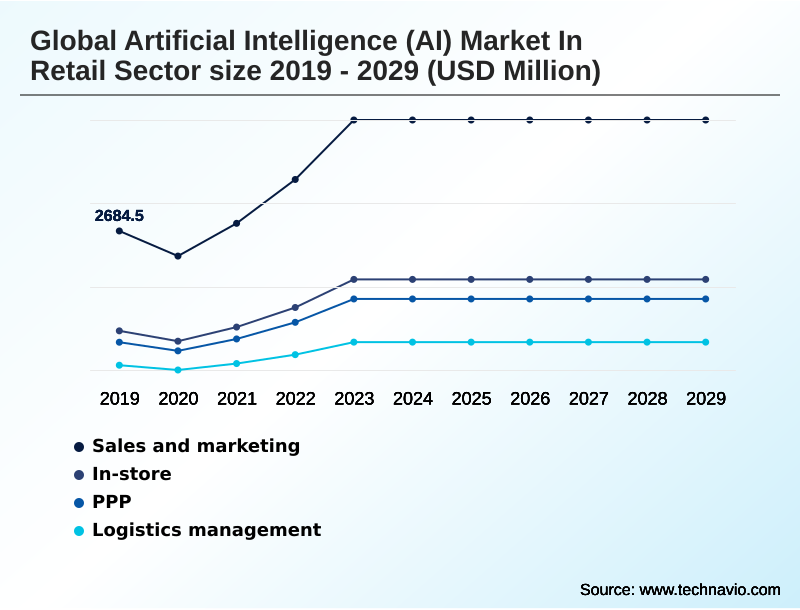
The artificial intelligence (ai) in retail sector industry research report provides comprehensive data (region-wise segment analysis), with forecasts and estimates in "USD million" for the period 2025-2029, as well as historical data from 2019-2023 for the following segments.
- Application
- Sales and marketing
- In-store
- PPP
- Logistics management
- Technology
- Machine learning
- Computer vision
- Natural language processing
- Deployment
- Cloud-based
- On-premises
- Geography
- North America
- US
- Canada
- Mexico
- APAC
- China
- Japan
- India
- Europe
- UK
- Germany
- France
- Middle East and Africa
- Saudi Arabia
- UAE
- South Africa
- South America
- Brazil
- Argentina
- Rest of World (ROW)
- North America
By Application Insights
The sales and marketing segment is estimated to witness significant growth during the forecast period.
The sales and marketing segment is being fundamentally reshaped by AI adoption, moving beyond traditional customer relationship management. Retailers are leveraging machine learning algorithms for deep customer profiling, enabling hyper-personalized marketing campaigns that significantly improve engagement.
AI-powered search and intelligent product discovery tools are enhancing the online shopping journey, while natural language processing is the engine behind sophisticated chatbot deployments and conversational commerce. These NLP for customer service chatbots provide 24/7 support, reducing response times.
The integration of AI-enhanced CRM systems and customer churn prediction models helps in retaining valuable customers, with some implementations showing a reduction in customer attrition by over 15%.
This strategic focus on AI for retail personalization is becoming a key competitive differentiator.
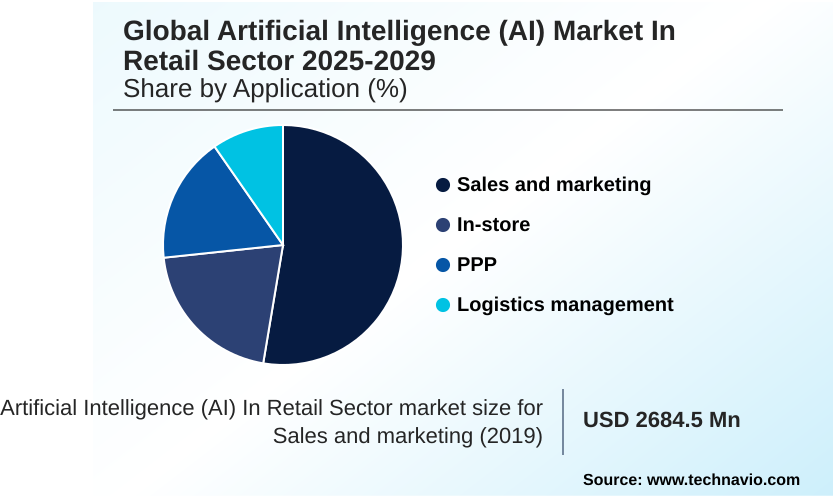
The Sales and marketing segment was valued at USD 4.50 billion in 2023 and showed a gradual increase during the forecast period.
Regional Analysis
North America is estimated to contribute 35.1% to the growth of the global market during the forecast period.Technavio’s analysts have elaborately explained the regional trends and drivers that shape the market during the forecast period.
See How Artificial Intelligence (AI) In Retail Sector Market Demand is Rising in North America Get Free Sample
The market landscape exhibits distinct regional dynamics. North America remains the largest market, accounting for 35.1% of the incremental growth, driven by mature adoption of omnichannel retail strategies and heavy investment in cloud-native AI platforms.
In this region, retailers utilize sentiment analysis from customer feedback and voice recognition powered by large language models for sophisticated customer interaction. In contrast, APAC is the fastest-growing region, with a projected CAGR of 44.8%.
This growth is fueled by mobile-first e-commerce and the adoption of AI for solving complex logistical challenges, including AI for last-mile delivery optimization.
European retailers focus on a unified commerce strategy while navigating stringent data regulations, applying AI for procurement planning and SKU rationalization to boost efficiency.
Market Dynamics
Our researchers analyzed the data with 2024 as the base year, along with the key drivers, trends, and challenges. A holistic analysis of drivers will help companies refine their marketing strategies to gain a competitive advantage.
- Understanding the AI impact on retail supply chains is crucial, as it encompasses multiple transformative technologies. The machine learning role in demand forecasting allows for unprecedented accuracy, which directly informs AI-driven assortment optimization and reduces waste. Inside the store, computer vision for shelf monitoring automates a labor-intensive task, ensuring product availability.
- This integration of back-end and front-end operations is key to a successful omnichannel retail strategy with AI. On the customer-facing side, the benefits of NLP chatbots in e-commerce include 24/7 support and instant query resolution, while generative AI product recommendations and visual search technology for e-commerce create engaging discovery experiences. These elements converge to build AI for hyper-personalized customer journeys.
- The pursuit of AI dynamic pricing competitive advantage and the intelligent automation for logistics management further enhance profitability. However, implementing these systems introduces challenges, particularly the AI data privacy challenges in retail and the need for clear data governance frameworks for retail AI.
- As retailers explore advanced concepts like autonomous checkout in grocery stores, understanding robotic process automation use cases retail and leveraging edge computing for in-store analytics become vital.
- The effective use of large language models for customer service, sentiment analysis for brand perception, and AI in procurement and planning separates market leaders from followers, with leaders often reporting margin improvements that are at least 10 percentage points higher than their peers.
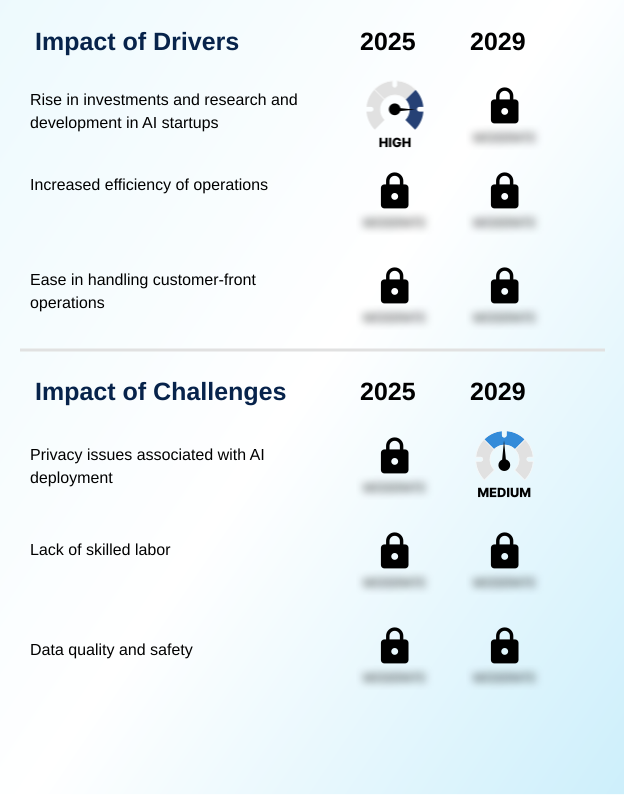
What are the key market drivers leading to the rise in the adoption of Artificial Intelligence (AI) In Retail Sector Industry?
- A significant driver for market growth is the surge in investments and dedicated research and development activities within artificial intelligence startups.
- The primary driver is the pursuit of operational efficiency through intelligent automation. Retailers are aggressively adopting AI-driven demand forecasting solutions that leverage predictive analytics to improve accuracy, cutting stockouts by up to 20%.
- Supply chain optimization and optimizing retail logistics with AI are critical, with machine learning in supply chain models reducing transit costs by 15%. Automated inventory management systems and robotic process automation streamline logistics management and back-office functions.
- Deploying intelligent retail automation tools for RPA in retail back-office operations has been shown to increase departmental productivity by over 40% by automating repetitive tasks like order processing and invoice matching.
What are the market trends shaping the Artificial Intelligence (AI) In Retail Sector Industry?
- The expanding integration of artificial intelligence within e-commerce platforms is a prominent market trend, transforming online retail through enhanced personalization, intelligent search, and automated customer interactions.
- A pivotal market trend is the fusion of online and offline retail through advanced AI. Generative AI in e-commerce platforms is revolutionizing AI-driven visual merchandising and product discovery, with deep learning-powered recommendation engine systems boosting cross-sell revenue by up to 25%.
- In physical stores, edge computing facilitates edge AI for real-time analytics and real-time in-store customer tracking, providing insights previously only available online. The use of computer vision for in-store analytics improves layout optimization and understands shopper behavior, enhancing accuracy by over 30%.
- Furthermore, AI-powered recommendation platforms and visual search capabilities are being integrated into mobile apps to create a seamless journey between the digital and physical aisles.
What challenges does the Artificial Intelligence (AI) In Retail Sector Industry face during its growth?
- Concerns regarding data privacy associated with the deployment of artificial intelligence systems present a significant challenge to industry growth.
- Despite the benefits, significant implementation challenges persist. The high cost of deploying complex systems like autonomous checkout for frictionless shopping experiences can be a major barrier. Ensuring robust data governance and adopting privacy-preserving AI techniques are critical for ethically-aligned AI deployment, especially with extensive data mining.
- The quality of data is paramount; models for shelf monitoring or assortment rationalization can see their effectiveness degraded by over 30% when trained on incomplete or biased data.
- Moreover, integrating AI with legacy systems for functions like AI-based procurement automation or AI for loss prevention proves complex and costly, sometimes doubling initial project timelines and requiring specialized talent that remains scarce.
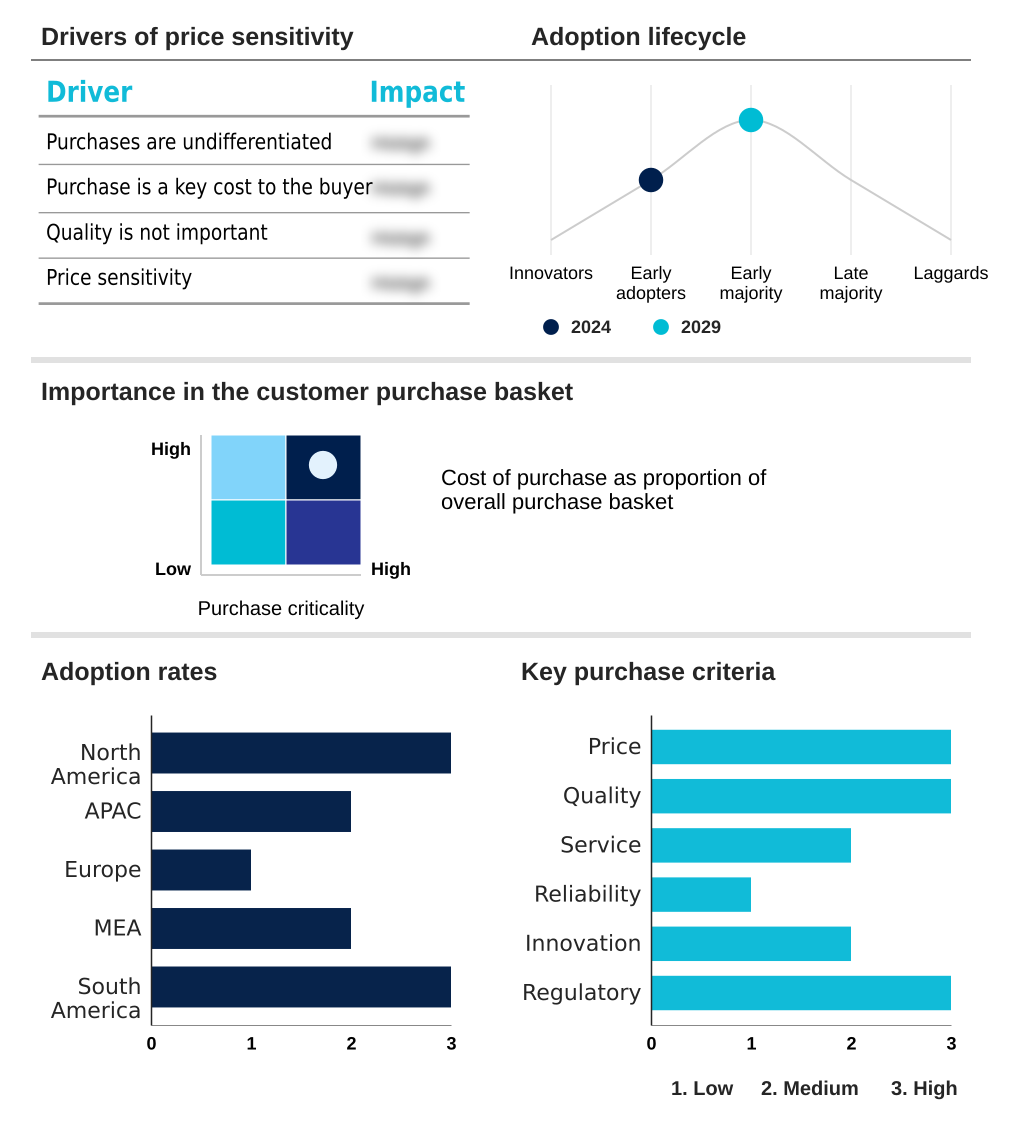
Exclusive Technavio Analysis on Customer Landscape
The artificial intelligence (ai) in retail sector market forecasting report includes the adoption lifecycle of the market, covering from the innovator’s stage to the laggard’s stage. It focuses on adoption rates in different regions based on penetration. Furthermore, the artificial intelligence (ai) in retail sector market report also includes key purchase criteria and drivers of price sensitivity to help companies evaluate and develop their market growth analysis strategies.
Customer Landscape of Artificial Intelligence (AI) In Retail Sector Industry
Competitive Landscape
Companies are implementing various strategies, such as strategic alliances, artificial intelligence (ai) in retail sector market forecast, partnerships, mergers and acquisitions, geographical expansion, and product/service launches, to enhance their presence in the industry.
Accenture PLC - Offers retail Artificial Intelligence solutions focused on customer revenue growth, dynamic merchandising, and supply network analytics to enhance overall profitability.
The industry research and growth report includes detailed analyses of the competitive landscape of the market and information about key companies, including:
- Accenture PLC
- Amazon Web Services Inc.
- BloomReach Inc.
- Capgemini Service SAS
- Daisy Intelligence Corp.
- Evolv Technology Solutions Inc.
- Inbenta Holdings Inc.
- Infosys Ltd.
- Intel Corp.
- IBM Corp.
- Mad Street Den Inc.
- Microsoft Corp.
- NVIDIA Corp.
- Oracle Corp.
- Punchh Inc.
- Salesforce Inc.
- SAP SE
- Symphony Retail Solutions
- Trax Technology Solutions Pte. Ltd.
Qualitative and quantitative analysis of companies has been conducted to help clients understand the wider business environment as well as the strengths and weaknesses of key industry players. Data is qualitatively analyzed to categorize companies as pure play, category-focused, industry-focused, and diversified; it is quantitatively analyzed to categorize companies as dominant, leading, strong, tentative, and weak.
Recent Development and News in Artificial intelligence (ai) in retail sector market
- In January 2025, OmniRetail Corp. launched a generative AI-powered shopping assistant designed to provide hyper-personalized product recommendations and styling advice across its digital platforms.
- In November 2024, Vision Systems Inc. announced a strategic partnership with Global Grocers to deploy its edge computing and computer vision platform for autonomous checkout in 50 pilot stores.
- In September 2024, LogiAI Solutions acquired supply chain optimization startup PredictiFlow, integrating its machine learning-based demand forecasting technology to enhance its logistics platform.
- In March 2025, The Retail Technology Consortium released its 'Framework for Ethical AI in Commerce,' providing guidelines on data privacy and algorithmic transparency for retailers.
Dive into Technavio’s robust research methodology, blending expert interviews, extensive data synthesis, and validated models for unparalleled Artificial Intelligence (AI) In Retail Sector Market insights. See full methodology.
| Market Scope | |
|---|---|
| Page number | 307 |
| Base year | 2024 |
| Historic period | 2019-2023 |
| Forecast period | 2025-2029 |
| Growth momentum & CAGR | Accelerate at a CAGR of 40.3% |
| Market growth 2025-2029 | USD 51905.5 million |
| Market structure | Fragmented |
| YoY growth 2024-2025(%) | 34.7% |
| Key countries | US, Canada, Mexico, China, Japan, India, South Korea, Australia, Indonesia, UK, Germany, France, Italy, Spain, The Netherlands, Saudi Arabia, UAE, South Africa, Egypt, Nigeria, Brazil, Argentina and Chile |
| Competitive landscape | Leading Companies, Market Positioning of Companies, Competitive Strategies, and Industry Risks |
Research Analyst Overview
- The artificial intelligence in retail sector market is driven by a strategic imperative for businesses to achieve hyper-personalization and unprecedented operational efficiency. Boardroom decisions now center on leveraging a suite of technologies, including machine learning, deep learning, and predictive analytics, to gain a competitive edge.
- The deployment of generative AI and sophisticated large language models is reshaping customer relationship management, powering advanced chatbot systems and enabling true conversational commerce. In physical stores, computer vision is critical for in-store analytics, shelf monitoring, and enabling autonomous checkout for a frictionless checkout experience.
- This intelligent automation extends to back-end operations, where robotic process automation transforms supply chain optimization, inventory management, and logistics management. Core applications like demand forecasting, dynamic pricing, and assortment rationalization are achieving new levels of precision. By using data mining and sentiment analysis, retailers create detailed customer profiling to refine their omnichannel retail strategy.
- Technology such as AI-powered search and visual search enhance product discovery, while edge computing allows for real-time processing. Adherence to data governance in procurement planning and SKU rationalization is paramount, with successful implementations reporting a 25% improvement in forecast accuracy.
What are the Key Data Covered in this Artificial Intelligence (AI) In Retail Sector Market Research and Growth Report?
-
What is the expected growth of the Artificial Intelligence (AI) In Retail Sector Market between 2025 and 2029?
-
USD 51.91 billion, at a CAGR of 40.3%
-
-
What segmentation does the market report cover?
-
The report is segmented by Application (Sales and marketing, In-store, PPP, and Logistics management), Technology (Machine learning, Computer vision, and Natural language processing), Deployment (Cloud-based, and On-premises) and Geography (North America, APAC, Europe, Middle East and Africa, South America)
-
-
Which regions are analyzed in the report?
-
North America, APAC, Europe, Middle East and Africa and South America
-
-
What are the key growth drivers and market challenges?
-
Rise in investments and research and development in AI startups, Privacy issues associated with AI deployment
-
-
Who are the major players in the Artificial Intelligence (AI) In Retail Sector Market?
-
Accenture PLC, Amazon Web Services Inc., BloomReach Inc., Capgemini Service SAS, Daisy Intelligence Corp., Evolv Technology Solutions Inc., Inbenta Holdings Inc., Infosys Ltd., Intel Corp., IBM Corp., Mad Street Den Inc., Microsoft Corp., NVIDIA Corp., Oracle Corp., Punchh Inc., Salesforce Inc., SAP SE, Symphony Retail Solutions and Trax Technology Solutions Pte. Ltd.
-
Market Research Insights
- The market's dynamism is defined by the measurable impact of AI on core retail functions. The adoption of AI for retail personalization has demonstrated an ability to increase customer lifetime value by over 20%. In operations, machine learning in supply chain applications and automated inventory management systems are crucial, with some firms achieving a 15% reduction in carrying costs.
- AI-driven demand forecasting solutions consistently outperform traditional methods, improving accuracy by more than 25%. Concurrently, NLP for customer service chatbots are resolving up to 70% of routine customer inquiries without human intervention, enhancing service efficiency. The use of dynamic pricing algorithms retail also allows for real-time adjustments, maximizing margins in highly competitive environments.
We can help! Our analysts can customize this artificial intelligence (ai) in retail sector market research report to meet your requirements.
 RIA -
RIA - 
