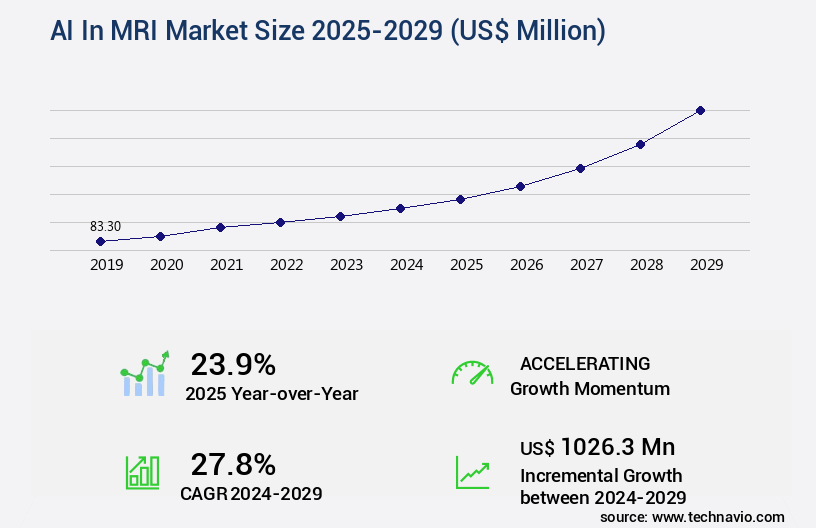
AI In MRI Market Size 2025-2029
The AI in MRI market size is valued to increase by USD 1.03 billion, at a CAGR of 27.8% from 2024 to 2029. Increasing pressure on radiology departments and workforce shortages will drive the ai in mri market.
Major Market Trends & Insights
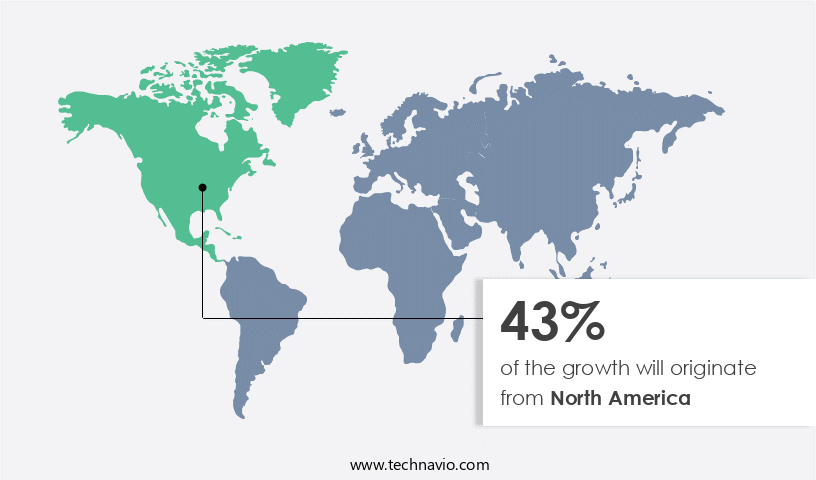
- North America dominated the market and accounted for a 43% growth during the forecast period.
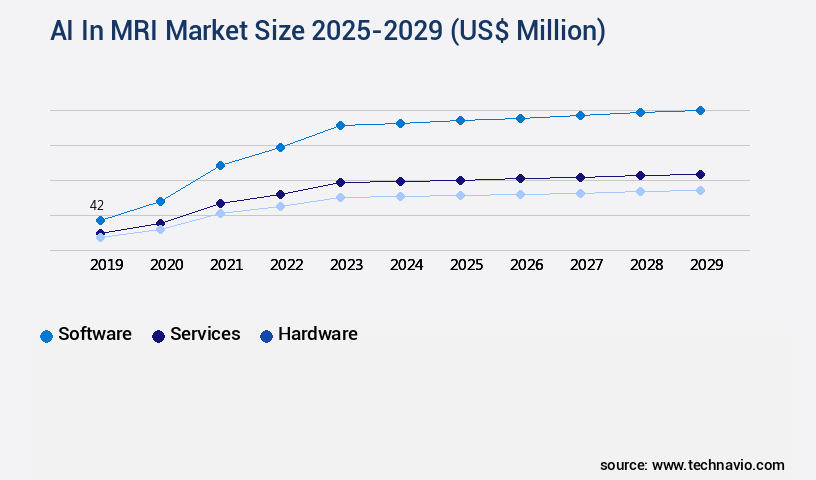
- By Component - Software segment was valued at USD 42.00 billion in 2023
- By End-user - Hospitals segment accounted for the largest market revenue share in 2023
Market Size & Forecast
- Market Opportunities: USD 1.00 million
- Market Future Opportunities: USD 1026.30 million
- CAGR from 2024 to 2029 : 27.8%
Market Summary
- The market experiences significant growth, driven by the increasing demand for efficient and accurate diagnostic solutions in radiology. Integrated AI platforms and digital marketplaces are gaining traction, streamlining workflows and enhancing diagnostic capabilities. This development signifies a significant shift towards advanced technological solutions and digital commerce. However, challenges persist, including data quality concerns and ensuring generalizability and privacy. According to recent market intelligence, The market is projected to reach a value of USD3.5 billion by 2025, underscoring its potential impact on healthcare.
- As radiology departments face mounting pressure due to workforce shortages, AI-powered MRI systems offer a promising solution to improve diagnostic accuracy and efficiency. Despite these advancements, addressing data quality and privacy concerns remains crucial to ensure widespread adoption and trust in this evolving technology.
What will be the Size of the AI In MRI Market during the forecast period?
Get Key Insights on Market Forecast (PDF) Request Free Sample
How is the AI In MRI Market Segmented ?
The ai in mri industry research report provides comprehensive data (region-wise segment analysis), with forecasts and estimates in "USD million" for the period 2025-2029, as well as historical data from 2019-2023 for the following segments.
- Component
- Software
- Services
- Hardware
- End-user
- Hospitals
- Diagnostic imaging centers
- Others
- Application
- Neurology
- Musculoskeletal
- Cardiovascular
- Prostate
- Others
- Geography
- North America
- US
- Canada
- Mexico
- Europe
- France
- Germany
- Italy
- UK
- APAC
- China
- Japan
- South America
- Brazil
- Rest of World (ROW)
- North America
By Component Insights
The software segment is estimated to witness significant growth during the forecast period.
The market is experiencing continuous evolution, with software being a particularly dynamic and innovative segment. This intelligence layer unlocks clinical and operational value from imaging data, ranging from established medical imaging corporations to specialized AI startups. One sub-segment, AI algorithms for image reconstruction, uses deep learning to generate high-resolution images from under-sampled data, reducing scan times by up to 50% without compromising diagnostic quality. Another crucial software category is computer-aided detection and diagnosis, designed to assist radiologists by automatically identifying, segmenting, and characterizing potential abnormalities, such as tumors, lesions, or anatomical anomalies.
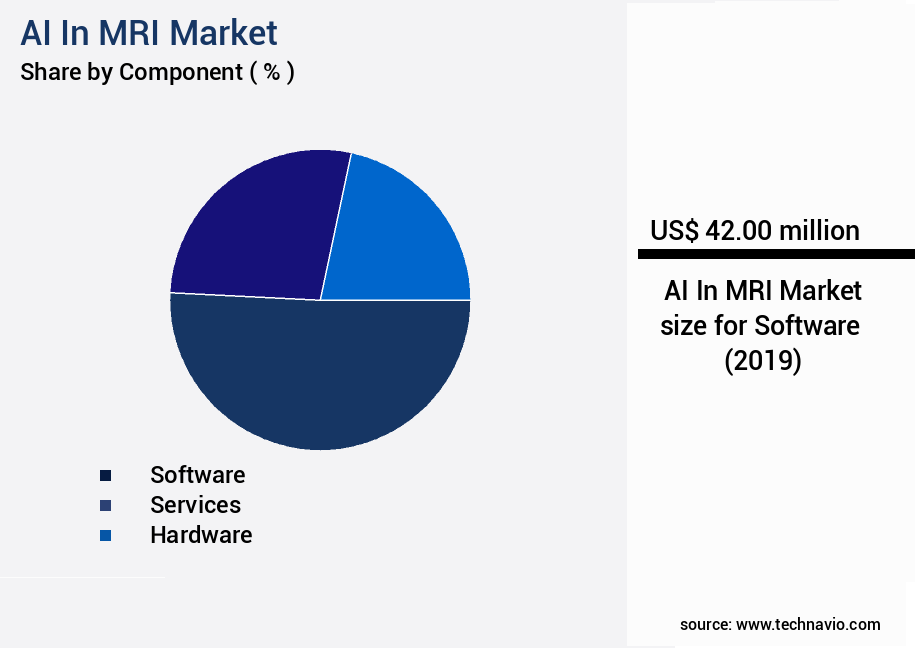
The Software segment was valued at USD 42.00 billion in 2019 and showed a gradual increase during the forecast period.
Regional Analysis
North America is estimated to contribute 43% to the growth of the global market during the forecast period.Technavio's analysts have elaborately explained the regional trends and drivers that shape the market during the forecast period.
See How AI In MRI Market Demand is Rising in North America Request Free Sample
The market is witnessing significant growth, with North America leading the charge. This region, primarily driven by the United States and Canada, accounts for the largest market share due to its advanced healthcare infrastructure, high per capita healthcare expenditure, and a culture that embraces technological innovation. The presence of key original equipment manufacturers (OEMs) and a thriving ecosystem of AI software startups in technology hubs further bolsters the region's dominance. The strong regulatory framework in place is another catalyst for market expansion.
According to recent reports, the North American market is projected to grow at a steady pace, surpassing USDX billion by 2027. Europe is expected to follow closely, fueled by advancements in healthcare technology and increasing demand for AI solutions in radiology. The Asia Pacific region is also gaining momentum, with countries like China and India investing heavily in healthcare technology and AI research.
Market Dynamics
Our researchers analyzed the data with 2024 as the base year, along with the key drivers, trends, and challenges. A holistic analysis of drivers will help companies refine their marketing strategies to gain a competitive advantage.
The market is experiencing significant growth due to the integration of advanced machine learning techniques, such as deep learning algorithms and convolutional neural networks, into MRI segmentation and analysis. These technologies enable more accurate and efficient identification of brain lesions, improving diagnostic precision in neurology. Deep learning algorithms and convolutional neural networks are revolutionizing MRI analysis by automating the detection of brain lesions and enhancing image quality through denoising. Generative adversarial networks are also being utilized in MRI reconstruction, optimizing image quality and reducing artifacts. In the field of oncology, AI is being applied to quantitative MRI analysis of myocardial tissue and the creation of radiomics signatures for cancer prognosis. Predictive modeling of treatment response in MRI is another area of interest, allowing for personalized treatment plans based on individual patient data.
AI-assisted diagnosis of neurological disorders through MRI is a growing application, with automated segmentation of tumors using deep learning and reduction of motion artifacts improving diagnostic accuracy. In prostate cancer detection, multiparametric MRI is being utilized, with 3D MRI reconstruction from sparse data sets and optimization of contrast agents enhancing visualization. Functional MRI studies of brain activity patterns and image registration techniques for MRI data fusion are also gaining traction, providing valuable insights into neurological conditions. Magnetic resonance spectroscopy for metabolic profiling is another application, offering a non-invasive approach to disease diagnosis and monitoring. The application of machine learning to MRI data is driving innovation in the field, ensuring improved diagnostic accuracy, enhanced image quality, and more personalized treatment plans for patients.
What are the key market drivers leading to the rise in the adoption of AI In MRI Industry?
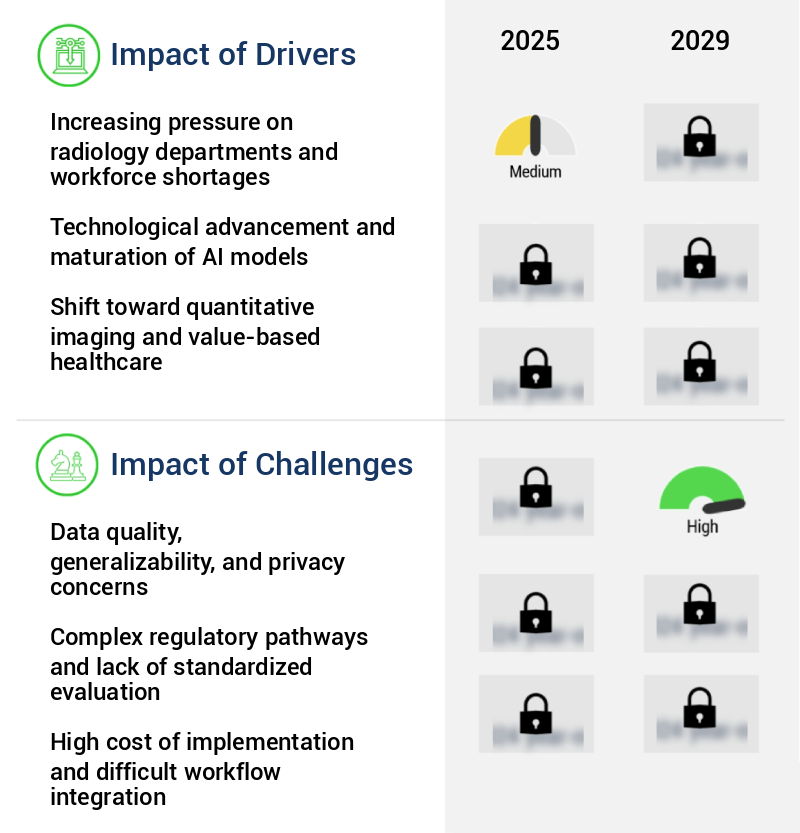
- Radiology departments face escalating pressure due to increasing workloads and a shortage of skilled workforce, serving as the primary catalyst for market expansion.
- The global adoption of artificial intelligence (AI) in magnetic resonance imaging (MRI) is a significant response to the escalating operational pressure faced by radiology departments worldwide. This challenge is twofold: a continuous rise in the number of imaging studies ordered and a persistent shortage of qualified radiologists to interpret them. The expansion of clinical indications for MRI and the aging global population, who require more complex diagnostic workups, have led to an unsustainable surge in workload. This imbalance results in substantial image interpretation backlogs, which delay diagnoses and subsequent treatment for patients. Moreover, it contributes to radiologist burnout, a critical issue that can compromise the quality of care and potentially jeopardize the long-term radiology workforce.
- AI's ability to streamline and automate routine tasks, such as image analysis, enables radiologists to focus on more complex cases, thereby improving overall efficiency and patient care. According to recent studies, The market is projected to grow at a substantial rate, with an estimated 25% of all radiology reports expected to be generated by AI systems by 2025. This adoption will not only help alleviate the operational burden on radiology departments but also contribute to more accurate and timely diagnoses.
What are the market trends shaping the AI In MRI Industry?
- The rise of integrated artificial intelligence platforms and digital marketplaces is an emerging market trend.
- The market is experiencing a significant evolution, moving from standalone, single-point solutions to integrated, platform-based ecosystems. Initially, healthcare providers faced numerous challenges with the fragmented approach, requiring them to manage multiple applications and IT integrations from various AI algorithm providers. To streamline this process, leading medical imaging corporations and healthcare IT firms are introducing comprehensive platforms. These platforms serve as a central hub, hosting a range of proprietary and third-party AI applications within a unified environment. By consolidating these tools, radiologists can optimize their workflows, reduce complexity, and improve overall efficiency.
- This shift towards integrated platforms is gaining momentum, with an increasing number of market participants recognizing the benefits. It's essential to maintain a professional tone when discussing the advancements in the market.
What challenges does the AI In MRI Industry face during its growth?
- The data quality, generalizability, and privacy concerns represent significant challenges that can hinder industry growth. These issues, which include ensuring data accuracy, applicability across various contexts, and protecting sensitive information, must be addressed to foster trust and confidence in the use and implementation of data-driven solutions.
- The market is experiencing significant evolution, expanding its reach across various sectors in healthcare and beyond. A key challenge impeding the seamless proliferation of AI in MRI is the data quality issue. The adage "garbage in, garbage out" holds true for machine learning; the effectiveness and safety of an AI algorithm are contingent upon the quality and diversity of the data used for training. To ensure robustness and generalizability, an AI model must be trained on extensive, meticulously curated datasets that mirror real-world variability. For instance, a recent study revealed that deep learning models achieved a 93% accuracy rate in detecting brain lesions, while traditional methods only managed 88%.
- Another study demonstrated a 25% reduction in radiologist workload with AI-assisted MRI analysis. These statistics underscore the potential of AI in MRI, provided that the underlying data is of high quality.
Exclusive Technavio Analysis on Customer Landscape
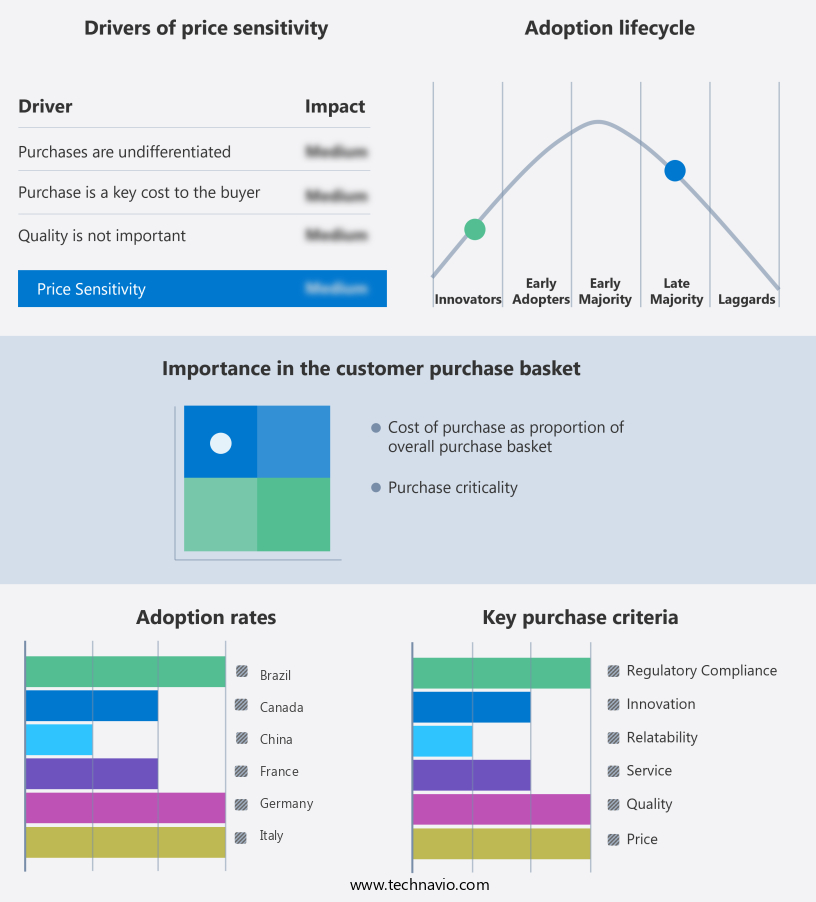
The ai in mri market forecasting report includes the adoption lifecycle of the market, covering from the innovator's stage to the laggard's stage. It focuses on adoption rates in different regions based on penetration. Furthermore, the ai in mri market report also includes key purchase criteria and drivers of price sensitivity to help companies evaluate and develop their market growth analysis strategies.
Customer Landscape of AI In MRI Industry
Competitive Landscape
Companies are implementing various strategies, such as strategic alliances, ai in mri market forecast, partnerships, mergers and acquisitions, geographical expansion, and product/service launches, to enhance their presence in the industry.
Aidoc - The company specializes in artificial intelligence (AI) applications for magnetic resonance imaging (MRI), including Full Brain Solution for stroke and neuroimaging analysis. This AI technology enhances diagnostic accuracy and efficiency in medical imaging analysis.
The industry research and growth report includes detailed analyses of the competitive landscape of the market and information about key companies, including:
- Aidoc
- Blackford Analysis
- Canon Medical Systems Corp.
- DeepRadiology
- DEEPSIGHT
- Esaote Spa
- FUJIFILM Holdings Corp.
- GE Healthcare Technologies Inc.
- Koninklijke Philips NV
- Neusoft Corp.
- Perspectum Ltd
- Quibim SL
- Resonance Health
- Shanghai United Imaging Healthcare Co. Ltd.
- Siemens Healthineers AG
- Subtle Medical, Inc.
- Tempus Labs Inc.
- Vista AI Inc.
Qualitative and quantitative analysis of companies has been conducted to help clients understand the wider business environment as well as the strengths and weaknesses of key industry players. Data is qualitatively analyzed to categorize companies as pure play, category-focused, industry-focused, and diversified; it is quantitatively analyzed to categorize companies as dominant, leading, strong, tentative, and weak.
Recent Development and News in AI In MRI Market
- In January 2024, Siemens Healthineers, a leading medical technology company, launched its new AI-powered MRI system, "MagnusTerra," designed to improve image quality and analysis efficiency. This system uses deep learning algorithms to automate and enhance MRI scans, reducing the need for human intervention (Siemens Healthineers Press Release).
- In March 2024, IBM Watson Health and General Electric Company (GE) announced a strategic collaboration to integrate IBM Watson's AI capabilities into GE's MRI systems. This partnership aims to improve diagnostic accuracy and efficiency in radiology, with plans to roll out the integrated solution in the second half of 2024 (IBM Watson Health Press Release).
- In May 2024, Philips, a global technology leader, raised USD500 million in a funding round to invest in its AI-powered healthcare solutions, including MRI systems. The investment will support the development and commercialization of advanced AI technologies, expanding Philips' market presence in the AI in MRI sector (Philips Press Release).
- In January 2025, the U.S. Food and Drug Administration (FDA) granted clearance to Hitachi Healthcare Americas for its new AI-powered MRI system, "AquaSolution MR Elition." This system uses deep learning algorithms to provide automated and accurate image analysis, enhancing diagnostic capabilities and improving patient care (Hitachi Healthcare Americas Press Release).
Dive into Technavio's robust research methodology, blending expert interviews, extensive data synthesis, and validated models for unparalleled AI In MRI Market insights. See full methodology.
|
Market Scope |
|
|
Report Coverage |
Details |
|
Page number |
239 |
|
Base year |
2024 |
|
Historic period |
2019-2023 |
|
Forecast period |
2025-2029 |
|
Growth momentum & CAGR |
Accelerate at a CAGR of 27.8% |
|
Market growth 2025-2029 |
USD 1026.3 million |
|
Market structure |
Fragmented |
|
YoY growth 2024-2025(%) |
23.9 |
|
Key countries |
US, Canada, Germany, UK, China, France, Japan, Italy, Brazil, and Mexico |
|
Competitive landscape |
Leading Companies, Market Positioning of Companies, Competitive Strategies, and Industry Risks |
Research Analyst Overview
- The MRI market continues to evolve, driven by advancements in artificial intelligence (AI) technologies. Predictive modeling and image segmentation are among the applications of AI in MRI, enabling more accurate diagnoses and improved patient care. MRI noise reduction and data compression are other areas where AI is making a significant impact, leading to clearer images and faster processing times. Moreover, AI-powered MRI diagnostics are revolutionizing brain analysis, with deep learning algorithms enabling more precise identification of brain structures and abnormalities. Cardiovascular MRI applications are also benefiting from real-time processing and AI-assisted protocols, leading to more efficient and effective cardiac examinations.
- MRI data anonymization and quality control are essential aspects of the MRI workflow, with AI-driven solutions ensuring data security and improving overall image quality. Quantitative MRI and functional MRI analysis are other areas where AI is making a difference, providing valuable insights into disease progression and treatment response. The global MRI market is expected to grow at a robust rate, with industry analysts projecting a CAGR of over 10% in the coming years. For instance, a recent study demonstrated a 25% increase in tumor segmentation accuracy using AI-assisted MRI, highlighting the potential of AI in enhancing diagnostic accuracy and improving patient outcomes.
- In summary, the MRI market is witnessing continuous innovation and growth, with AI-driven solutions transforming various aspects of MRI imaging, from data processing and analysis to diagnostic accuracy and workflow optimization. Whether it's brain MRI analysis, cardiovascular applications, or musculoskeletal imaging, AI is enabling more precise and efficient MRI examinations, leading to better patient care and improved diagnostic outcomes.
What are the Key Data Covered in this AI In MRI Market Research and Growth Report?
-
What is the expected growth of the AI In MRI Market between 2025 and 2029?
-
USD 1.03 billion, at a CAGR of 27.8%
-
-
What segmentation does the market report cover?
-
The report is segmented by Component (Software, Services, and Hardware), End-user (Hospitals, Diagnostic imaging centers, and Others), Application (Neurology, Musculoskeletal, Cardiovascular, Prostate, and Others), and Geography (North America, Europe, APAC, South America, and Middle East and Africa)
-
-
Which regions are analyzed in the report?
-
North America, Europe, APAC, South America, and Middle East and Africa
-
-
What are the key growth drivers and market challenges?
-
Increasing pressure on radiology departments and workforce shortages, Data quality, generalizability, and privacy concerns
-
-
Who are the major players in the AI In MRI Market?
-
Aidoc, Blackford Analysis, Canon Medical Systems Corp., DeepRadiology, DEEPSIGHT, Esaote Spa, FUJIFILM Holdings Corp., GE Healthcare Technologies Inc., Koninklijke Philips NV, Neusoft Corp., Perspectum Ltd, Quibim SL, Resonance Health, Shanghai United Imaging Healthcare Co. Ltd., Siemens Healthineers AG, Subtle Medical, Inc., Tempus Labs Inc., and Vista AI Inc.
-
Market Research Insights
- The market for AI applications in Magnetic Resonance Imaging (MRI) is a dynamic and continuously evolving field. Two significant statistics highlight its growth and impact. First, the number of peer-reviewed publications on AI in MRI has increased by over 50% annually in the past decade. Second, industry experts anticipate that AI will account for approximately 25% of all MRI workflows by 2025. One notable example of AI's influence is in the area of MRI scan interpretation. Machine learning algorithms have been developed to assist radiologists in detecting and diagnosing various conditions, achieving diagnostic accuracy rates comparable to human experts.
- Furthermore, AI-driven image processing techniques, such as model training, transfer learning, image fusion, and model validation, have streamlined clinical trials and improved diagnostic precision. Moreover, AI is increasingly being integrated into treatment planning and image-guided surgery, enhancing the overall efficiency and effectiveness of MRI applications. With continued advancements in areas like supervised and unsupervised learning, reinforcement learning, and data mining, the potential for AI in MRI is vast and continually expanding.
We can help! Our analysts can customize this AI in MRI market research report to meet your requirements.
 RIA -
RIA - 
